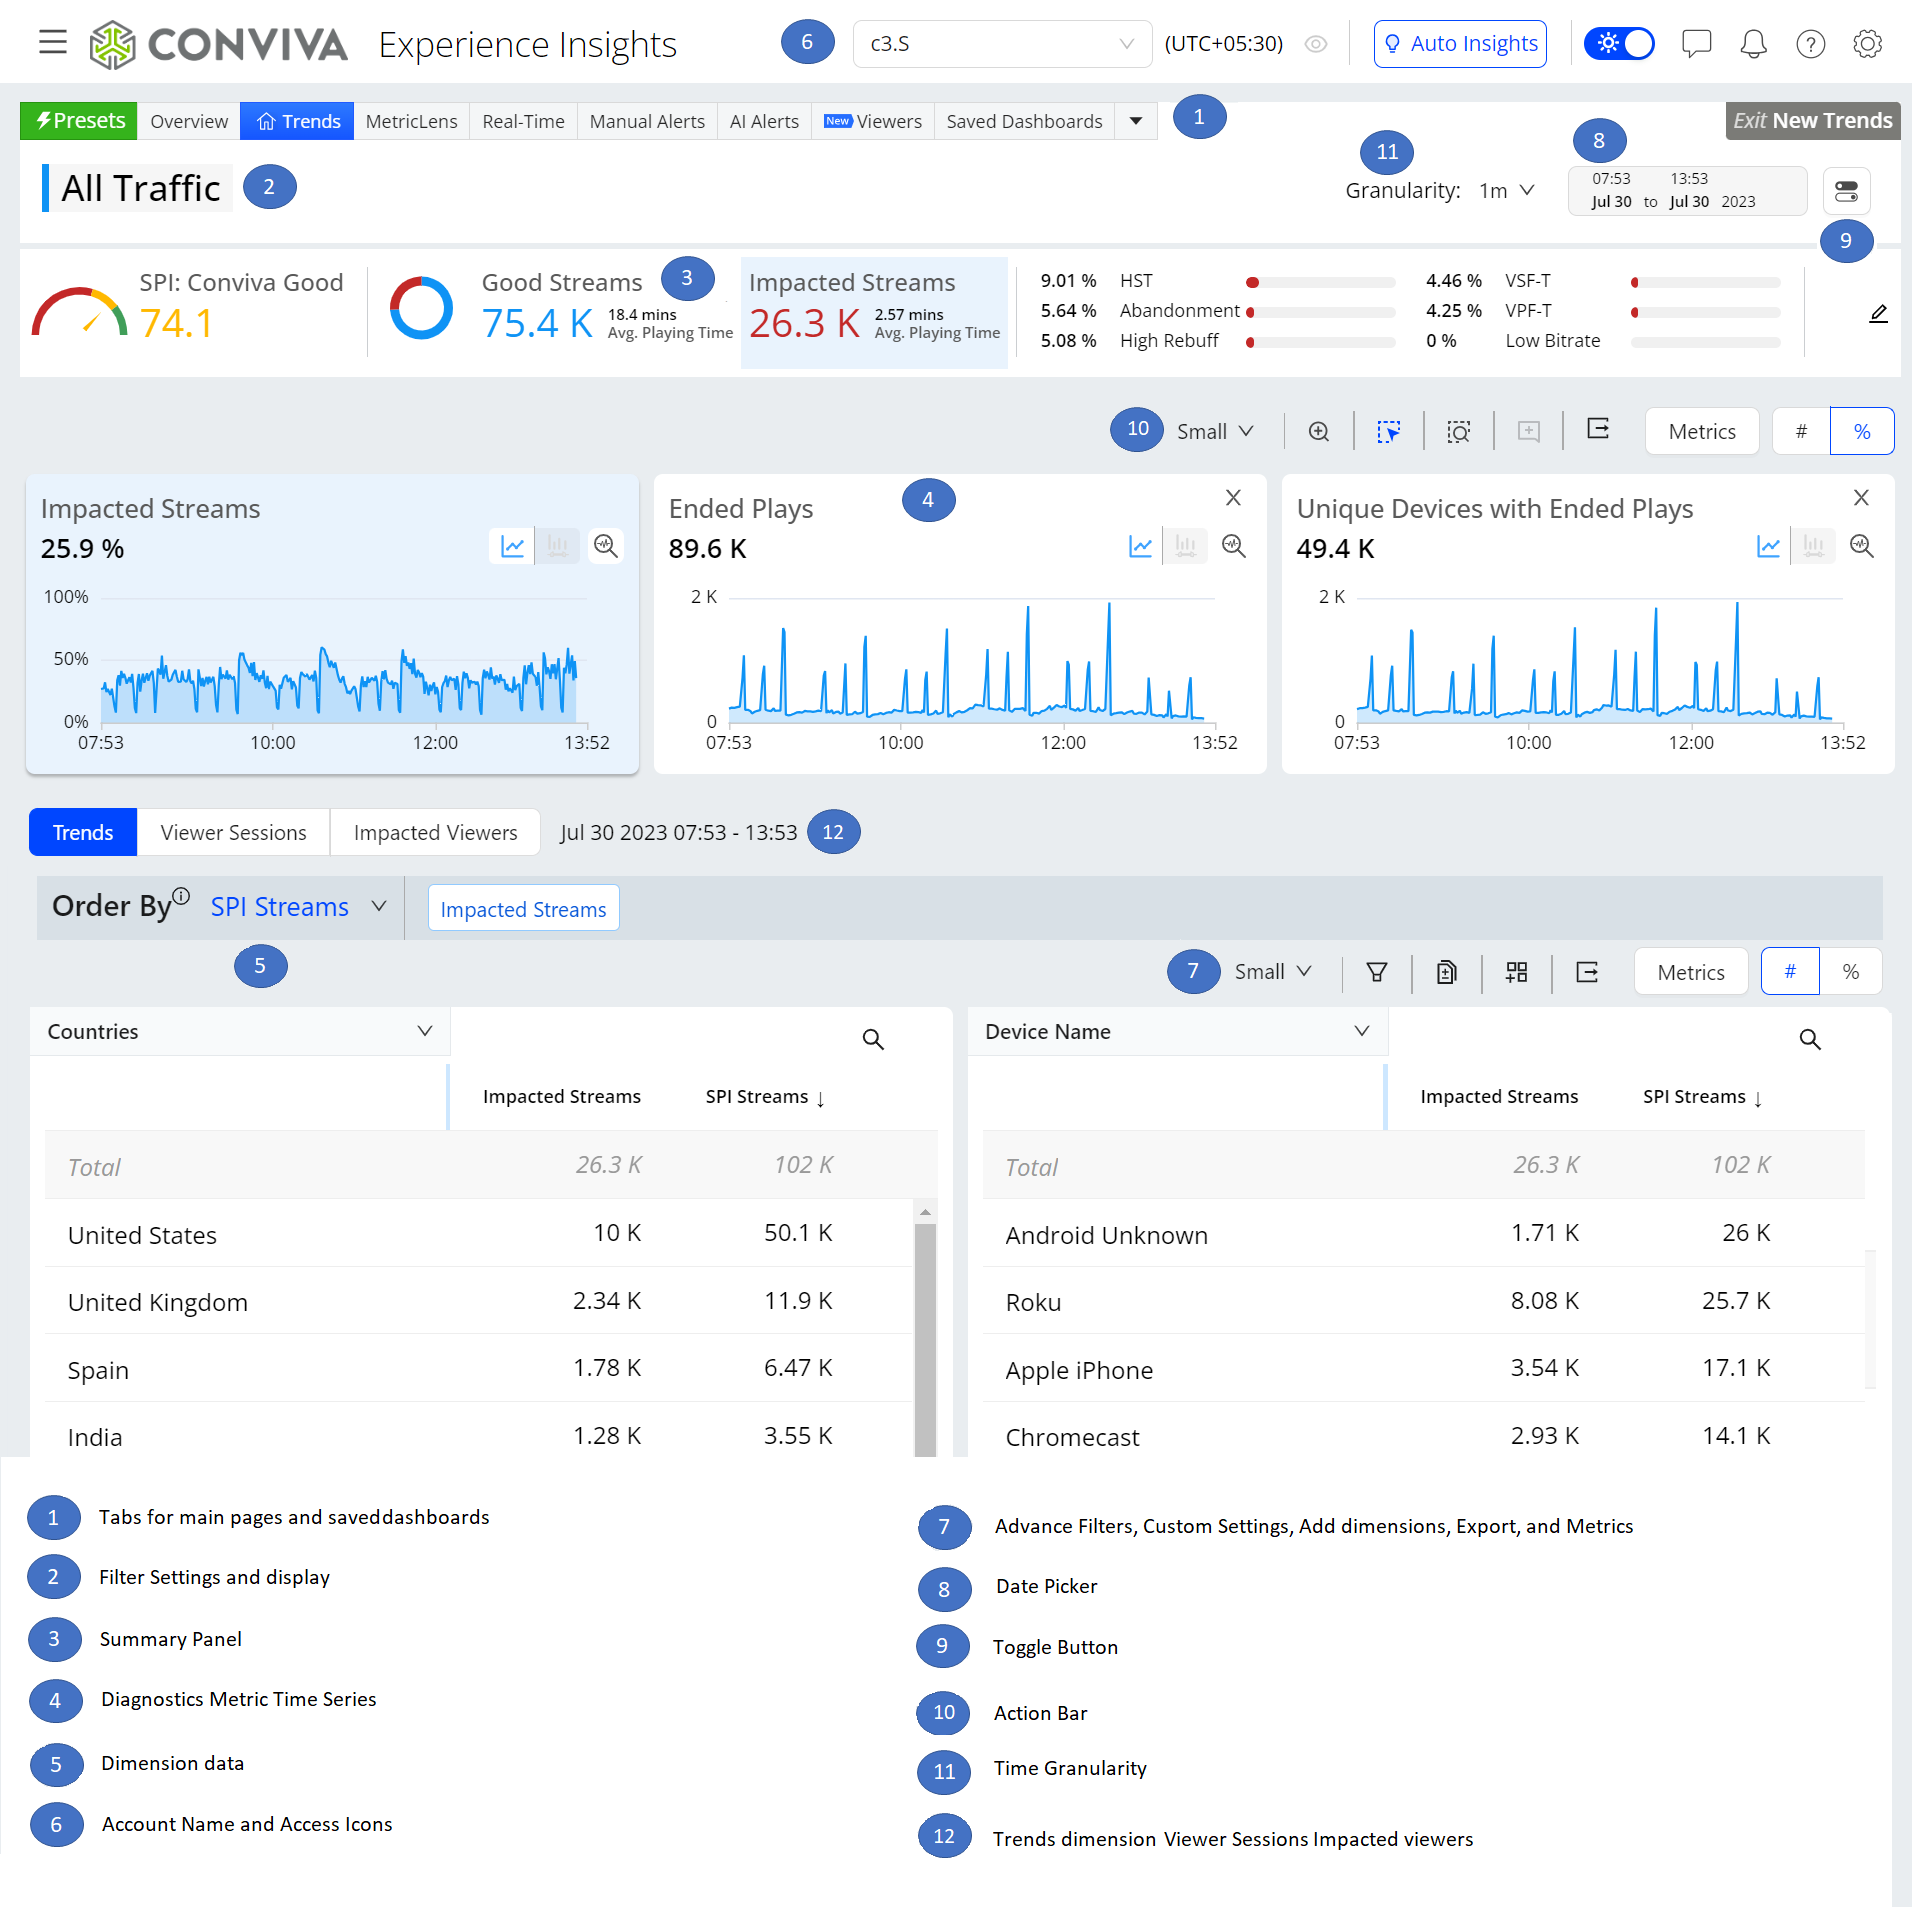
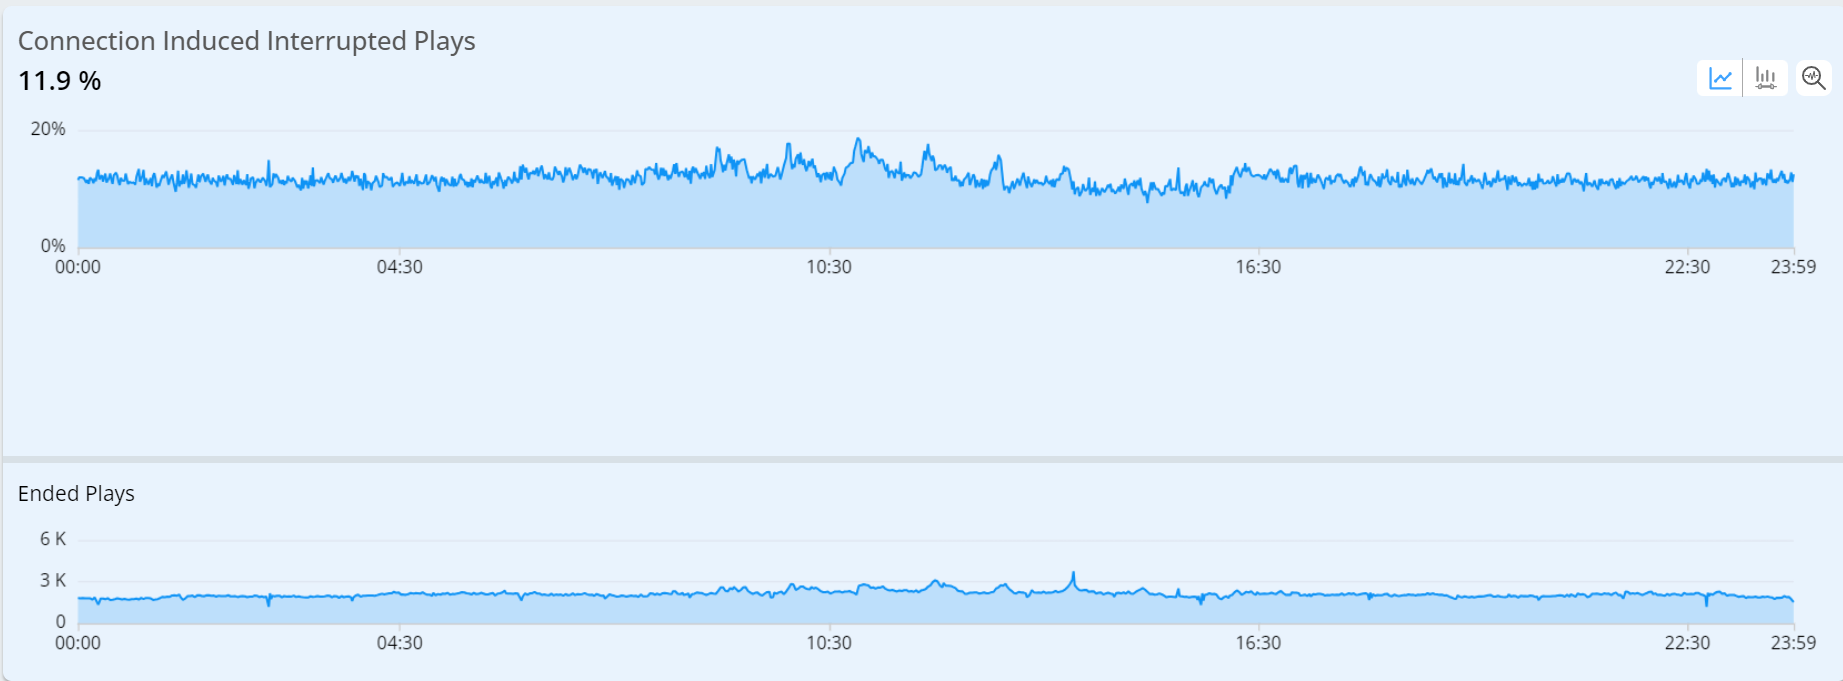
Conviva's VSI runs on the Conviva's high-scale, real-time platform, providing rapid data access with detailed granularity with one-click and advanced filtering for detailed dimensional drill-downs and industry-leading scalability across continuous real-time and historical monitoring for quick issue resolution and robust analytic tools for continuous improvements.
Note: For details about metric definitions, see the Metric Dictionary.
Interface Components | Issue Resolution | Continuous Improvement | Viewers | Basics |Diagnostics | Filtering |Focus |Layouts| Common Tasks by Persona
Interface Components
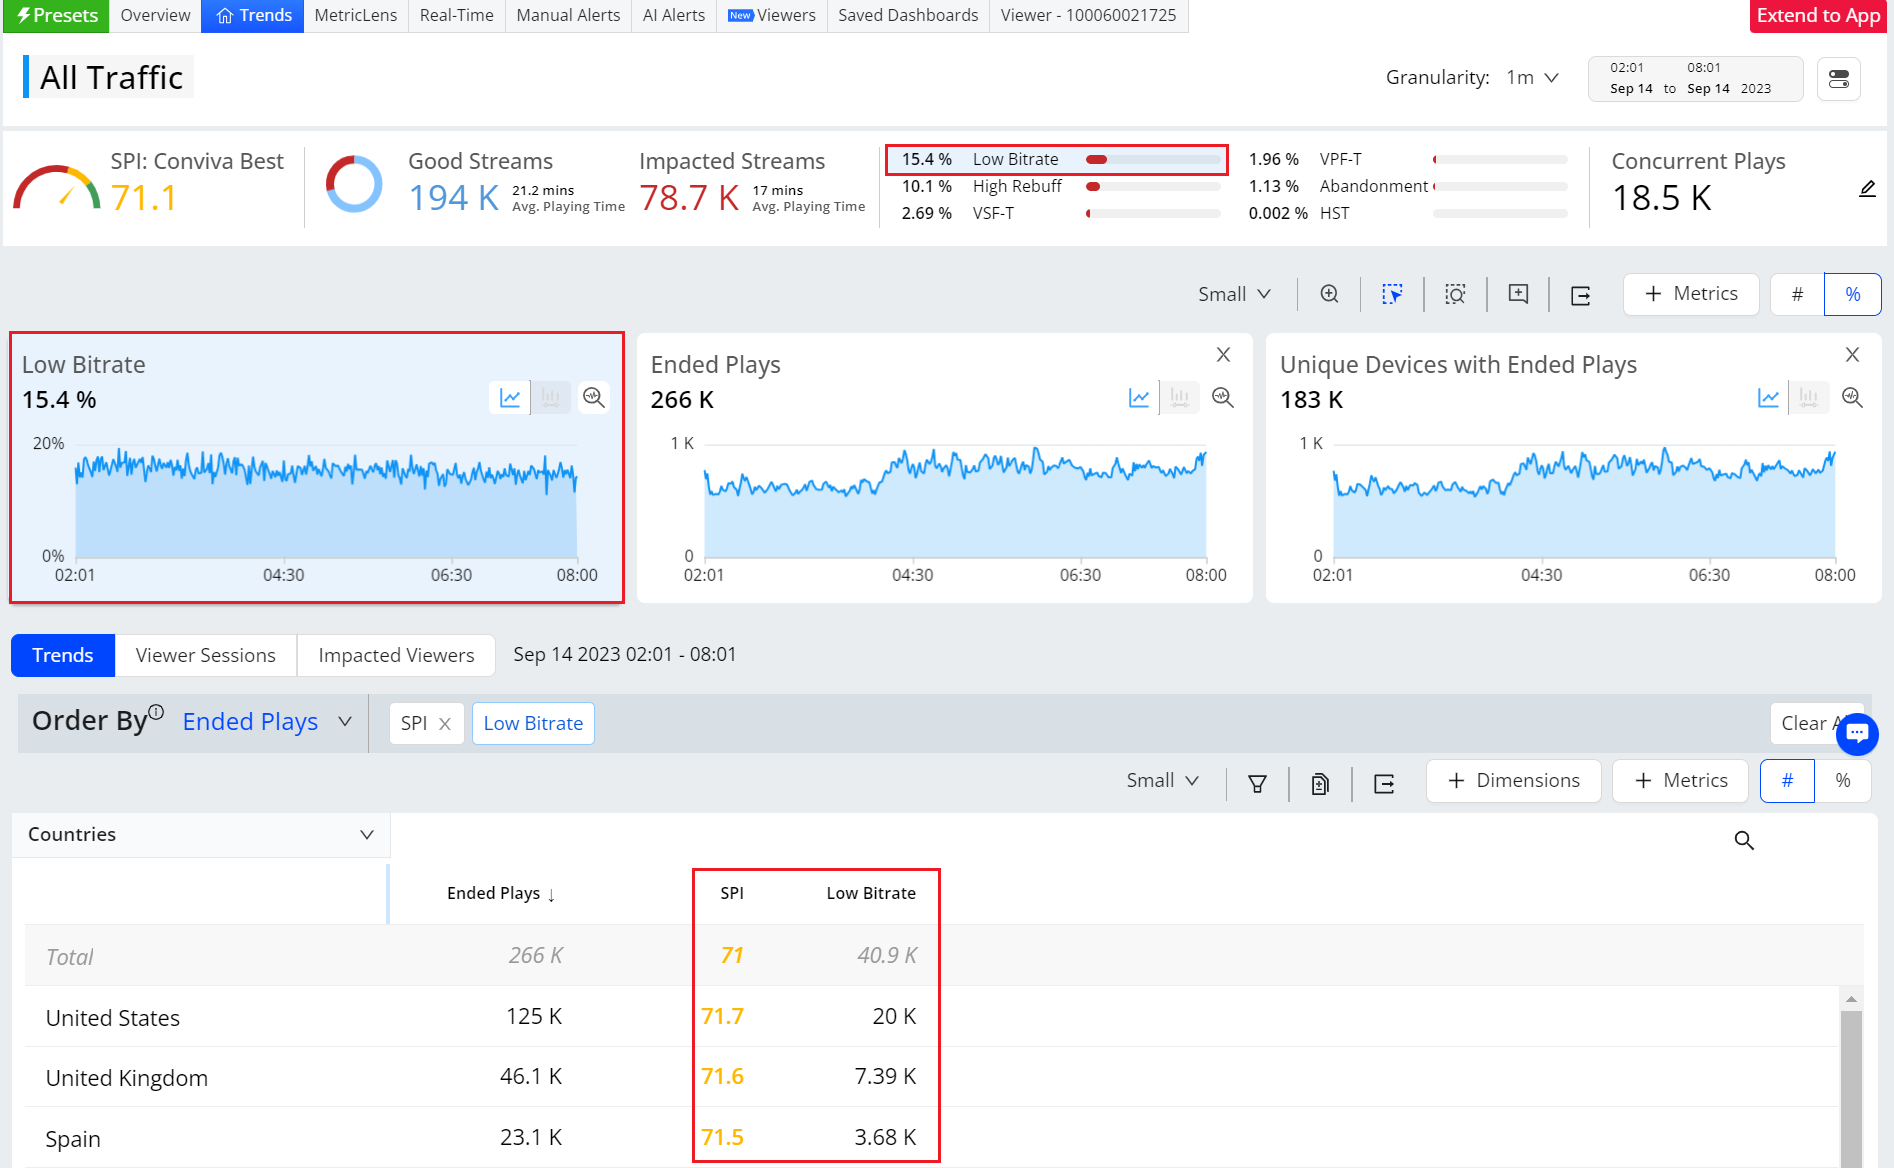
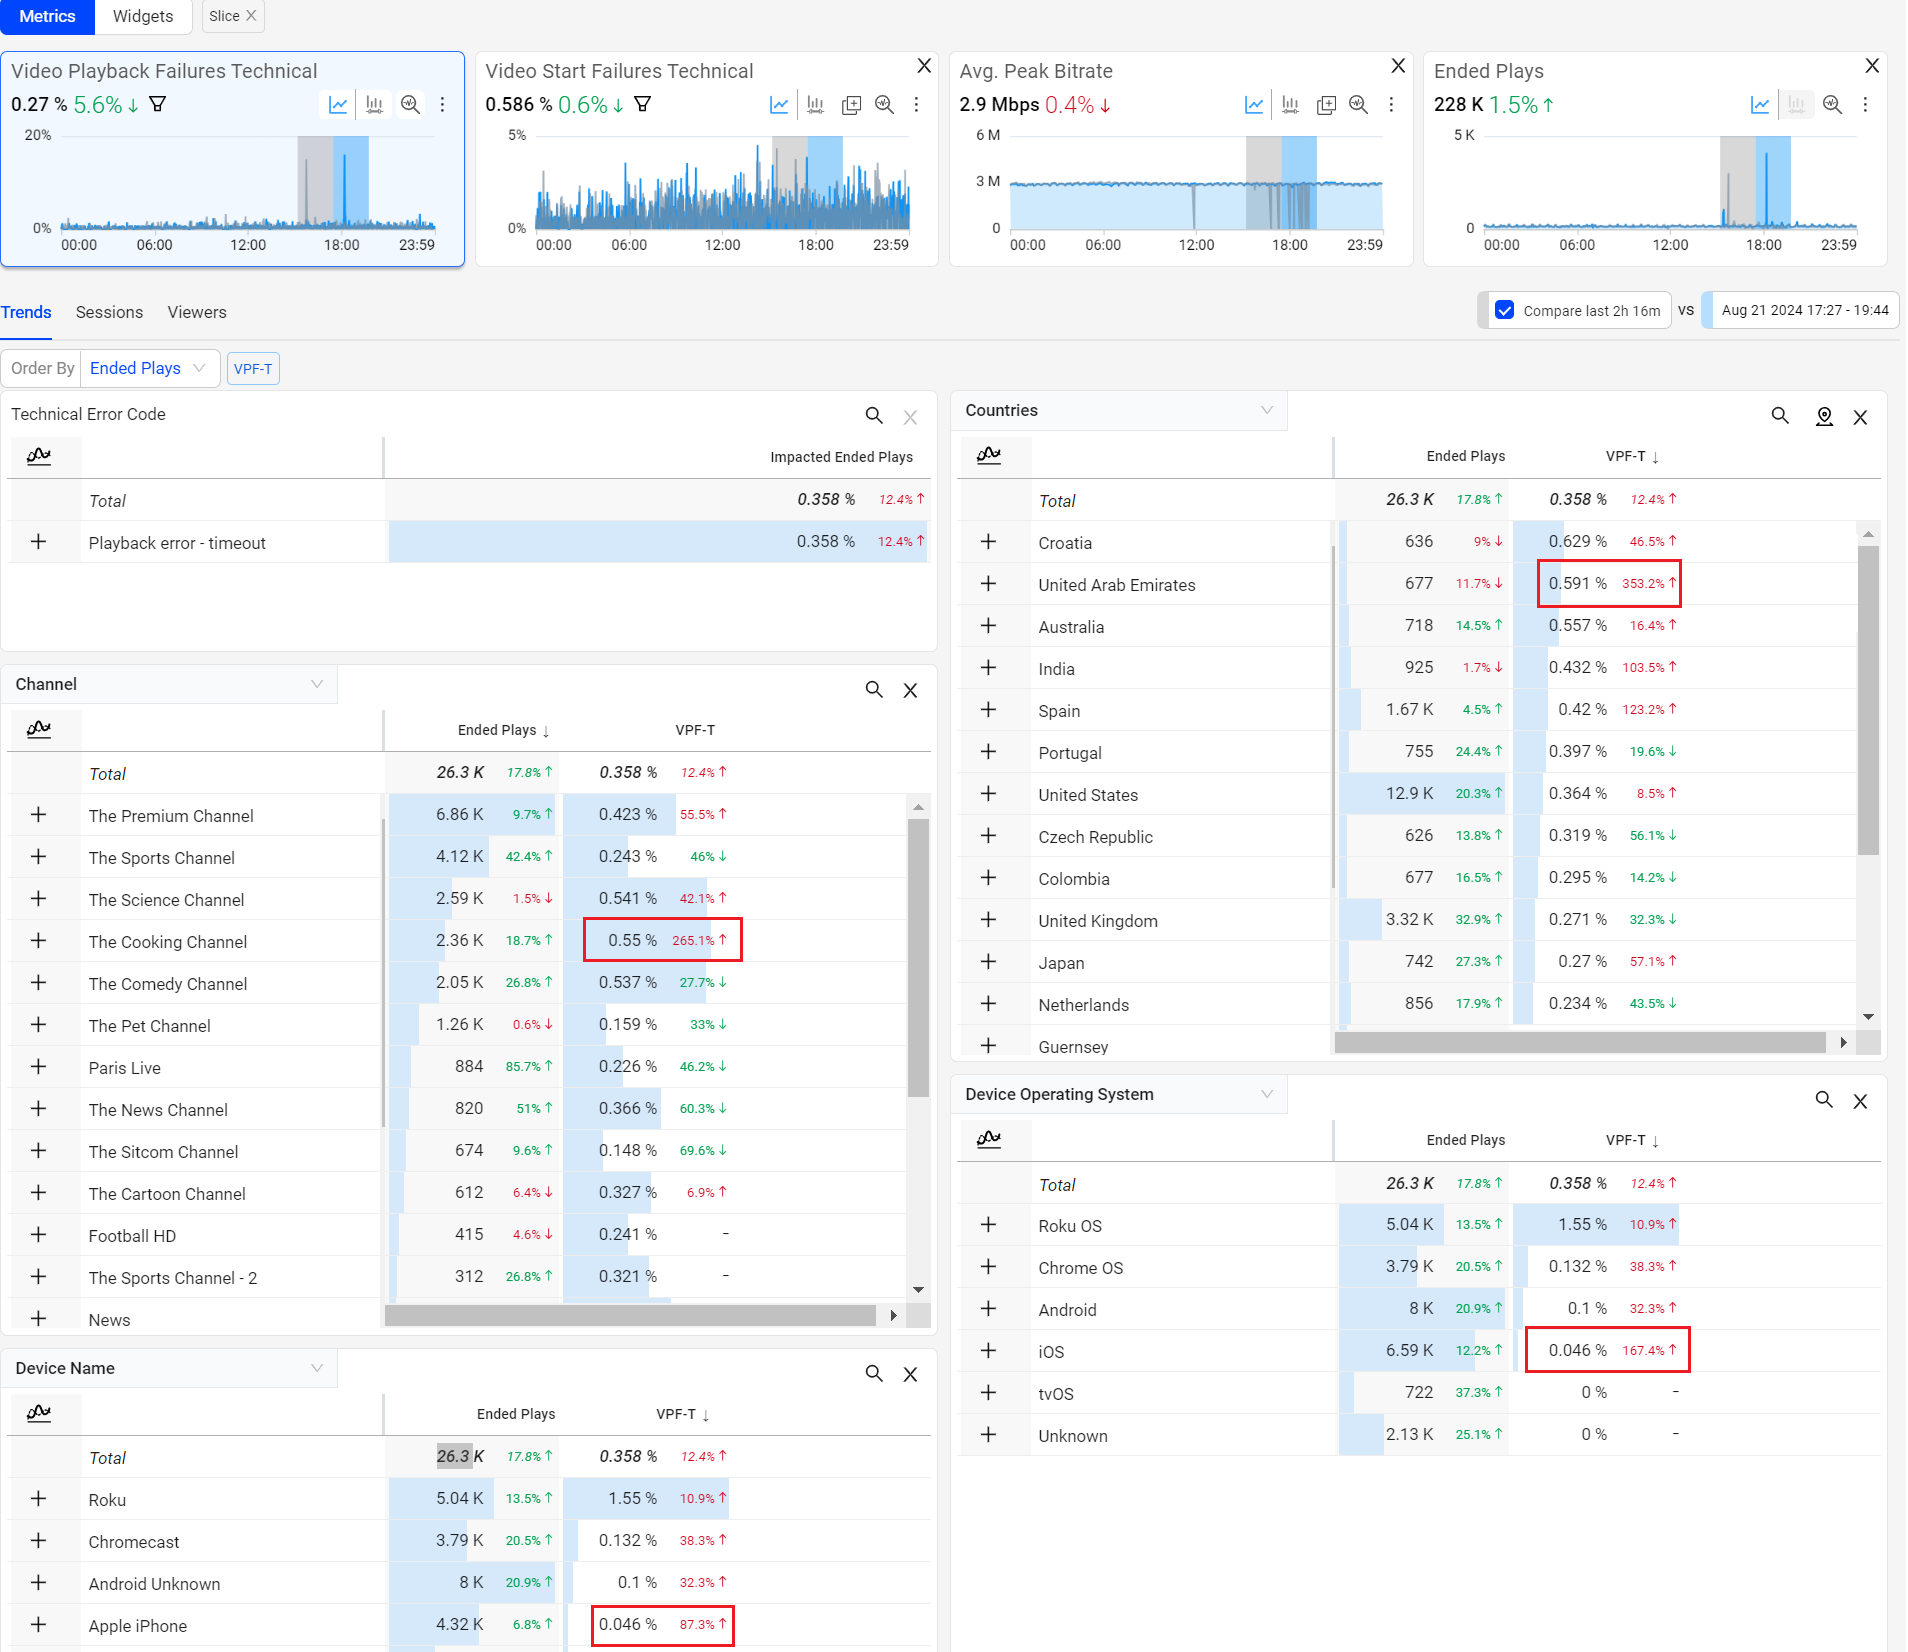
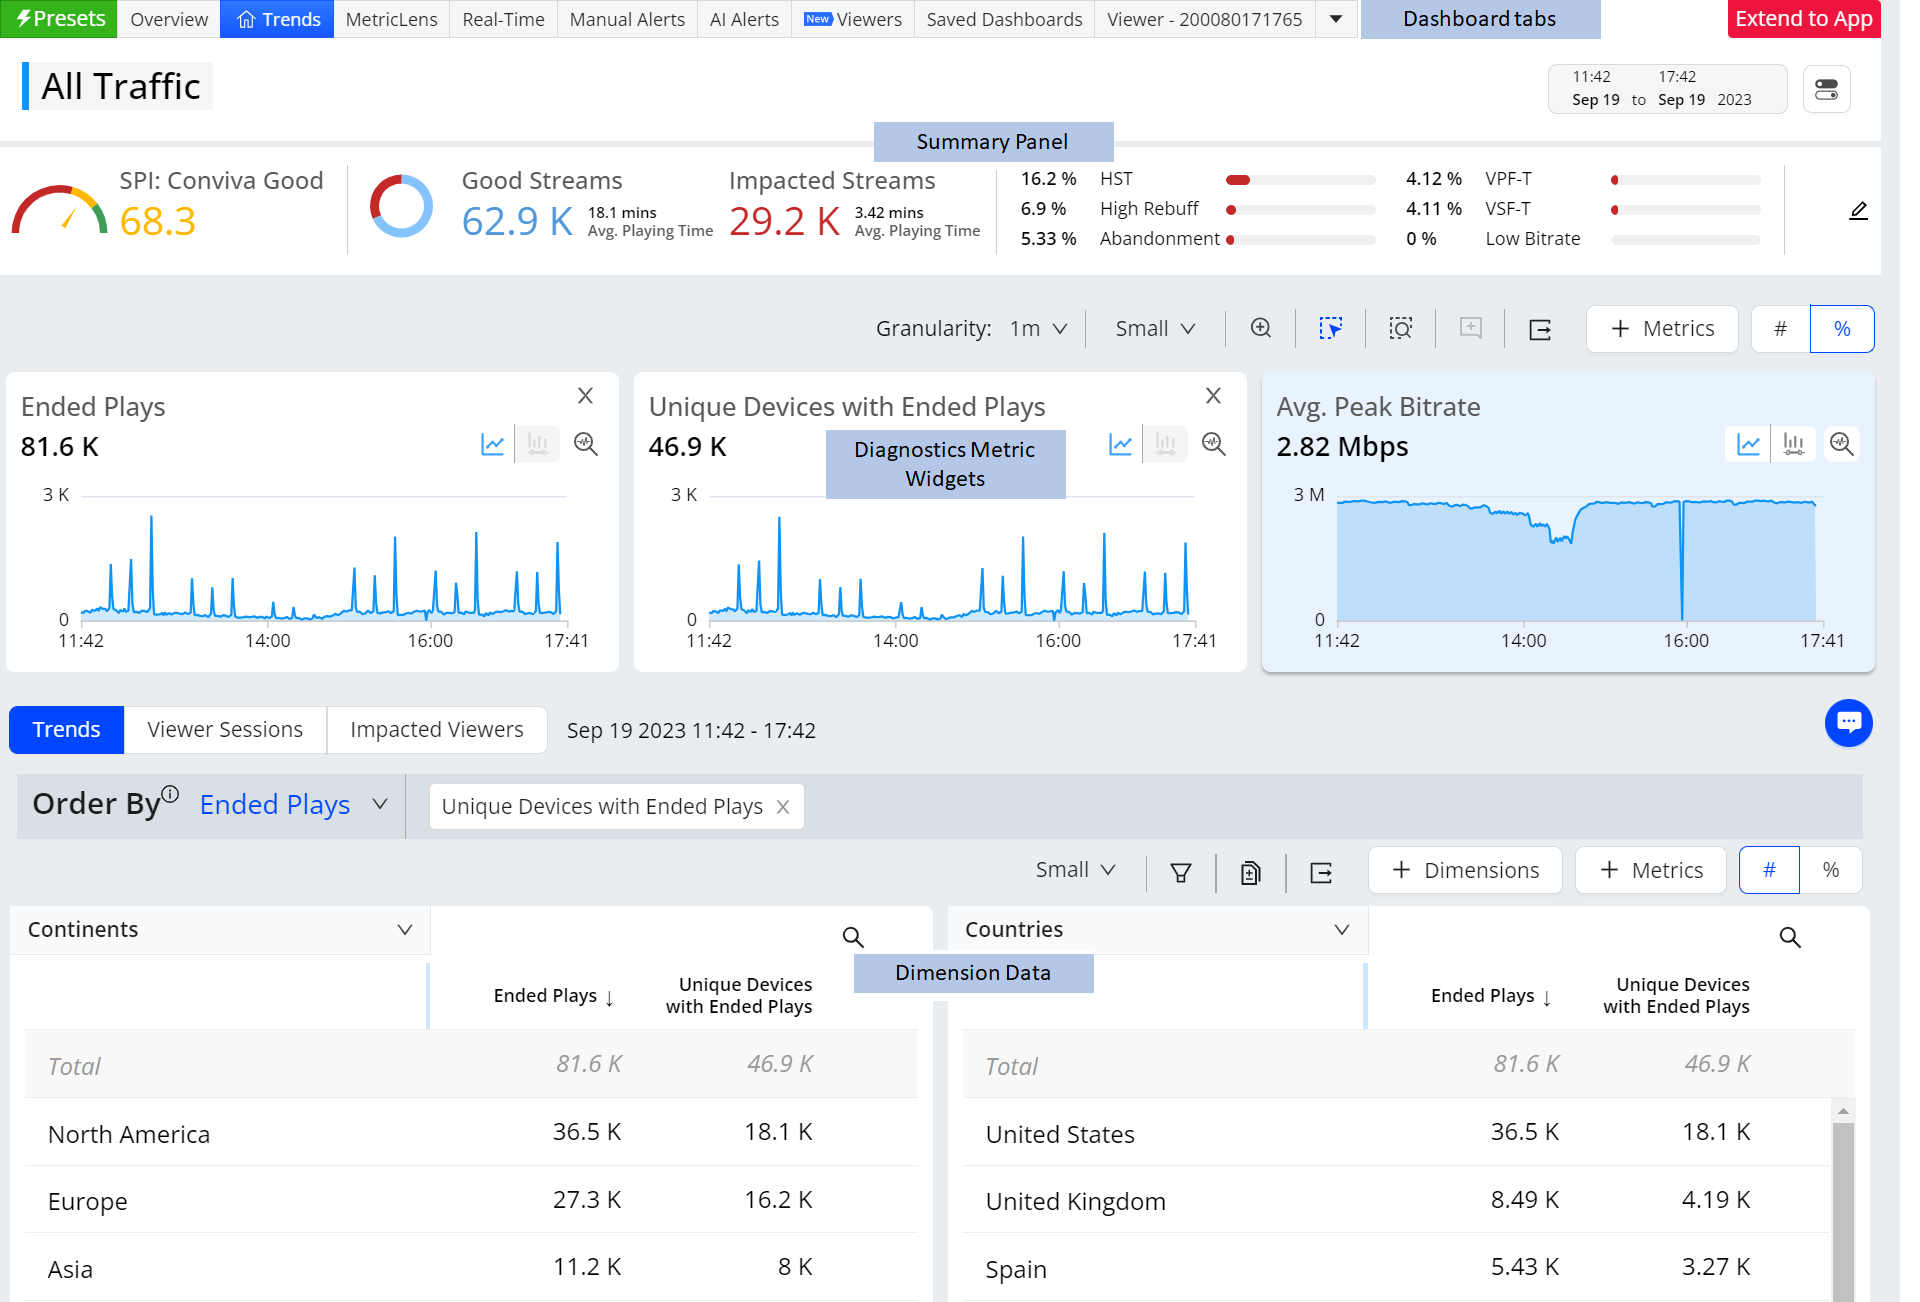
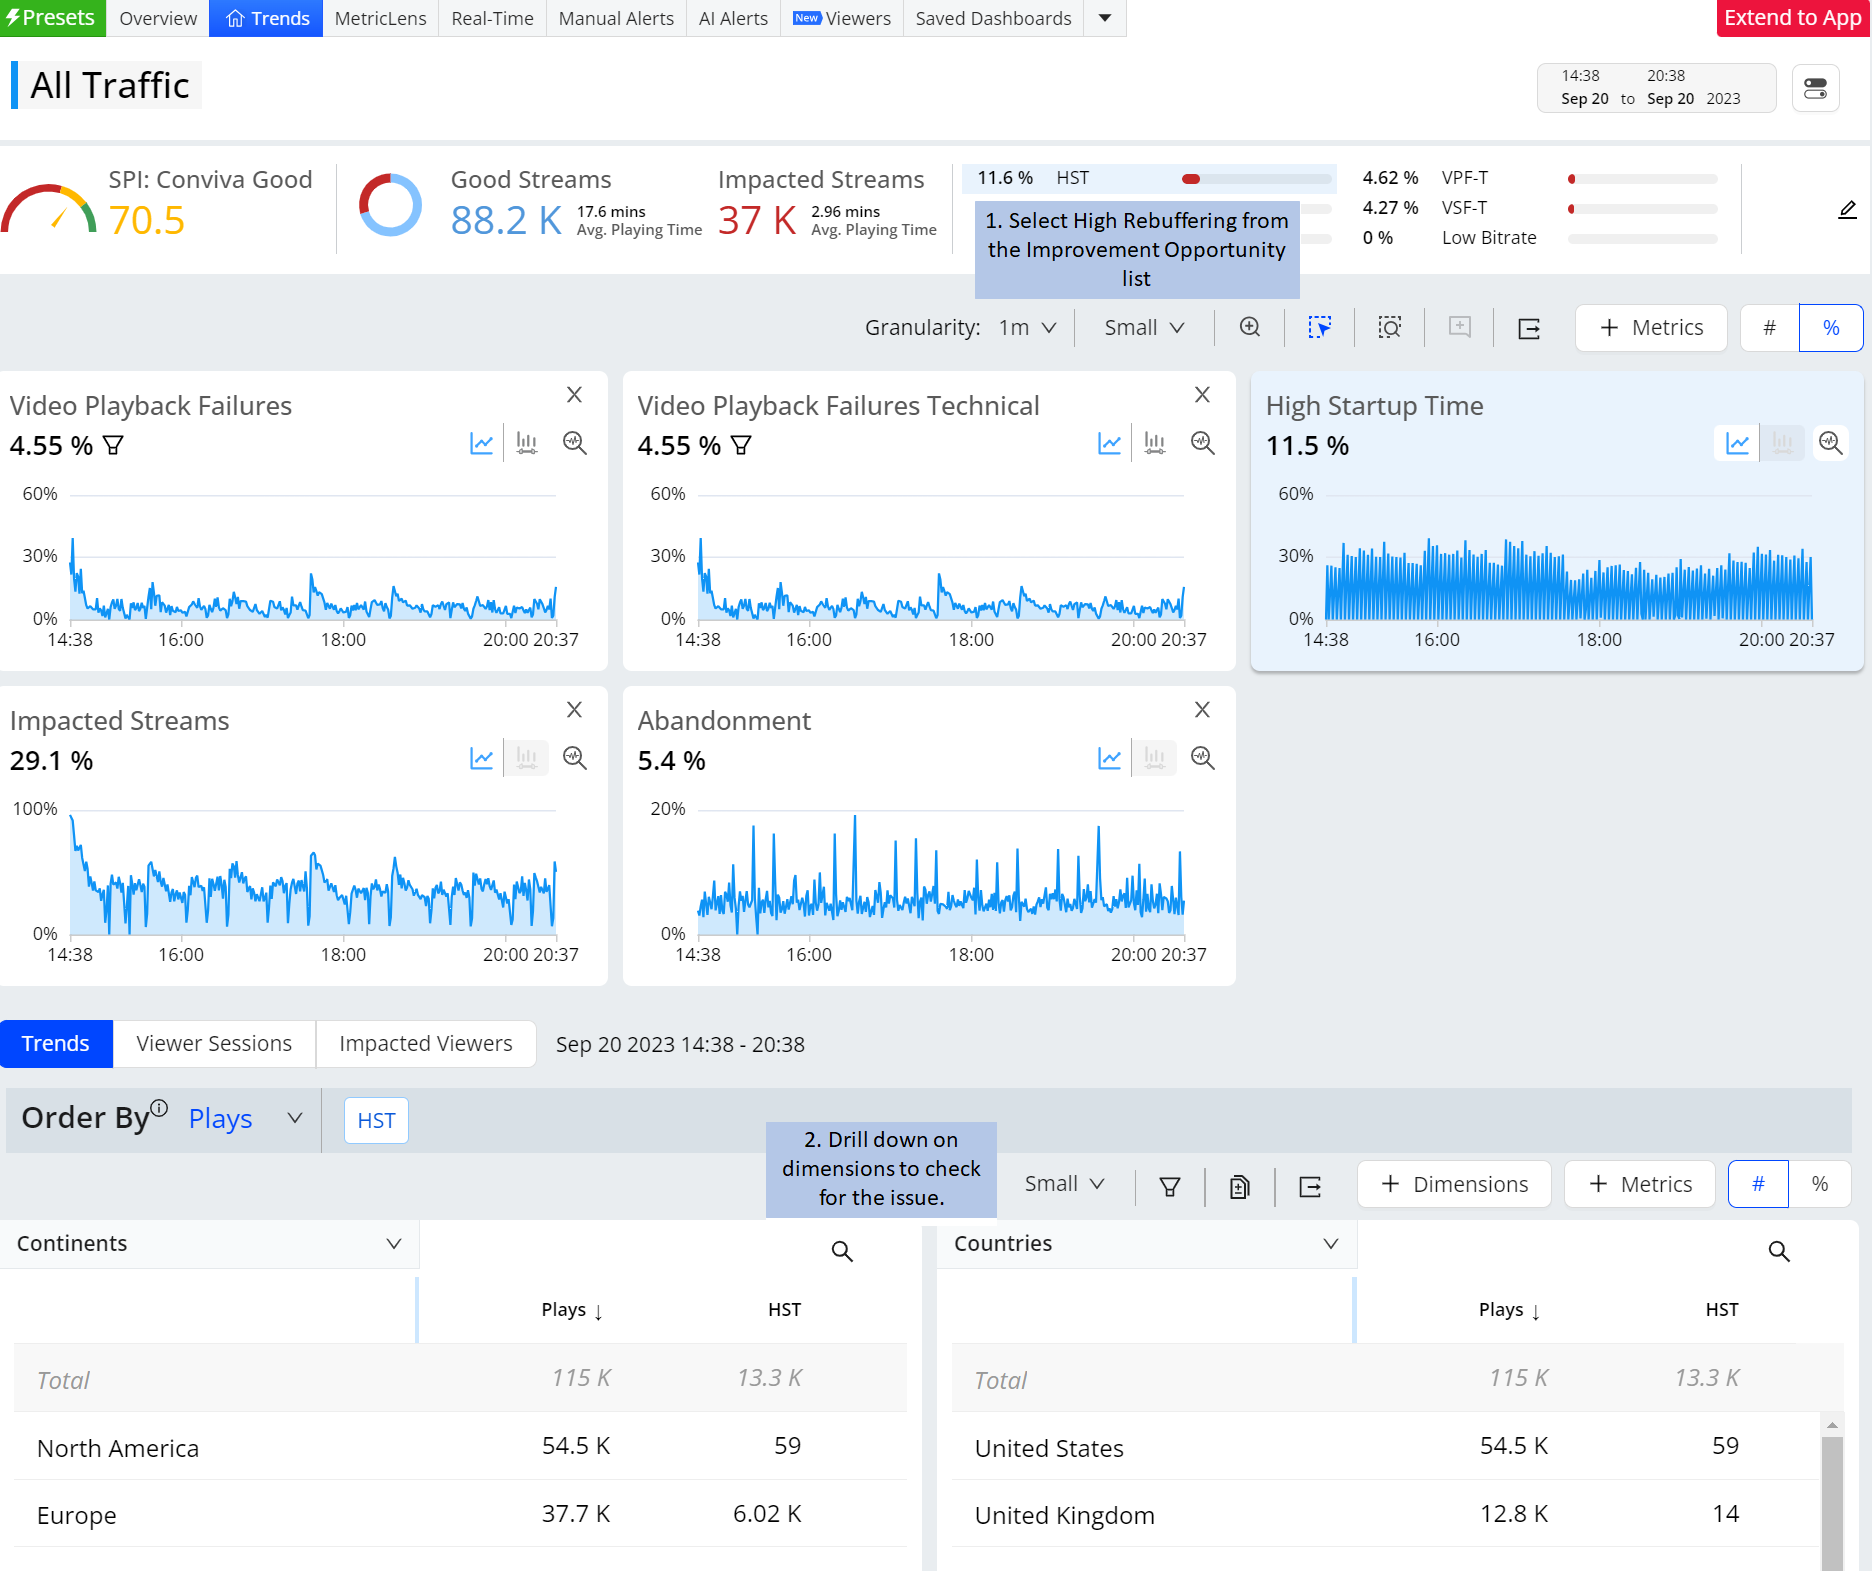
The Trends page exemplifies the ease-of-access to high-level insights for your video streams. You can quickly deep-dive into significant QoE trends and anomalies with quick navigation to advanced features like multidimensional comparisons, impacted session timelines, impacted viewers, and error code analysis.
For more details on ConvivaVSI menus and UI selections, see Navigation.
For a list of the supported metrics, see Metric Dictionary.
Feature Summary
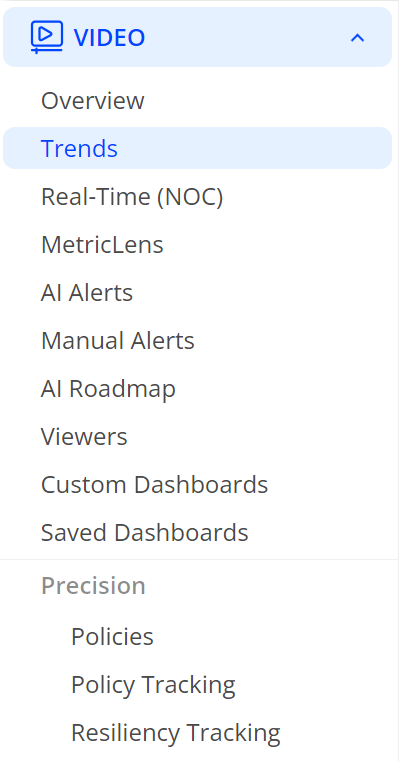
VSI menu and tabs provide quick access to the main application features.
|
Menu: Overview, Trends, Real-Time (NOC), MetricLens, AI Alerts, Manual Alerts, AI Roadmap, Viewers, Custom Dashboard, and Saved Dashboards |
Application Tabs: PromptAI, Presets, Overview, Trends, MetricLens, Real-Time, Manual Alerts, AI Alerts, Viewers, Saved Dashboards
|
- Overview: Quick view of audience metrics and impact, SPI settings, improvement opportunities, benchmarks, dimensional drill-downs.
-
Trends: summary metrics, metric widgets, dimensional drill-downs.
-
Real-Time: Live metric monitoring with visual threshold-crossing notifications.
-
AI Alerts: Automatic notifications based alert sensitivity, impacted devices, and persistence.
-
Manual Alerts: Notifications based on configured alert thresholds.
-
Viewers: Viewer activity and session details.
-
Saved Dashboards: Access to saved settings and displays.
-
Presets: Pre-configured dashboards with settings for common use cases.
Issue Resolution
When issues occur, ConvivaVSI features enable quick issue resolution with real-time metric monitoring, automatic insights and alerts, along with SPI dimension comparison and custom drill-downs across any dimension combination:
Real-Time Monitoring
Use the Real-Time dashboard for live event performance monitoring and stream data analysis with customized threshold-crossing settings. Common used in Network Operation Centers and other large-scale performance monitoring.
Also, use Trends metric widgets and dimension tables for real-time monitoring of metric performance. For more details, see Trends dashboard.
Conviva's Real-Time dashboard visually presents actionable streaming intelligence by displaying real-time QoE metrics. It allows you to monitor your key streaming KPIs effectively, using visual threshold indicators to detect and correlate changes in metrics promptly.
The dashboard offers customization with up to 20 filters and 200 monitored dimension values, enabling you to focus on critical performance areas, such as Live traffic for important events or All Traffic for day-to-day operations. The Real-Time dashboard has two modes: Trends mode for monitoring video streaming performance based on selected filters across dimensions and Real-Time Filters mode for monitoring video streams based on selected filters. Additionally, you can save dashboards for easy access to recurring diagnostics and monitoring.
For more details, see Real-Time dashboard
Automatic Insights
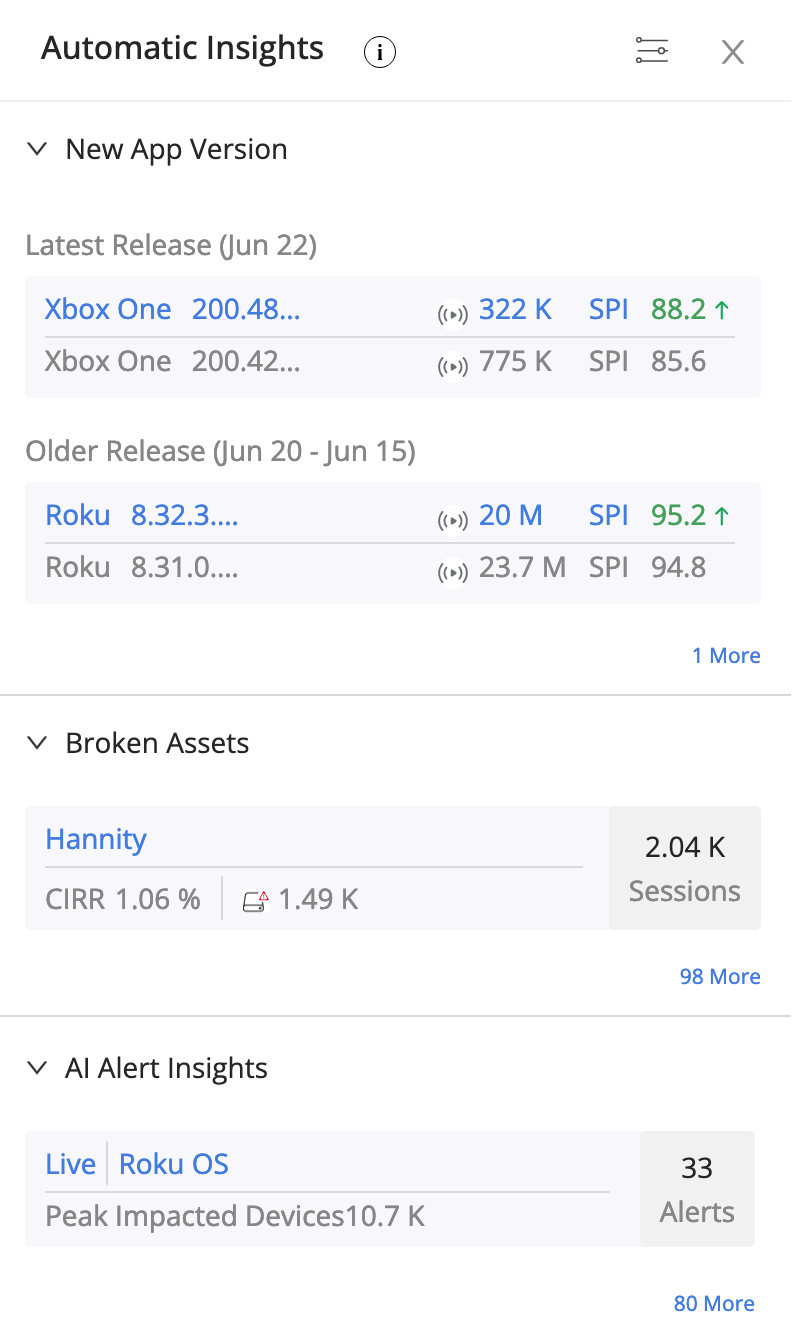
Enable automatic notifications proactively highlight areas with the most meaningful impacts throughout your video ecosystem, such as the AI alert root cause groups, app version, and broken assets, to help streamline root cause analysis and uncover hidden underlying performance issues.
Automatic Insights continuously checks performance against defined thresholds to flag AI alert root cause groups and broken assets. Automatic insights compiles insights at the end of each day and updates the displayed insights.
For more information on automatic insights on new app version, broken assets, AI Alert Insights and it's settings, see Automatic Insights.
Streaming Performance Index (SPI)
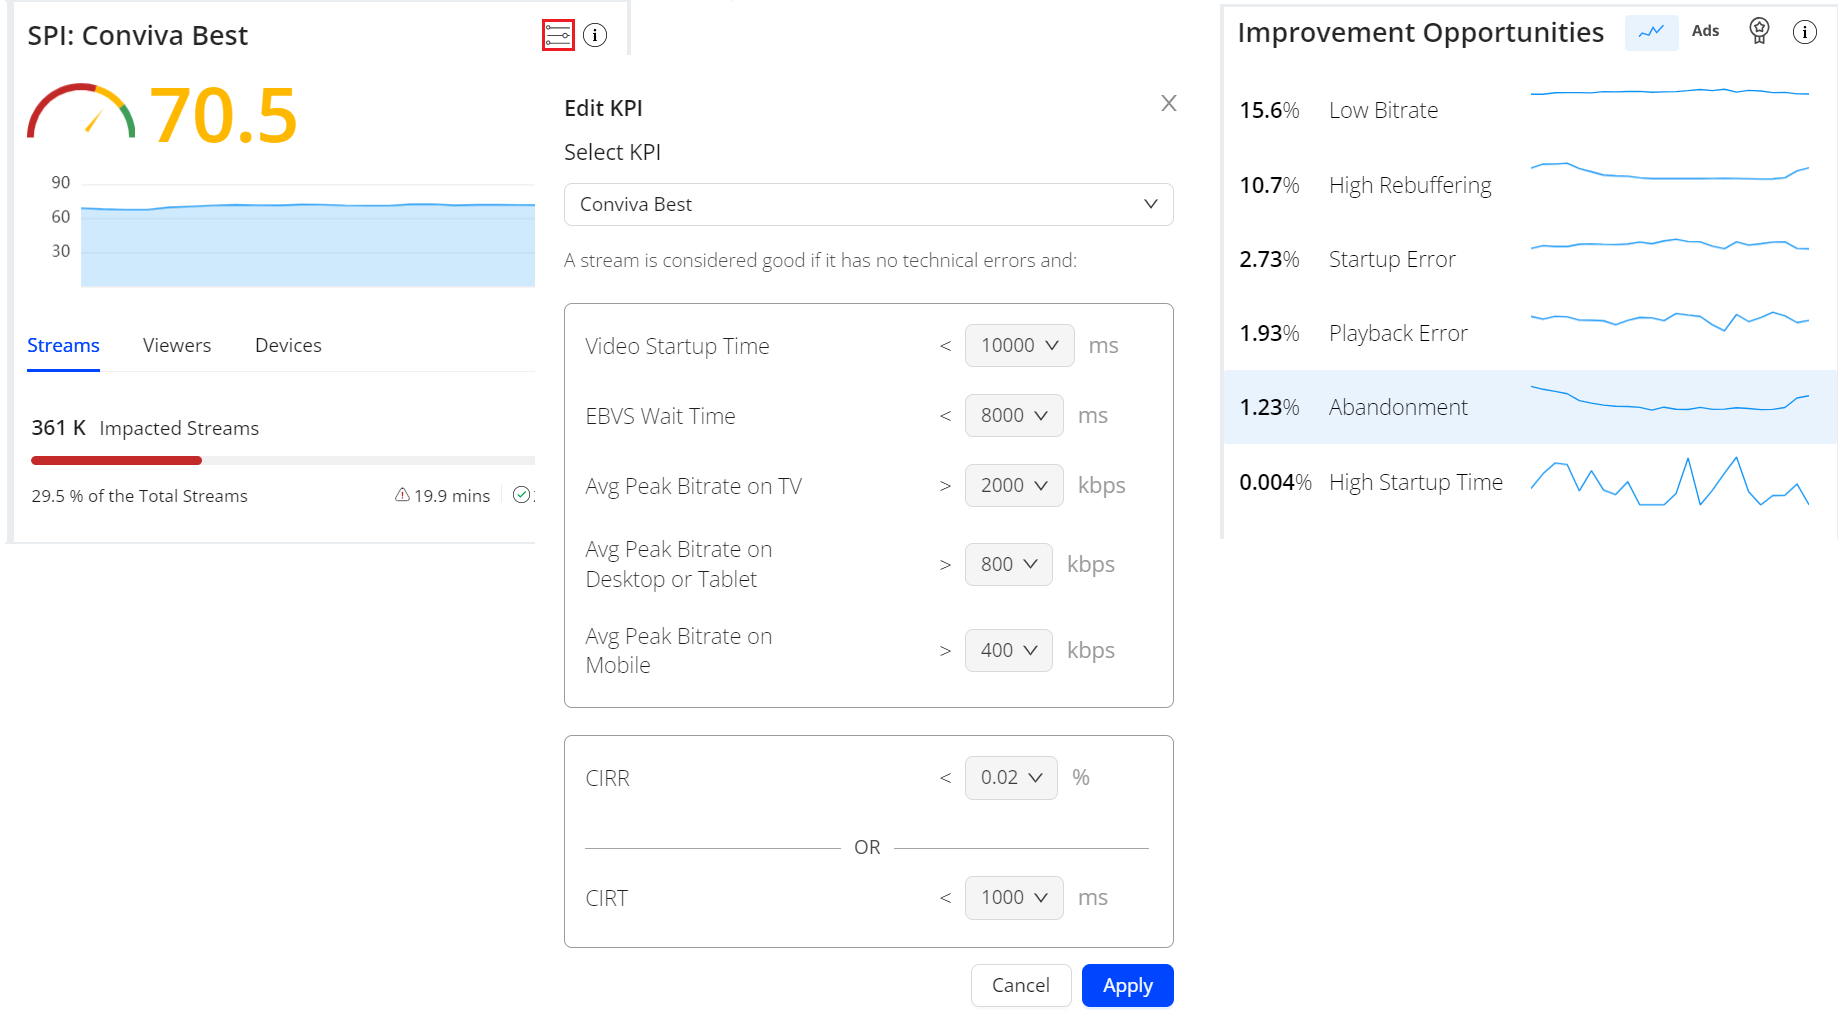
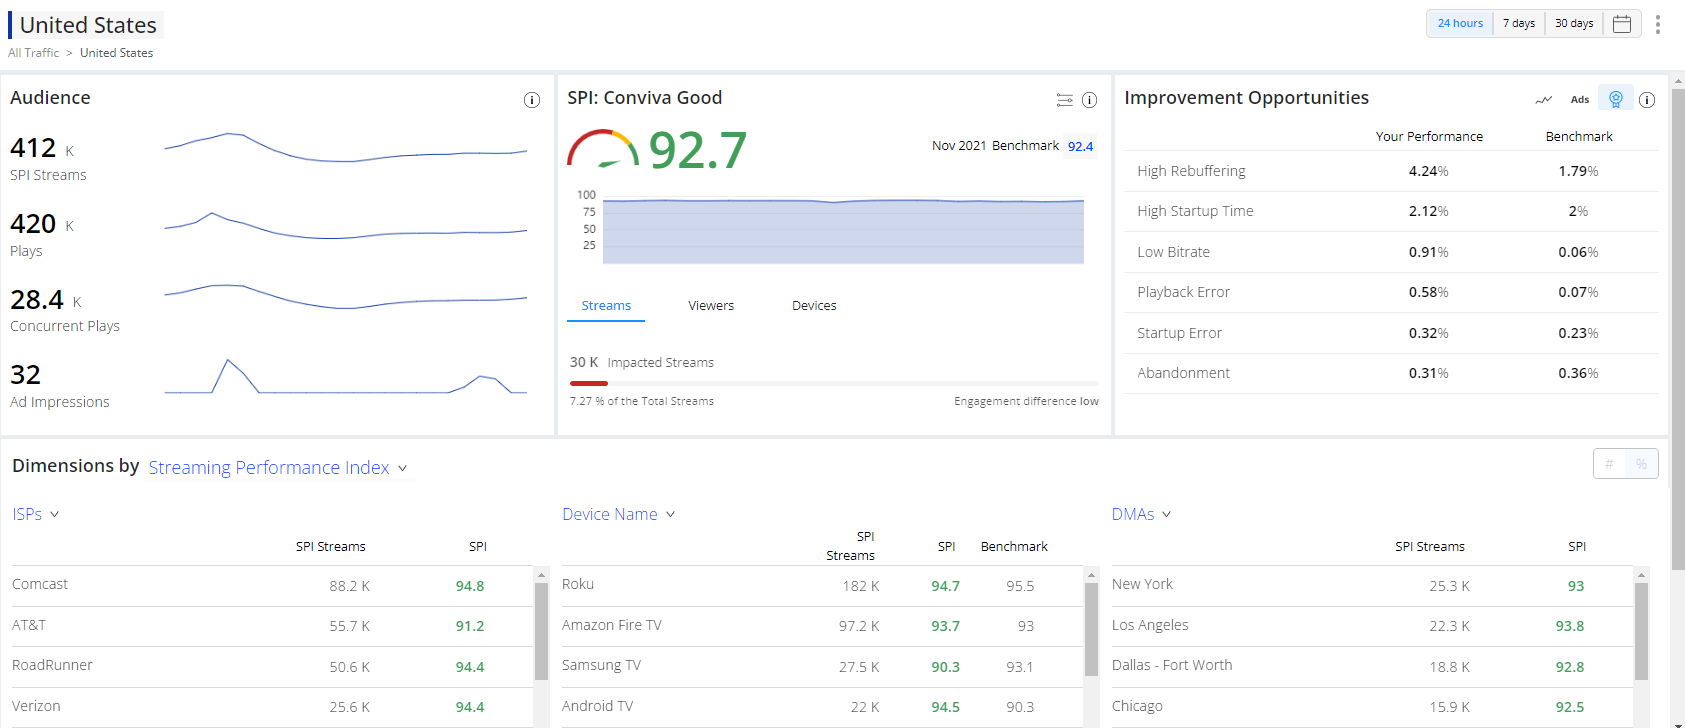
Use the SPI to visualize your performance KPIs and quickly identify under-performing dimensions related to issues impacting streaming quality. SPI allows you to assess the number and percentage of streams affected and then quickly drill-down to identify the root cause. Settings for KPI stream performance data are the in Overview page and shown as Improvement Opportunities and in Trends.
For more information on streaming performance index, KPIs, good Streams, impacted streams, see Streaming Performance Index.
AI Alerts
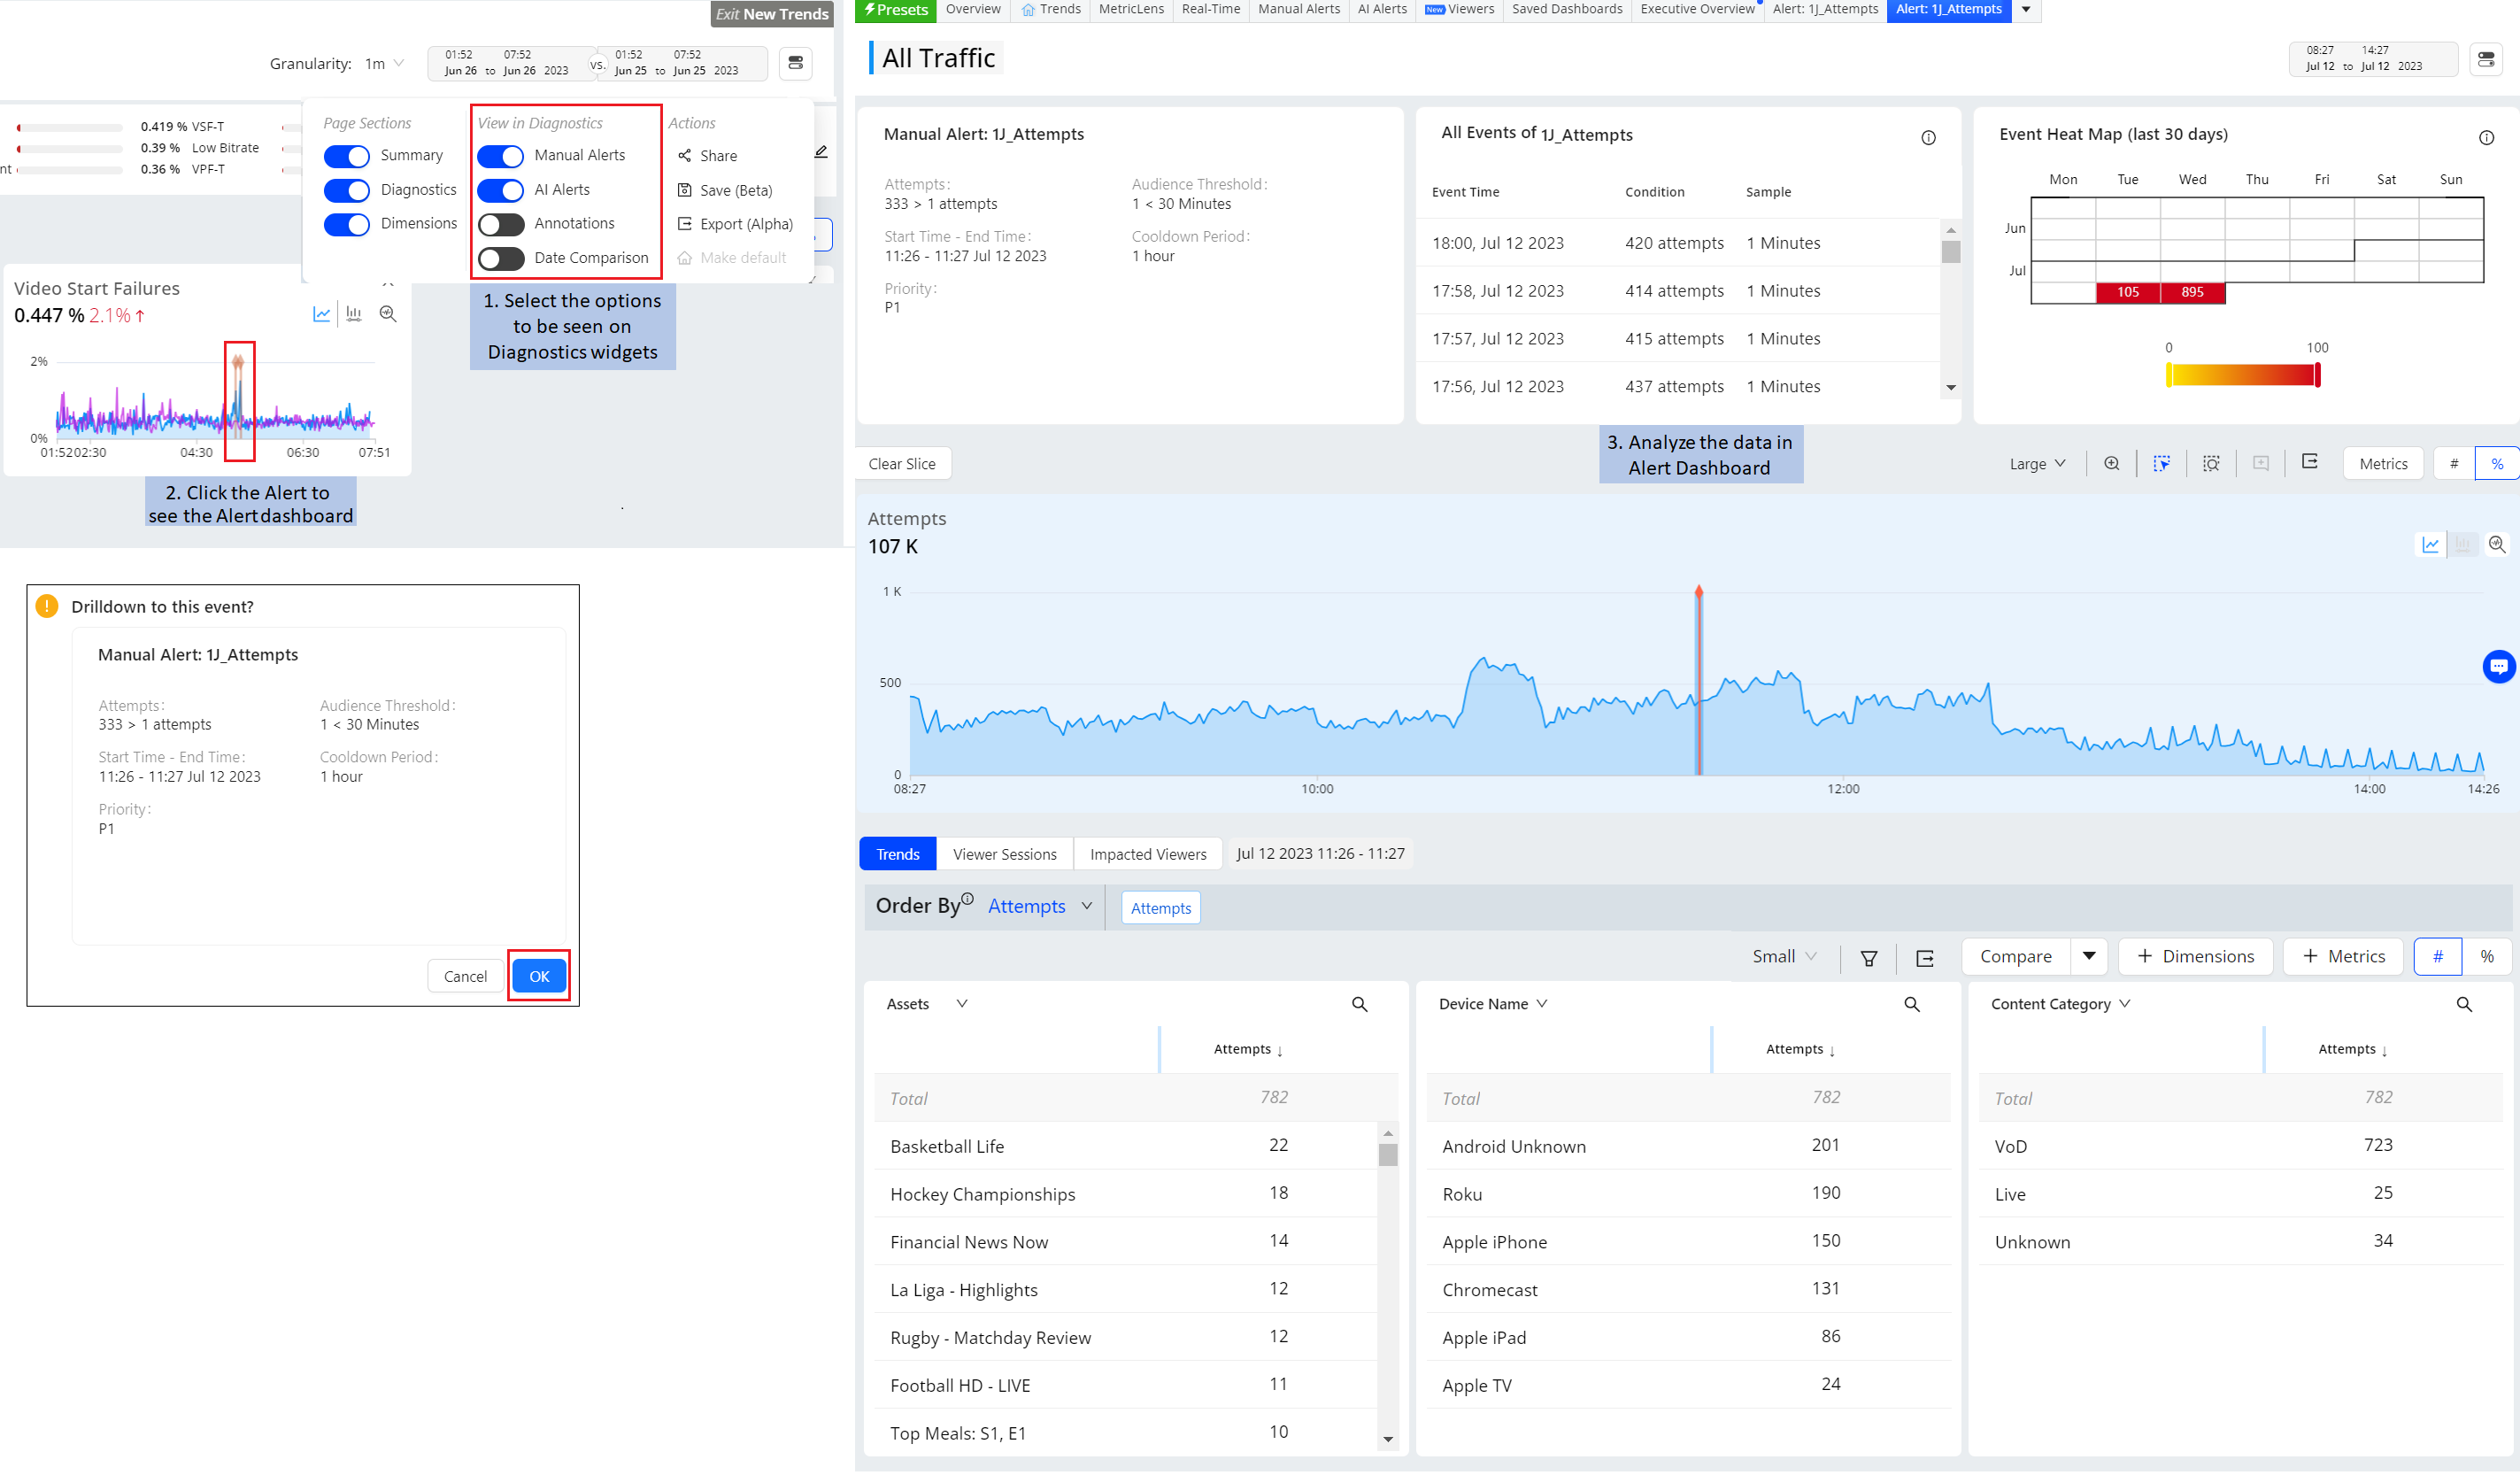
AI Alerts provide proactive anomaly detection and alerting based on configured persistence and impacted unique device settings. AI alerts automatically alert with the identified root cause dimensional groups to shorten time to resolution when anomalies exceed the expected baseline performance. AI alerts also support the use of customized dimension cohort combinations selected from a list of all scanned dimension values. For more information, see AI Alerts Custom Dimensions.
For each generated alert, the system provides the sessions that attributed to the dimensions (or set of dimensions) associated with the root cause of the alerts and the views that were impacted due to the alert, assigning an alert severity (Info, Warning, Critical) that can help you determine the impact of alert condition.
For more details, see AI Alerts.
Dimensional Drill-Downs
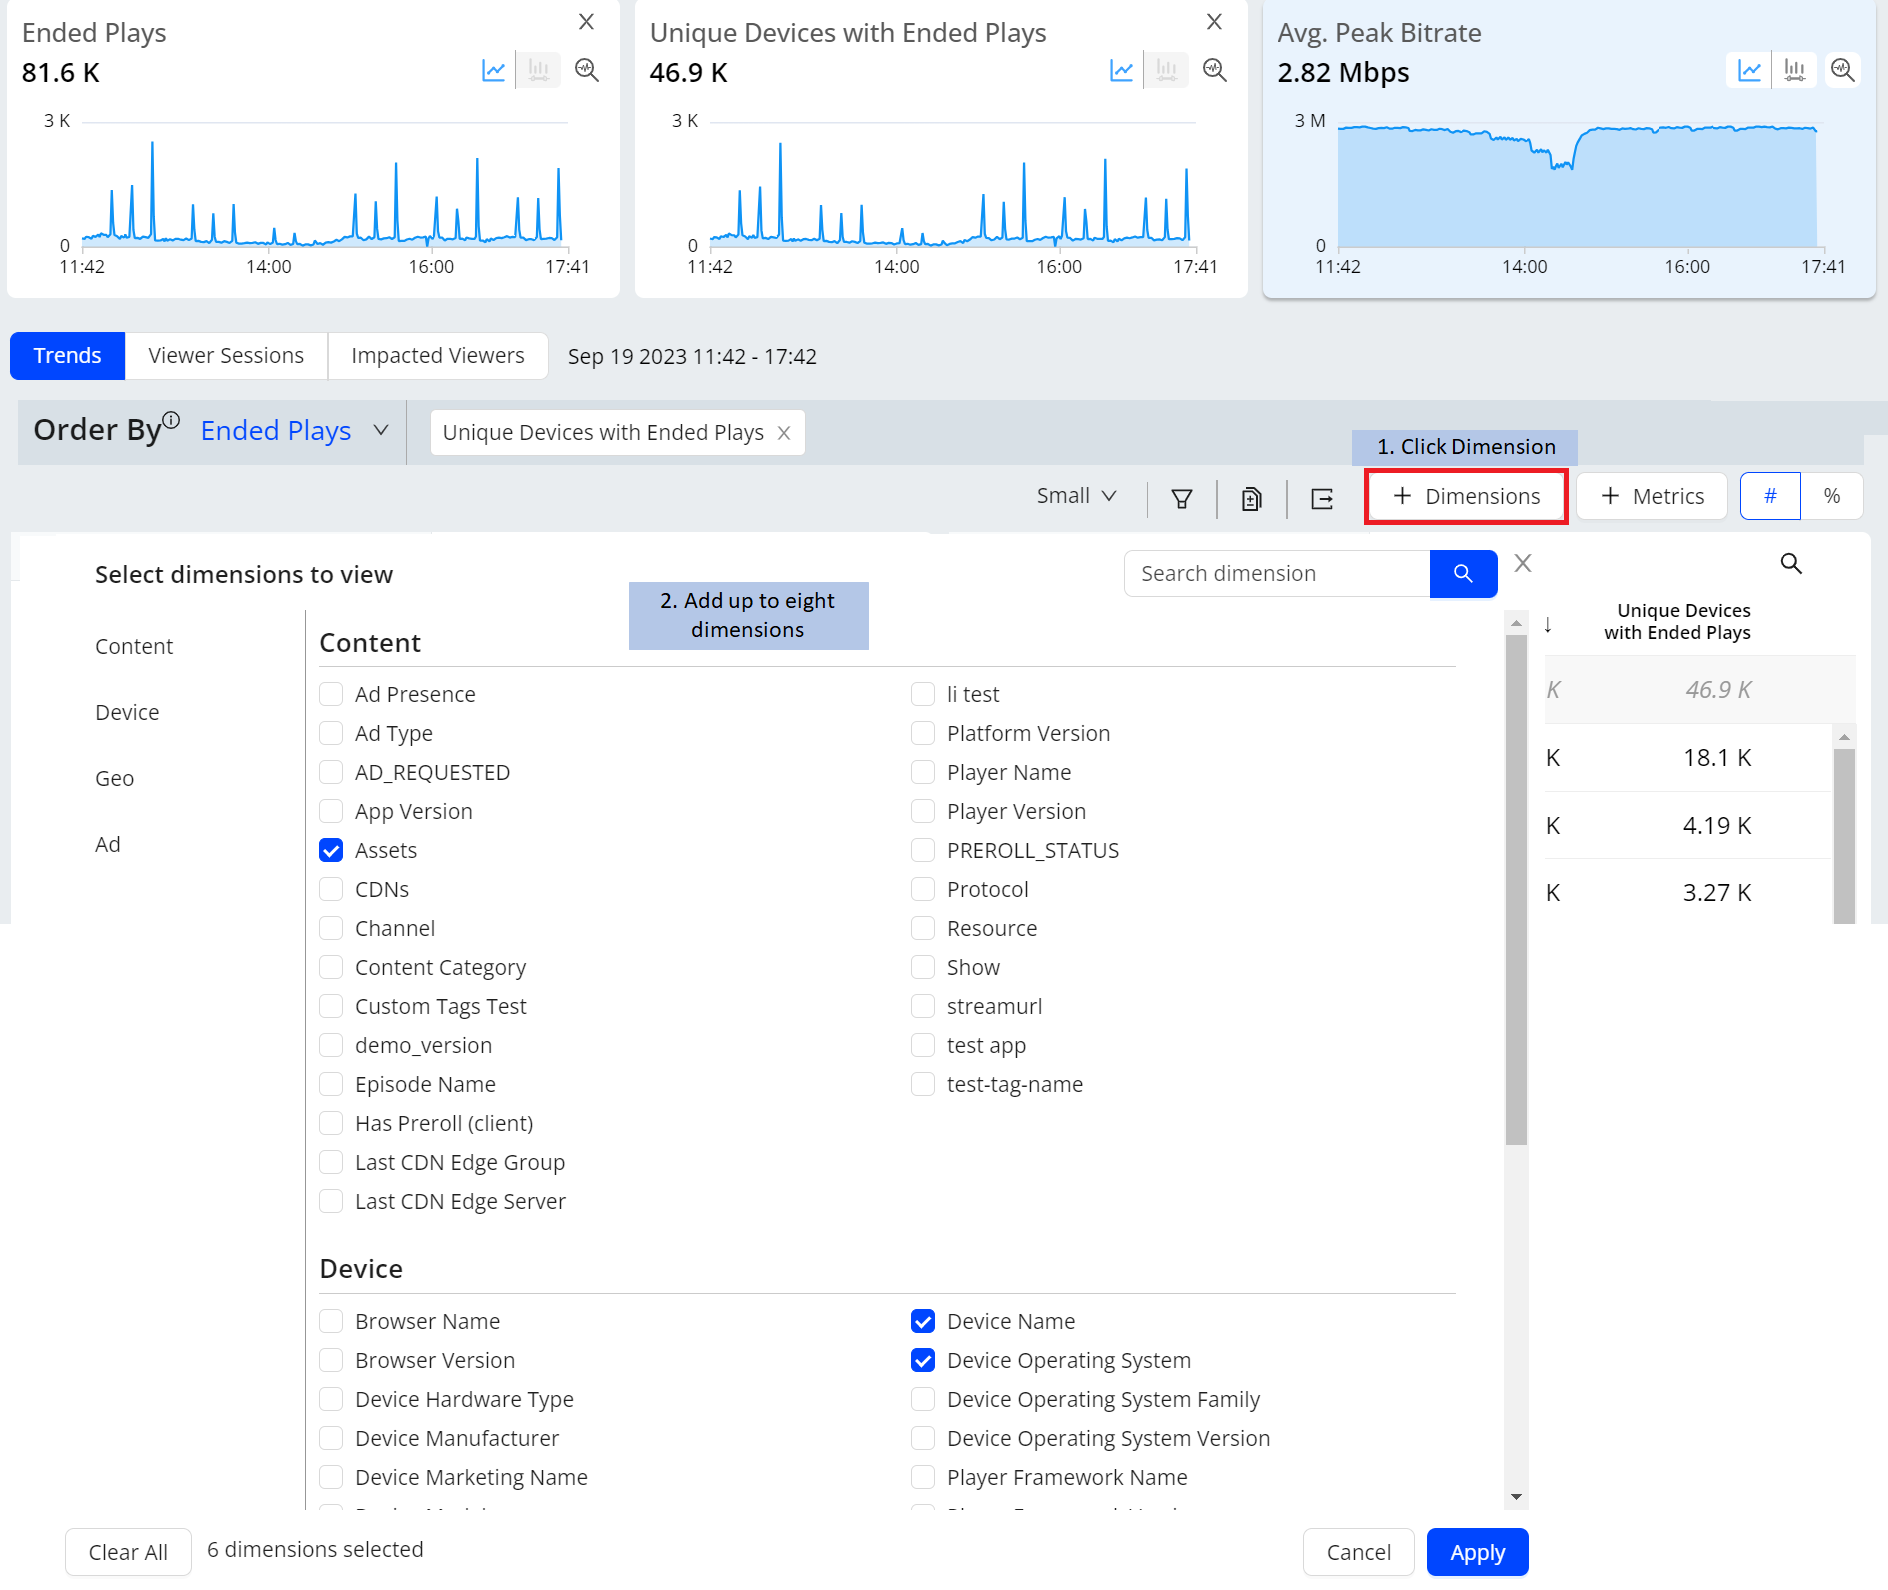
Use dimensional drill-downs in Trends and Overview dashboards to apply instant filters for cross-dimensional root cause analysis, for example startup error codes by location and device type.
Additional secondary filters can be applied in Trends to further identify the root cause by a combination of metric settings, such as high bitrates and high rebuffering. When a secondary filter is applied, the Unique Devices companion metric also displays the devices impacted.
-
Up to eight dimension tables
-
Impacted viewer sessions
-
Impacted viewers
For more details, see Trends and Diagnostics.
Compare
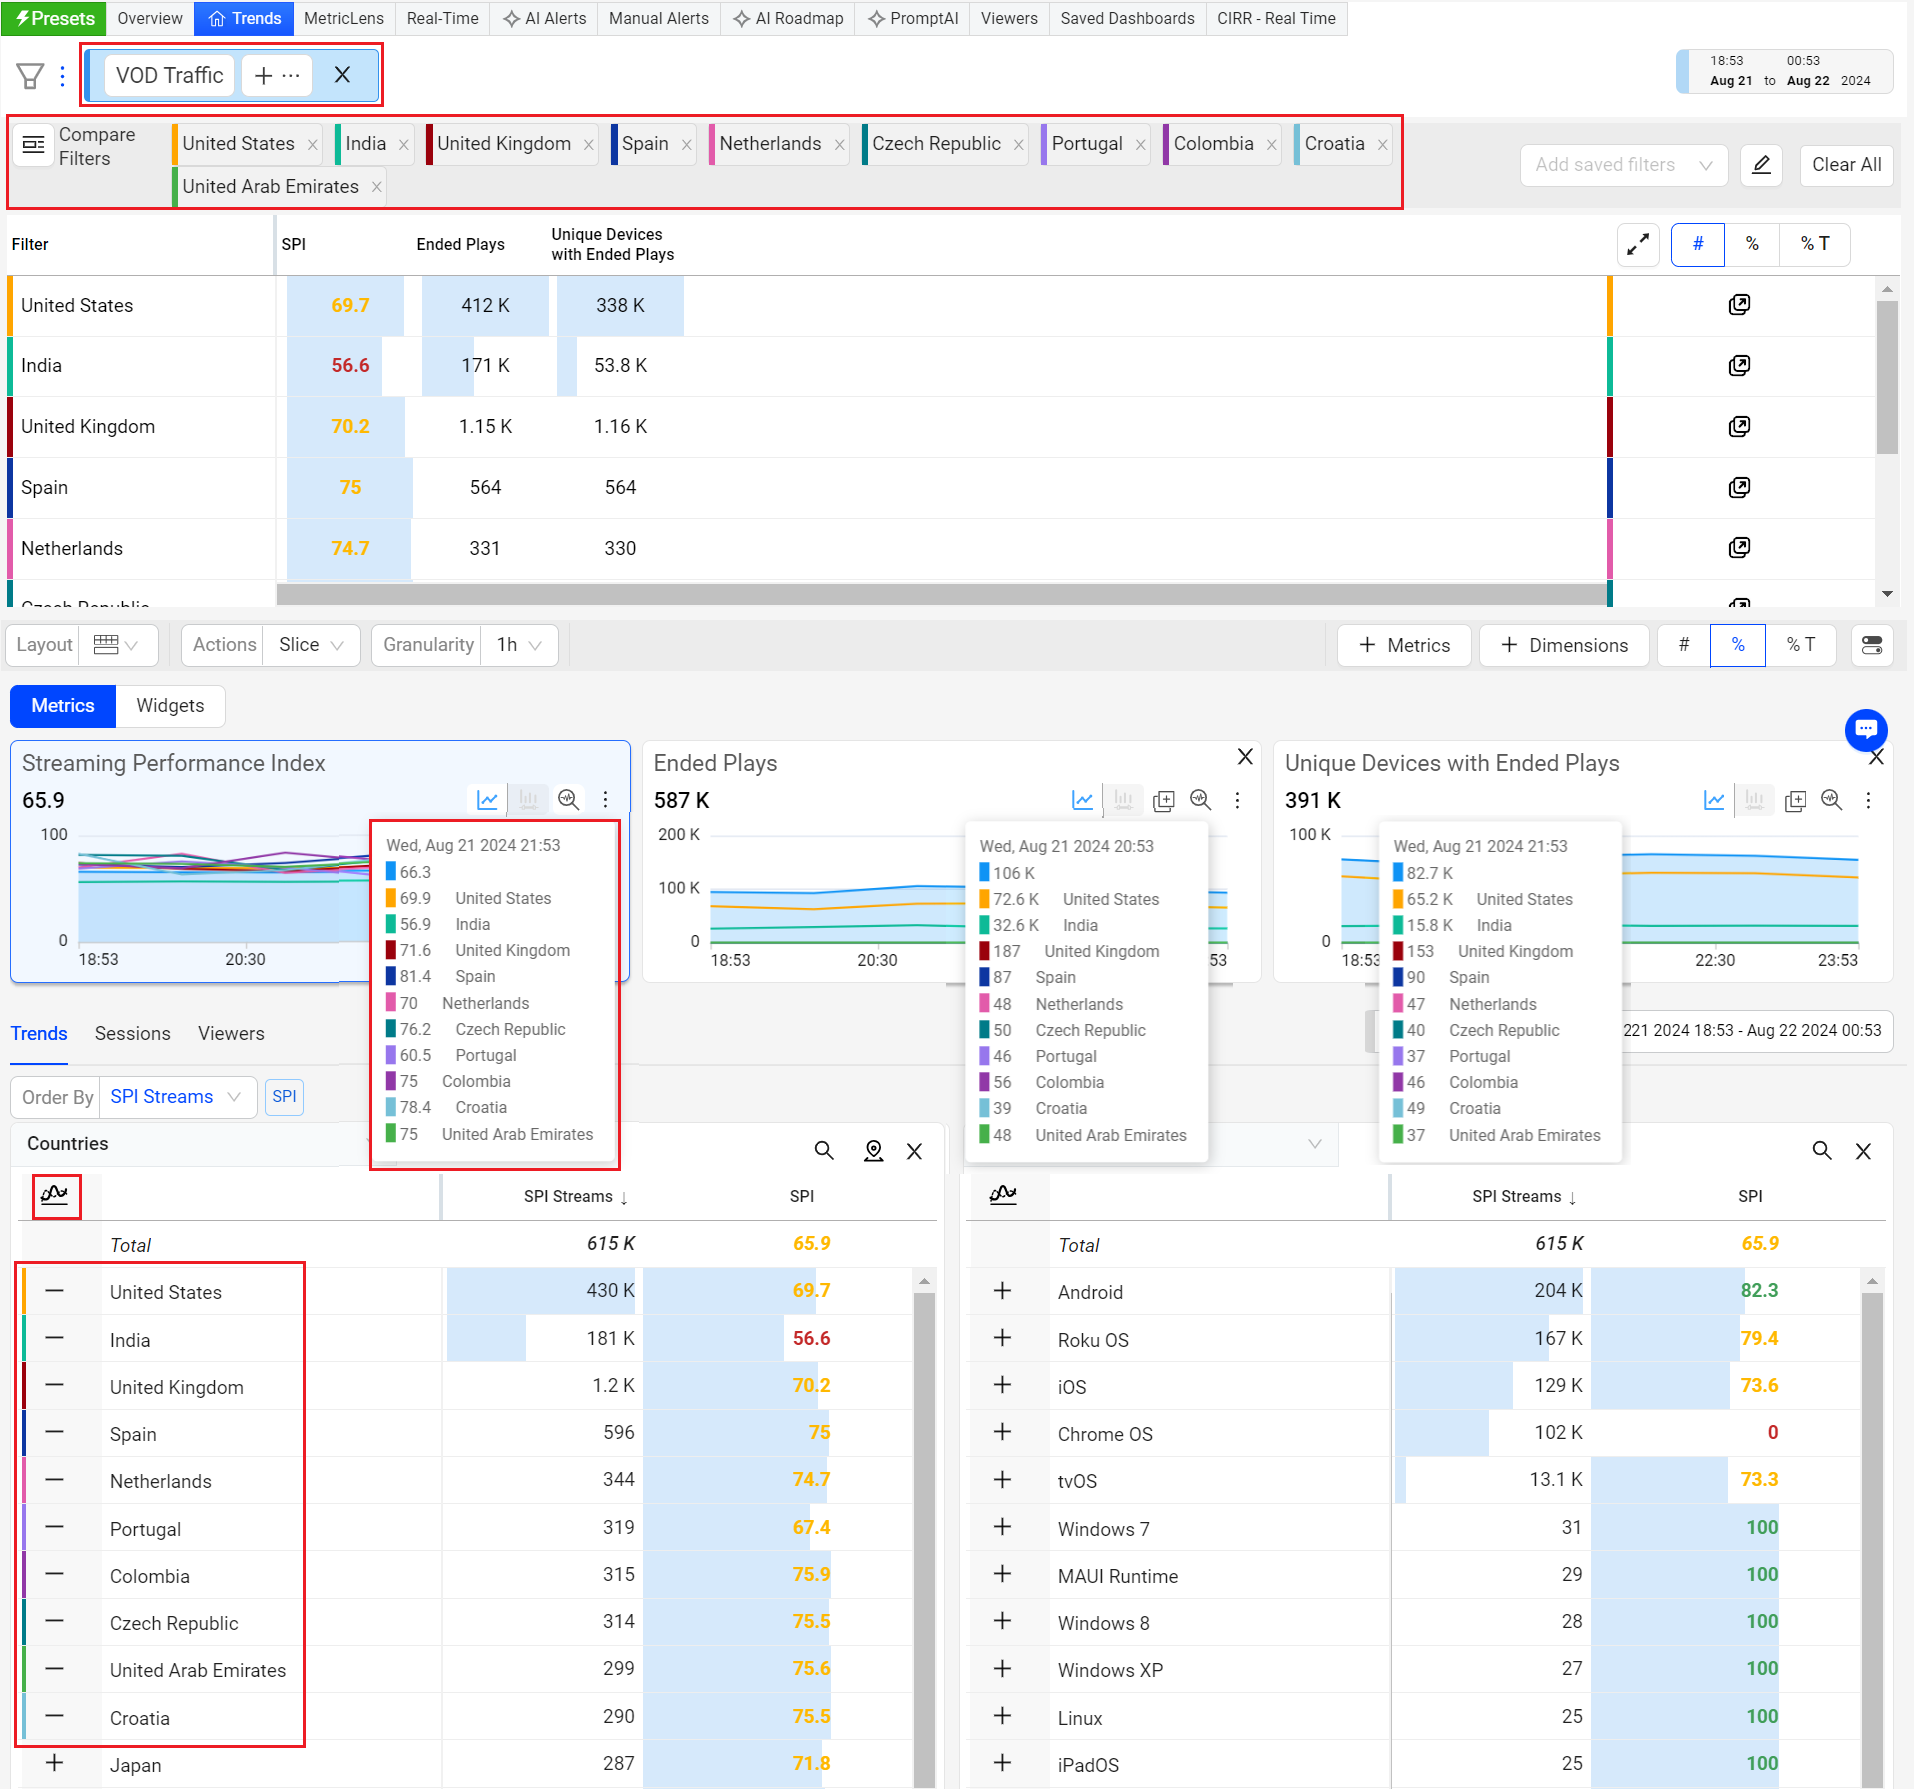
The Trends dashboard provides an instant comparison in addition to the Compare dashboard. You can use the Trends dashboard to quickly compare the filters for the top dimension entities or the custom lists of dimension filters.
-
Click the Compare Top Filters icon within a dimension table for instant compare.
-
Click the Compare button to build the custom compare filters easily.
-
Select the checkbox to create a logical AND/OR compare filter combinations
-
Select '+' to create a custom individual compare filters
-
Note: Compare in Trends is limited to twenty filters for dimension entities plus the main filter (by default, All Traffic).
For more information on Compare Integrated in Trends, see Compare.
Dimension Table Compare
Dimension Table Compare displays comparitive percentage values in the dimension tables so you can directly identify which dimension values contributed most to the spike or drop (in percentage) within the table. This feature also displays the shaded comparitive area in the metric widget time series, to help clarify the scope of the impacts. Hovering over the percentage value displays the absolute value of the shaded area. With this feature, you can efficiently analyze the data, and detect any anomalies to provide a better user experience.
You can also save, share, and export the table-compare data.
This feature offers two distinct modes, Date-on-Date (DoD) Compare Mode and Slice Mode, each designed to cater to different user needs and scenarios.
Note: Turning the Date Comparison feature toggles off any secondary feature settings. The Dimension Table Compare feature is not supported for Live mode.
For more information on Dimension Table compare details, see Table Compare.
Metrics and Dimension Metrics
Metrics
To add the metrics to the Metric widgets and the dimension table,
-
Click the Metrics button in the action bar, to see the metrics slider.

-
Select the metrics from the metric slider and click Apply.
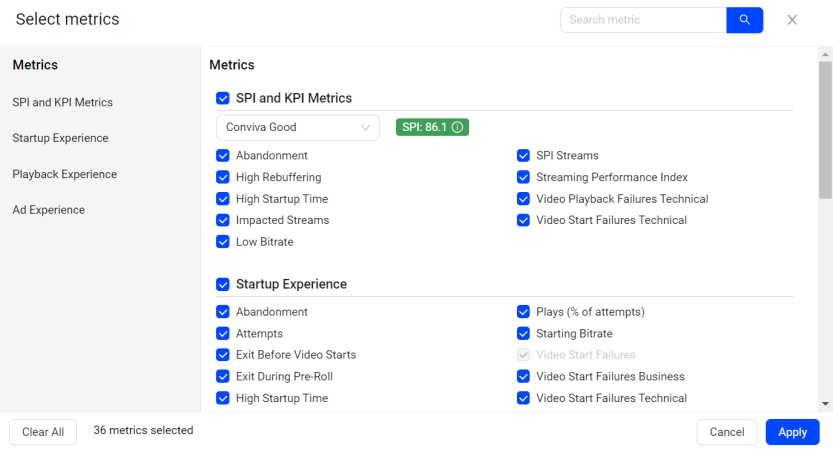
The selected metrics appears in the metric cards and the dimension table.
Dimension Metrics
To add the metrics to only the dimension table,
-
Click the drop-down next to Metrics button and click Dimension Metrics, to see the metrics slider.

-
Select the metrics from the metric slider and click Apply.

The selected metrics appears as a new column in the dimension table.
Continuous Improvement
In ConvivaVSI, quick access to past metric time series and dimension performance ensures access to quality of experience and viewer activities for targeted data analysis and issue pattern recognition.
Dimensional Drill-Downs Across Metrics, Impacted Sessions, and Impacted Viewers
Dimensional Drill-Downs Across Metrics
Use dimensional drill-downs in Trends and Overview dashboards to apply instant filters for cross-dimensional root cause analysis, for example startup error codes by location and device type.
Additional secondary filters can be applied to further identify the root cause by a combination of metric settings, such as high bitrates and high rebuffering.
-
Up to eight dimension tables
-
Impacted viewer sessions
-
Impacted viewers
For more details, see Trends and Diagnostics.
Impacted Sessions
When examining supported metrics, VSI helps you discover the most critical causes of viewer issues and session failures. It offers a high-level time series for metric progressions and the option to perform minute-level analysis on affected viewer sessions. This helps analyze metric performance across sessions in the current interval and for specific time periods with spikes and anomalies and gain detailed insights into up to 1,500 affected viewer sessions during spikes and anomalies in the last 30 days, all within a three-hour interval.
For more information on the session details, see Viewer Sessions.
Impacted Viewers
The Impacted viewers tab provides the anomalies of the viewer session for the data as per the added metric filters.
You can export the displayed data using the export option in the action bar.
Note: c3.[accountname] is mentioned in the exported file.
Secondary filters
Overlayed on top of the main filter, secondary filters apply an additional layer of analysis from the distribution views in the metric widgets. For example, with the main filter set to display only Roku traffic, the secondary or metric filter can be applied to further filter the Roku traffic by a specific metric, such as only Roku traffic with CIRR above 3%. In another example, apply filters to analyze Roku sessions with both high startup time and high CIRR.
-
Main Filter: Roku
-
Secondary Filters: VST 1000ms-3.5s, CIRR > 3%
For more information on secondary filters, see Filtering.
Saved Dashboard
ConvivaVSI allows you to save dashboards to preserve the current settings and data of most dashboards for easily access and re-use. The Saved Dashboards option displays the saved, public, and custom dashboards.
For information on the saved, public and custom dashboard details, see Saved Dashboards.
Benchmarks
For comparison with industry peers, benchmarks are based on Conviva’s OTT streaming intelligence and industry-leading video streaming coverage across publishers. The benchmark is defined as the 95th percentile (for example, 5th best publisher out of 100) and determined for each country.
For more information on benchmarks, see Benchmarks.
SPI
Use the SPI to visualize your KPI performance for the selected period, based on the number and percentage of impacted streams. Impacted streams failed to meet one or more KPI settings. Improvement Opportunities highlight your specific KPI stream performance issues.
SPI Streams encompass all streaming sessions monitored by Conviva that contribute to the SPI calculation. Sessions that exit before video playback when viewers don't wait a significant time and sessions affected by business logic errors are excluded from the SPI calculation. The Streaming Performance Index and SPI Streams are metrics in Trends and other dashboards.
For more information on streaming performance index, KPIs, good Streams, impacted streams, see Streaming Performance Index
MetricLens
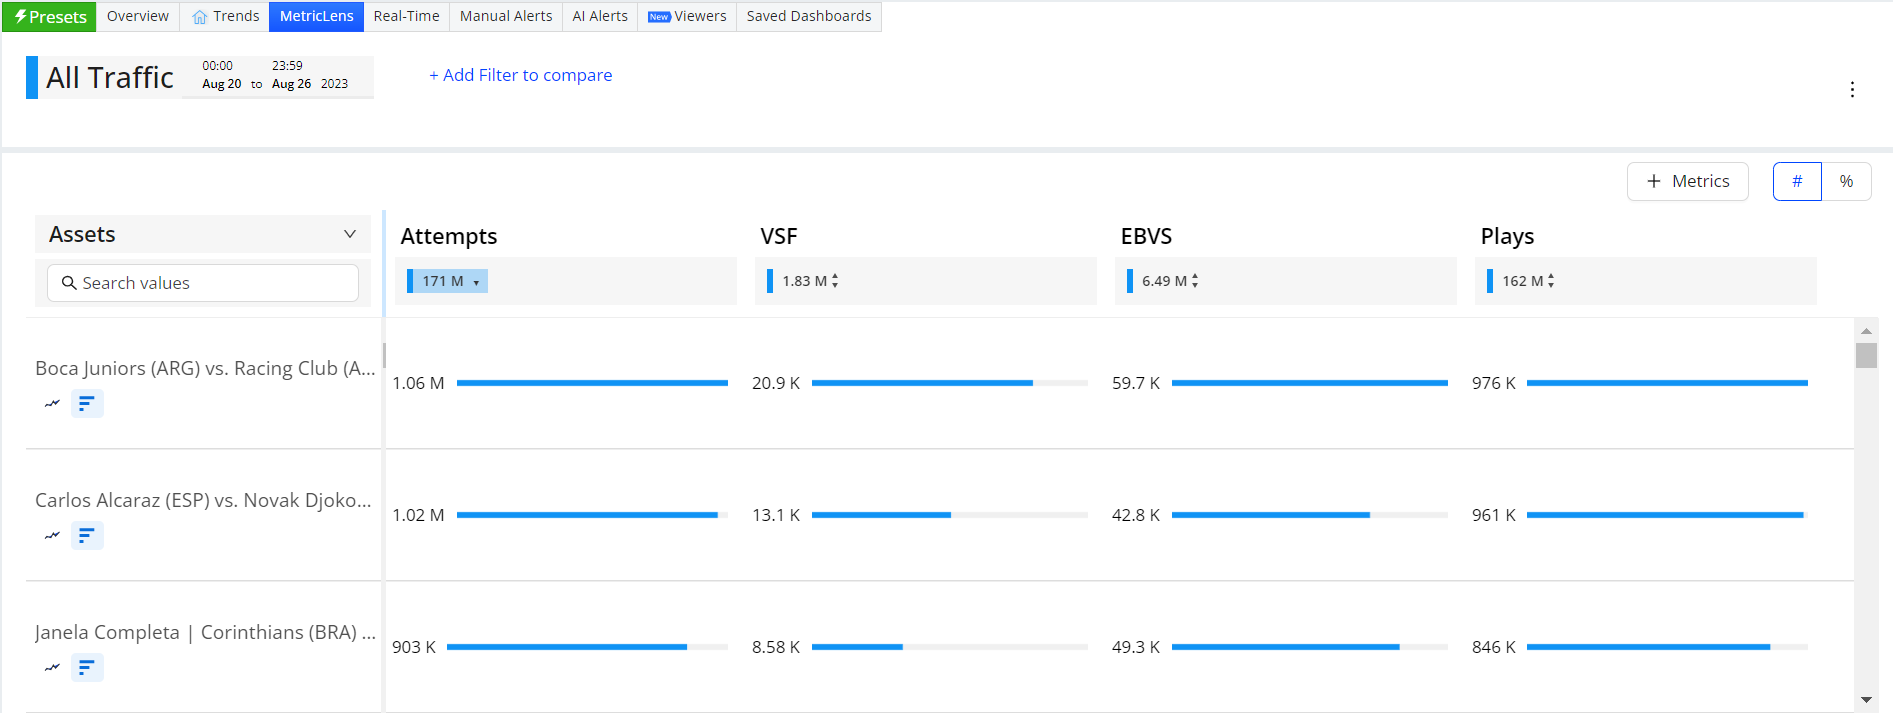
The MetricLens dashboard enables an alternative way to analyze quality and audience metrics seamlessly with metric comparison bars and time series data at one-hour intervals. You can further tailor your analysis by applying up to three filters, allowing for precise monitoring of your key streaming KPIs and efficient comparisons across of performance metrics. Additionally, you can expand the time series view up to 10 increments with a simple click.
For information on using the metric lens dashboard, see MetricLens.
Overview
The Experience Overview highlights your streaming activity and overall performance to swiftly view audience activity, check your Conviva SPI, and conduct a dimensional analysis of key performance areas for improvement, including evaluating performance across sessions with and without ads and comparing your performance to Conviva cohort benchmarks.
Also, you can customize the SPI KPI values for more detailed performance analysis and specific improvement opportunities, such as zero CIRR, minimal rebuffering, and elevated average bitrate levels. This enables tailored analysis of your streaming activity and performance.
For more information, see Experience Overview.
AI Alerts
AI Alerts provide proactive anomaly detection and alerting based on configured persistence and impacted unique device settings. AI alerts automatically alert with the identified root cause dimensional groups to shorten time to resolution when anomalies exceed the expected baseline performance.
For each generated alert, the system provides the sessions that attributed to the dimensions (or set of dimensions) associated with the root cause of the alerts and the views that were impacted due to the alert, assigning an alert severity (Info, Warning, Critical) that can help you determine the impact of alert condition.
For more details, see AI Alerts.
Viewer Session
When examining supported metrics, ConvivaVSI helps you discover the most critical causes of viewing issues and session failures with a second-level time line of the stream states, events, and metric progressions. These data and session timelines help analyze what happened during the impacted sessions based on up to 1,500 affected viewer sessions during the last 30 days, all within a 24-hour interval.
For more information on the session details, see Viewer Sessions.
Impacted Viewers
The Impacted viewers tab shows the viewers selected from the current filter and the metric filter settings. For detailed viewer analysis, clicking a viewer link opens the Viewers data for that viewer.
You can export the impacted viewer data using the export option in the action bar.
Note: c3.[accountname] is mentioned in the exported file.
Notification Channels
Webhooks
Webhooks enable automated notifications to external systems when a manual or AI alert fires within Conviva. Webhooks push alert information via HTTP POST requests to a destination webhook URL that is a destination endpoint on your server.
Use webhooks to integrate Conviva alert events into external applications, such as displaying Conviva alerts in an alert aggregation system or triggering workflows in other applications, such as JIRA or other support ticket applications. For more information on adding, managing, and troubleshooting webhooks, see Setting Webhook Notifications.
AI Alerts Email Subscription
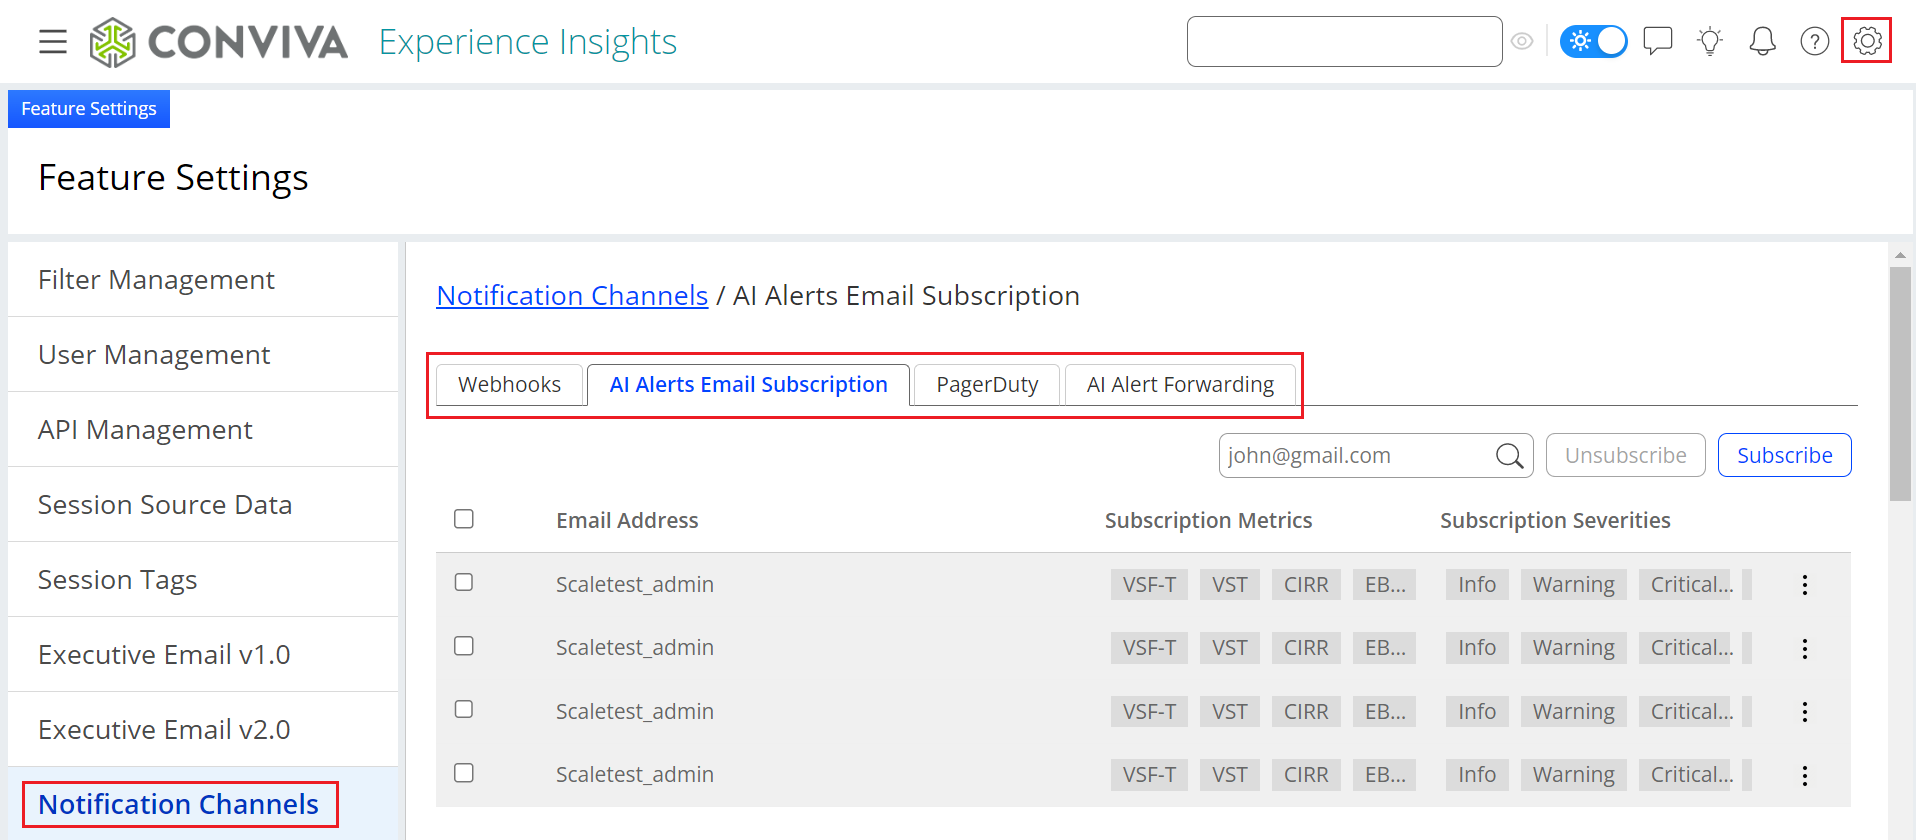
Admin users can manage user AI alert email subscriptions in the Settings > Notification Channels > AI Alerts Email Subscription page. On this page, Admins can subscribe and unsubscribe user email addresses, and set specific metric notifications by severity level for each user. For more information on AI alert email subscriptions, see AI Alert Email Subscription.
AI Alert Forwarding
AI Alert forwarding enables you to forward select AI alerts and alert data to your CDN partners that are part of Conviva's ecosystem initiative. Once AI alert forwarding is configured and an AI alert fires, AI alerts that meet the criteria for your configured CDNs are also sent to the specified CDN c3 accounts.
You use forwarding rules to configure the target CDN and which metrics to forward. It is best practice to use only one forwarding rule for each CDN. For more information on AI Alert Forwarding, see AI Alert Forwarding.
PagerDuty
Conviva ConvivaVSI enables you to integrate manual alerts and AI alerts with PagerDuty so you can enhance Conviva's advanced video alerts with PagerDuty escalation management and notifications. You need a PagerDuty account with configured services so you integrate Conviva alerts with the configured PagerDuty services. For more information on pagerduty, see Conviva PagerDuty Integration Guide.
Note: You can also get notification through executive emails, for information on to set up regular scheduled email notifications, see Executive Email v1.0.
Executive email also provides key stakeholders with insights into overall streaming quality, comparative QoE performance, and engagement trends. Based on Conviva's industry-leading streaming intelligence, these customized emails provide visual summaries of KPIs and performance metrics to empower data-driven operational best practices and KPI-based decision making. For more information, see Executive Email with Streaming Performance Index (SPI).
Service Integrations
The Service Integrations page provides access to ConvivaVSI programmatic notifications for data services, such as BigPanda and Datadog. Service Integrations settings requires administrator access. For more information on service integration, see Service Integrations.
Viewers
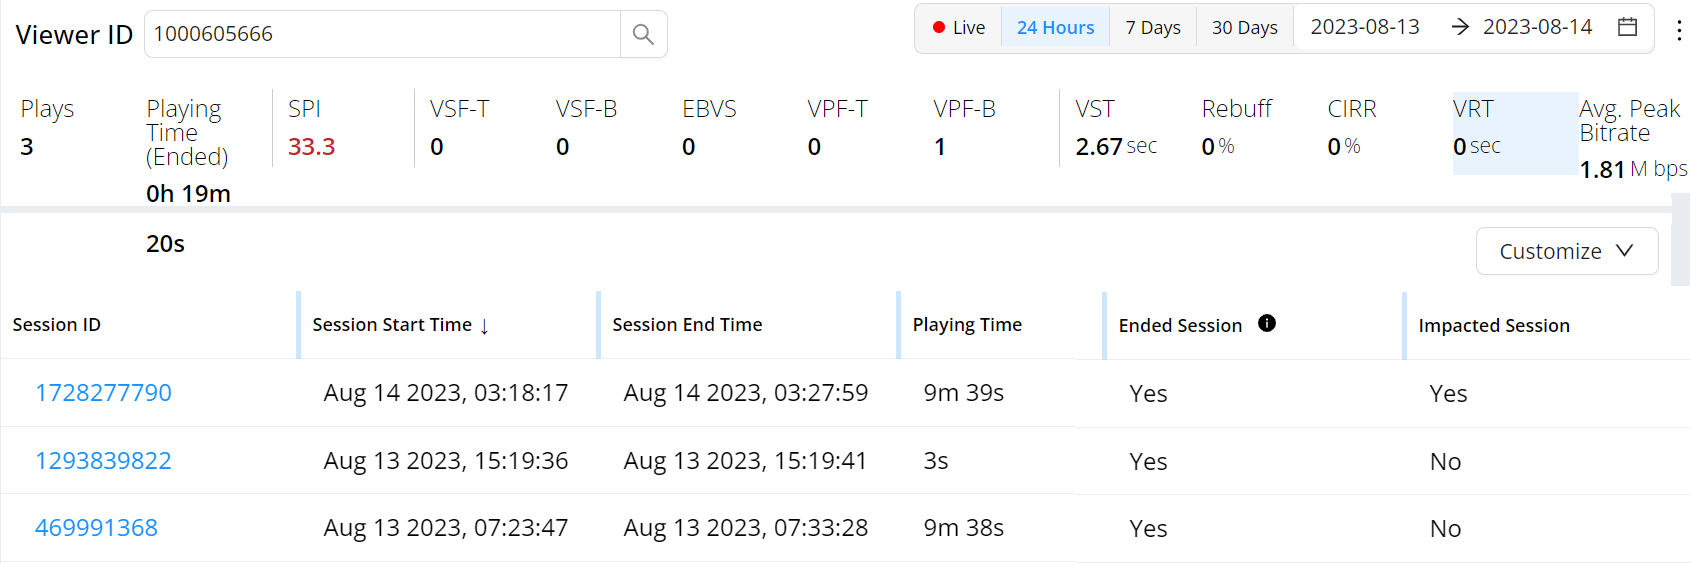
The Viewer's dashboard empowers customer care teams to swiftly exhibit viewer streaming experience details for sessions within a specific time frame. It offers concise session data and metrics to gauge a viewer's overall streaming experience, including play count, total viewing time, session SPI, startup/play issues, rebuffering, and average peak bitrates. Additionally, it allows for a deeper dive into session-specific performance metrics.
Click a viewer ID on the Diagnostics page, choose "Viewers" in the menu, and input a viewer ID for the desired time period. The summary data and metrics are at the top, followed by sessions listed chronologically based on their start times. In this instance, the viewer effectively viewed two videos on Roku and Apple iPhone devices and one EBVS event.
Note: Viewer IDs can also be obtain from the Sessions view and alert data.
For more information on viewer module, see Viewers.
Basics
ConvivaVSI provides a graphical front-end to monitor, analyze and diagnose your video stream performance and Quality of Experience. A variety of highly functional dashboards and settings allow you to focus and customize your analysis and data viewing. In most dashboards, you set the filters through which data is displayed and specify date ranges to narrow the display to spikes in metrics or performance anomalies. Select dimension values for on-demand filtering in Trends, Diagnostics, and other drill-downs.
Navigation
ConvivaVSI simplifies navigation by offering persistent tabs for features like Presets, Overview, Trends, MetricLens, Real-Time, Manual Alerts, AI Alerts, and Saved dashboards. The navigation hamburger menu also provides quick access to these features and other Conviva applications to which you have access. For more information on navigation in ConvivaVSI, see Navigation.
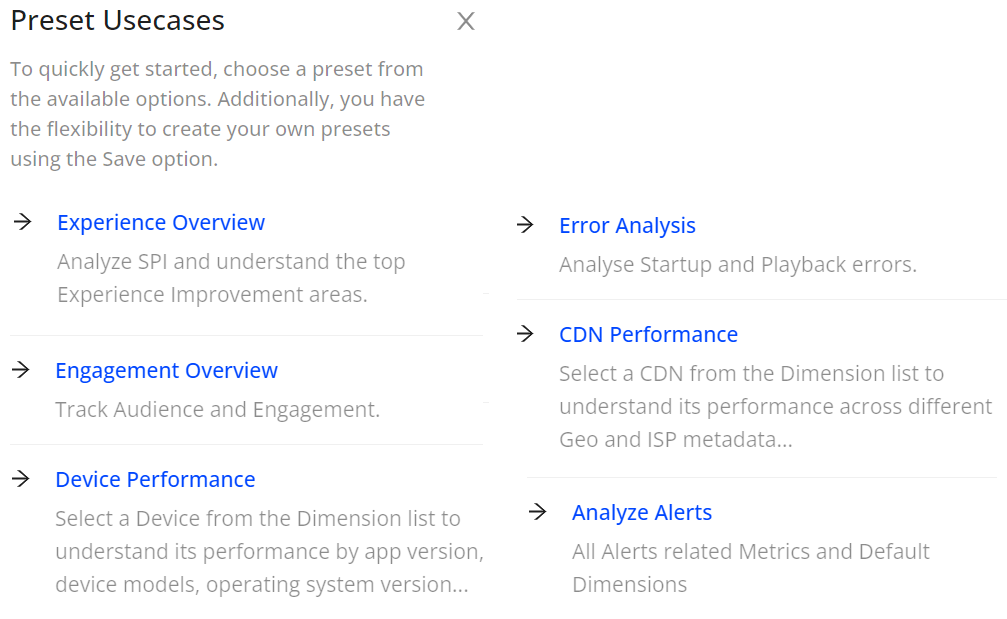
Presets
Trends offers pre-defined feature options as quick starting points to provide access to commonly used metrics and metadata use cases. Users can customize these pre-defined selections as needed and save them as private or public shared dashboards.
For more information on Presets, see Presets.
Annotations
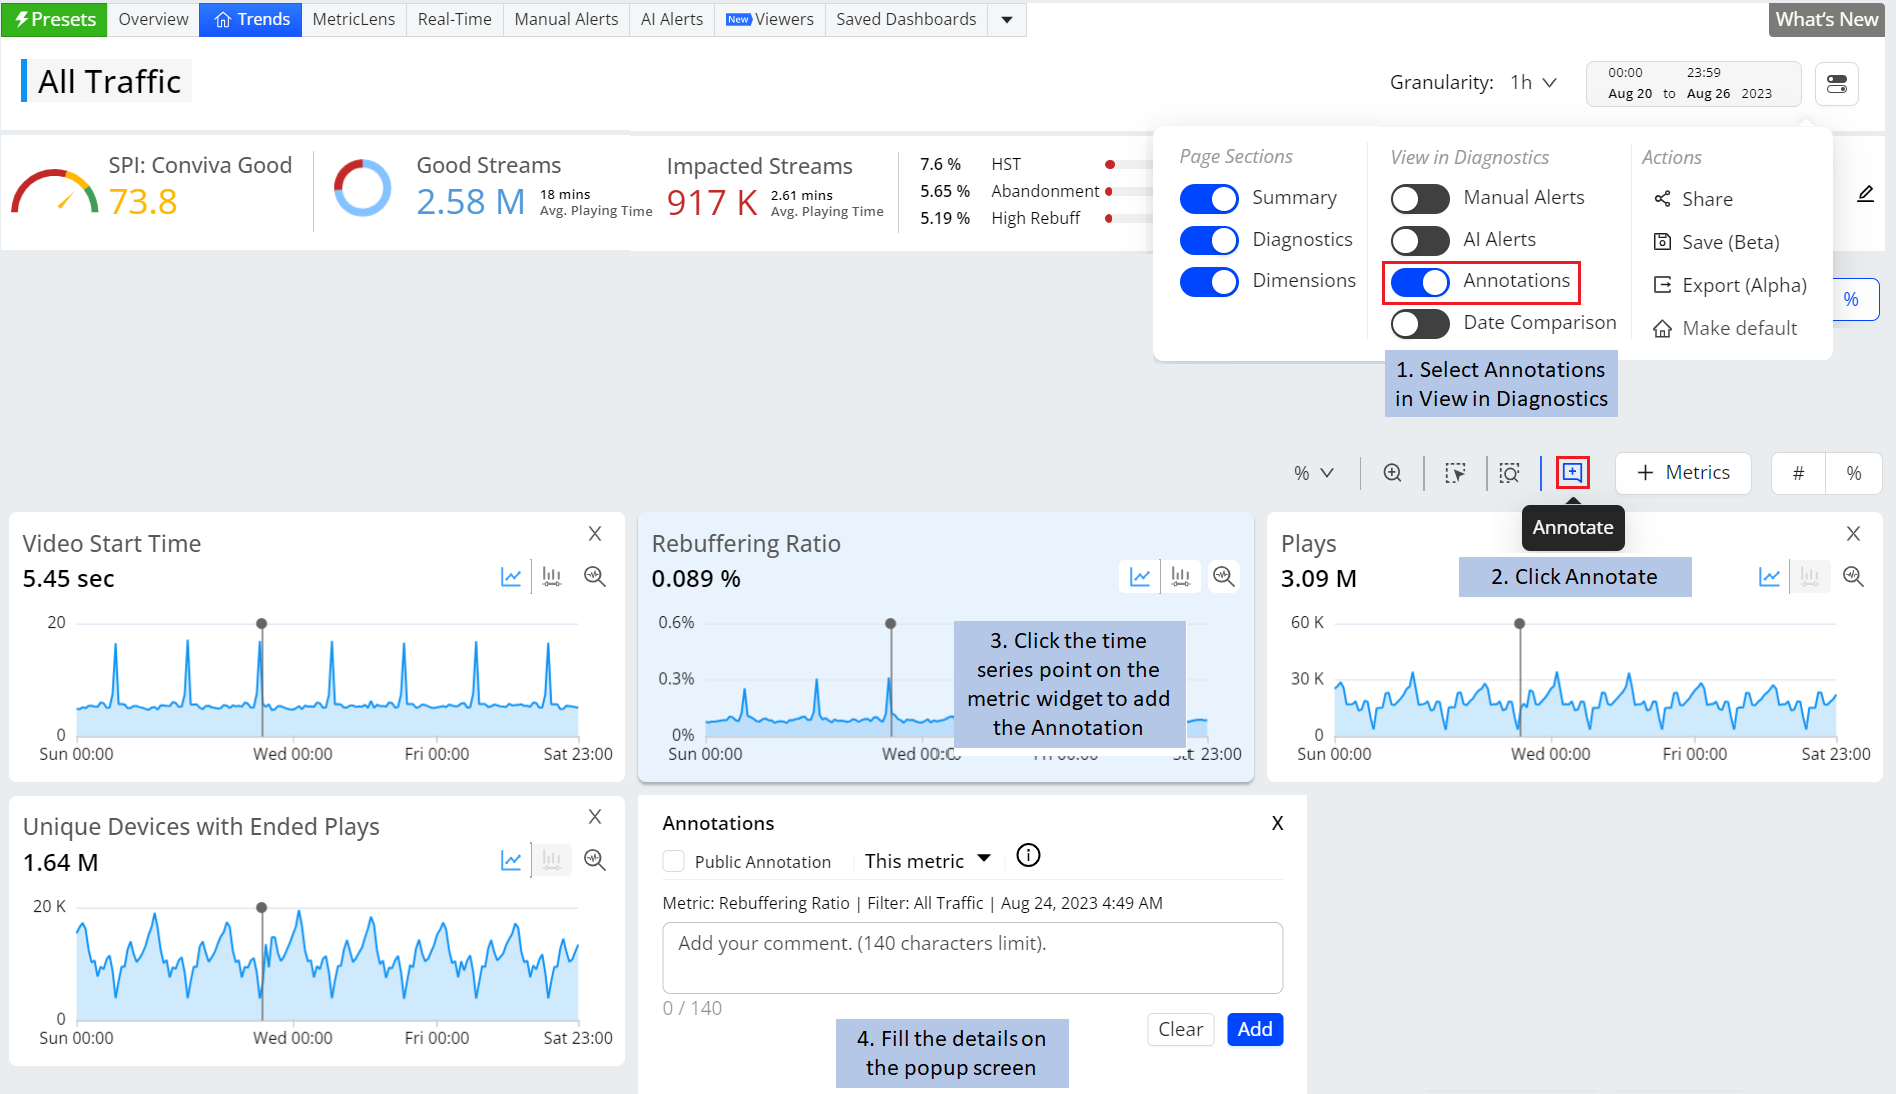
Annotations allow you to mark the anomalies in the timeseries during the data analysis within the selected time interval in Trends dashboard and Compare. Also, it enables you to add comments making it a collaboration tool.
You can add and save the annotations in the following two levels:
-
Metric: Annotation is visible for selected metric across all dashboards.
-
Dashboard: Annotation is visible for all metrics across all dashboards.
For more information, see Annotations.
Dynamic Y-Axis
Dynamic Y-Axis narrows the granularity of the y-axis range to focus more precisely on the displayed data points. Pulse calculates the maximum and minimum values, adds appropriate buffers, and determines whether to include the zero position in the y-axis. Excluding the zero position often improves the clarity and interpretation of scatter charts. For example, the y-axis range changes from 0 – 100 to 50 – 100 when data points fall only between 60 and 100.
Image: Dynamic Y-axis displays more focused axis points

For more information on Dynamic Y-Axis, see Dynamic Y-Axis.
Time Granularity
The Trends page, including Diagnostics and Compare, supports enhanced granularity levels, such as:
-
1 min, 5 min, 15 min, and 30 mins for 1-hour intervals
-
1 hour, 6 hours, 12 hours, 1 day, and 7 days for 30-day intervals
For more information, see Time Granularity.
Share, Save, Export and Clone
Share
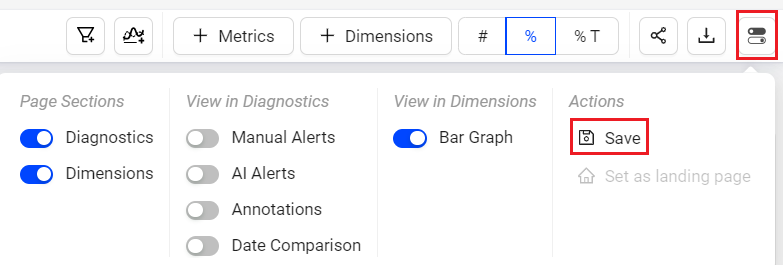
You can share snapshots of dashboards and widgets with other VSI users by clicking Share in the toggle menu. Sharing is supported in Trends, Overview, MetricLens, Real-Time, Compare, and Viewers dashboards.
When you click on the Share button, VSI saves a snapshot of the item for the last 30 days and produces a link that you can share by email, by Slack message, or by pasting it into another document.
When a user opens the link and logs in to ConvivaVSI, they see an exact copy of the item you sent. They can change how VSI presents the data in the snapshot, but cannot change which data are part of the snapshot. For example, the user can deselect metrics to hide them, but they can't change the dimension or time series.
Save
Saving shared dashboards is supported in Overview, Trends, MetricLens, Real-Time, Compare, and Viewers dashboards. Save the dashboard for re-use and collaboration with the other users who have access to the account.
Note: Only shared Overview, MetricLens, and Viewers dashboards can be saved. Compare dashboards can be saved without sharing.
The saved dashboards appears in the Saved Dashboard tab.
In the Saved Dashboards tab,
-
My Dashboards displays the private saved boards, which is visible only to the owners.
You can edit the data after the dashboard has been saved.
-
Public Dashboards displays the public saved boards, which is visible to all users.
For more information on save, share and delete the public saved dashboards, see Public Saved Dashboard.
Note: The blue dot indicates that the dashboard is unsaved.
Export
Depending on your analysis needs, you might want to export the data from a dashboard or other page for use elsewhere. It's easy to do: just click Export in the kebab menu. The resulting file is a comma-separated text file that you can import into a spreadsheet or other analytical application.
Note: If the dimension table contains a blank column, the system excludes the blank columns during export.
For more details, see Export Data.
You can also use Executive Emails to share performance data with key stakeholders.
Clone Dahboard
Cloning a saved dashboard creates a copy of the dashboard, enabling customization based on the original dashboard settings, for example, expanding the date range. This feature simplifies collaboration and updates while preserving the original saved dashboard.

For more information on cloning the public saved dashboards, see Public Saved Dashboard and clone private saved dashboard, see My Dashboard.
Diagnostics
VSI provides a rich set of diagnostic features and capabilities that support optimizing all aspects of your streaming performance from real-time break fixing to on-going continuous improvements.
-
Monitor real-time streaming performance for live tent-pole events to detect and remedy anomalies before they become critical issues.
-
Receive automated proactive AI alerts to quickly react to meaningful metric deviations from a computed range of variation based on the historical mean and standard deviation data.
-
Analyze trends and improvement opportunities over historical session performance (last 13 months data).
-
Quickly drill-down across dimensional analysis to focus on impacted sessions and viewers.
For more information, see Diagnostics.
Filtering
Trends filters data with precision, offering three types and three methods for focused analysis.
The three types of filters are Main filters, Secondary filters and Compare filters.
-
Main Filters:
Main Filters supports four filtering methods:
-
Single click instant filtering: You can click the dimension data entry to apply the filter. When the filter is applied the metric widget and dimension data is updated based on the applied filter. The applied filter in visible in and you can share this filter across other users.
-
Filter Builder Tool Bar settings enable quick acces to save the current filter settings, open the advanced filter builder settings, updated an applied filter, and access filter settings in savedfilters, dimensions, and custom tags.
-
Advanded Filter builder: Trends allows you to build the filter from the Filter Builder option using the basic or advance modes, which displays on the main filter bar updating the diagnostic metric widget and dimension data.
-
Inline Filters: You can create, edit, and apply filters without opening the filter builder pop-up screen.
-
-
Secondary Filters: This is built on top of the data built on the main filter which is applied from the distribution view in the metric widget. For example, If there is a main filter applied to view the Roku traffic, the secondary filter is applied only the selected metric using the Roku traffic. See Using Secondary Filters and Secondary Filter Examples.
-
Compare Filters: You can quickly compare the filters for the top dimension entities or the custom lists of dimension filters.
Secondary filters
This is built on top of the data built on the main filter which is applied from the distribution view in the metric widget. For example, If there is a main filter applied to view the Roku traffic, the secondary filter is applied only the selected metric using the Roku traffic.
See Using Secondary Filters and Secondary Filter Examples.
Combinatorial Filters
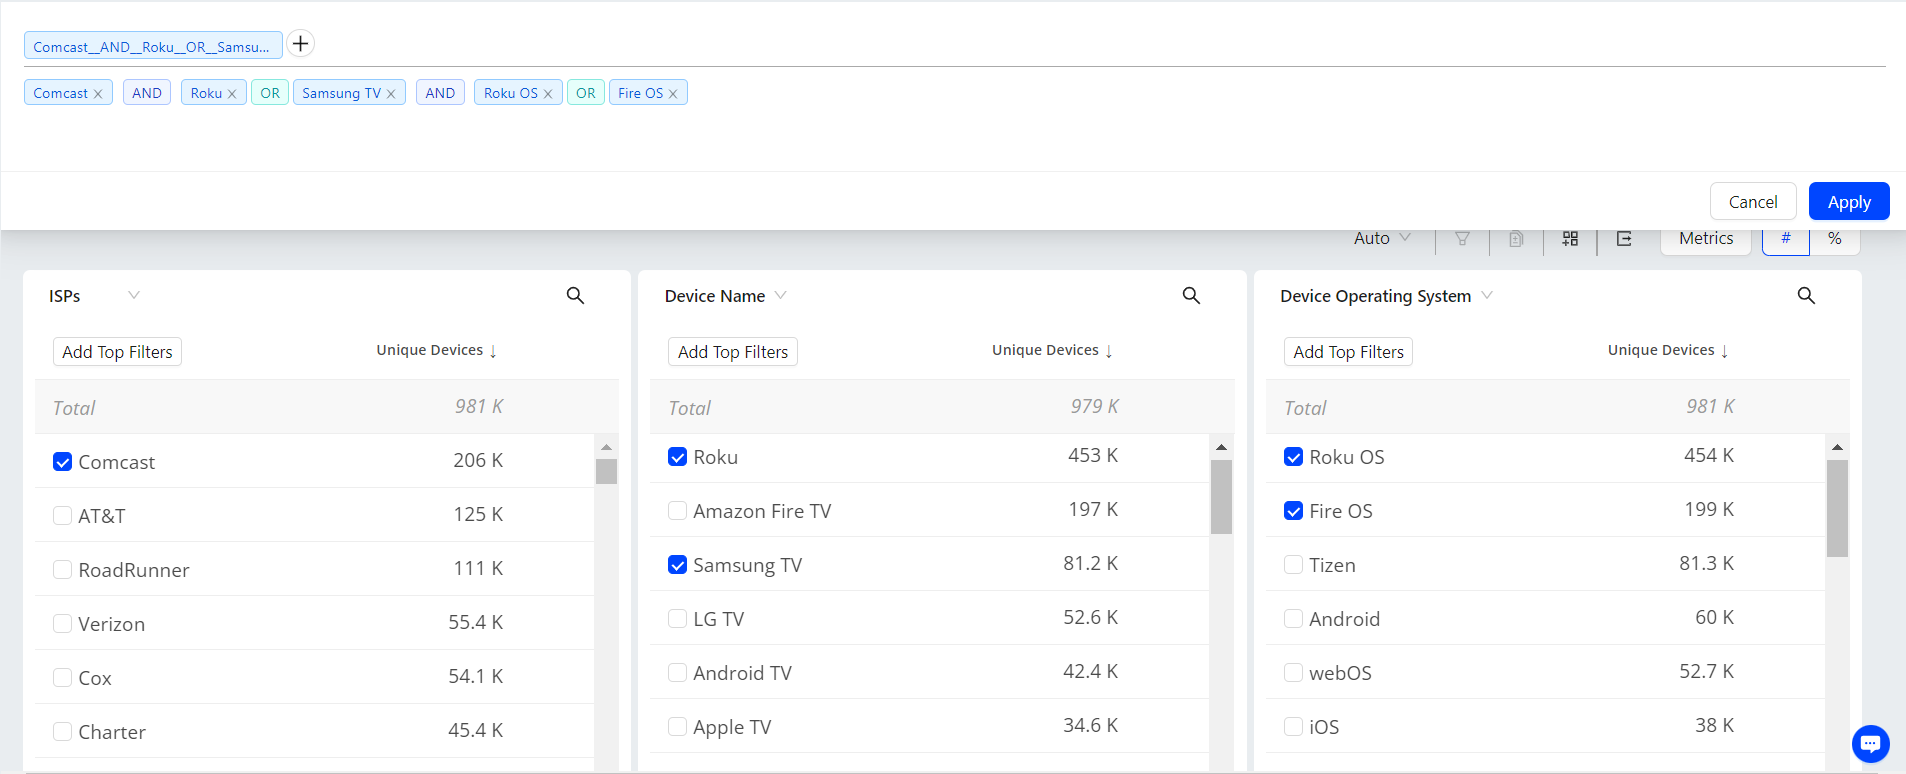
To create a filter for a known combination of dimension values (building the filter options in the panel before applying settings), click Advance click the + symbol next to the dimension values to add the values to the combinatorial filter box. Clicking the + symbol next to additional dimension values creates complex filters based on logic OR and AND filter rules.
-
Logical OR filter rules apply to dimension values from dimensions that already have a value in the current filter (same dimension column).
-
Logical AND filter rules apply to dimension values from a new dimension, not already specified in the current filter (new dimension column).
Filter Builder
Easily visualize side-by-side comparisons based on advanced filter settings, in the dimension tables with links to Trends.
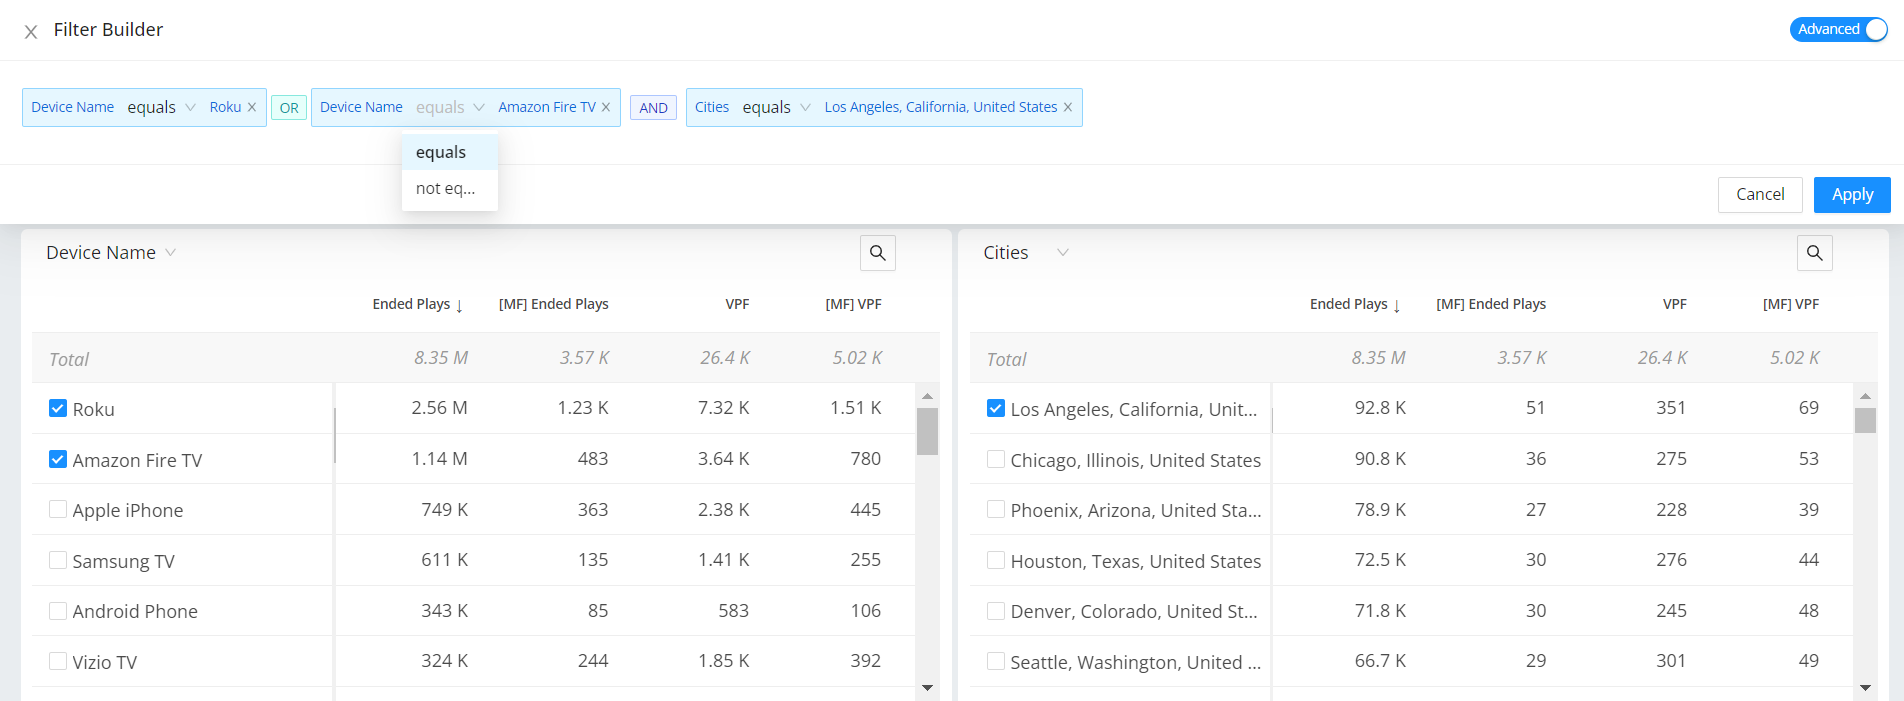
After zoom, select and dimension filters, you can create the filters to see the specific data. Along with the single click filters you can create dimension filters based on equals and contains filter options.
For example, create a dimension filter for asset analysis that does not contain video trailers.
Trends allows you to create a complex filter with conditions easily. Also, you can filter the unknowns and compare the between Basic and Advance modes using the toggle.
The Advanced option allows you to easily see the conditions applied and modify the filters. This advance mode allows you to change the condition equals and not equals on the fly. For more details, see Filters.
Inline Filters
Using the filter builder in Trends enables focused data analysis along with inline filter creation and updates.
-
Inline filter rule addition, modify operators, and directly apply the filter rule.
-
Save inline settings to create new filters.
-
Open filter builder for a full view of filter creation and management.
-
Open Filter Management to browse saved filters, and directly apply to Trends.
For more information, see Filter Builder.
Compare In Trends
Trends offers instant comparison in addition to the Compare dashboard. Quickly compare filters for the top five dimension entities or across a custom dimension filters.
For more information on Compare Integrated in Trends, see Compare.
Focus
Click the Focus icon in a metric time series to display an expanded view of the time series above the trend data.
The focused view of the metric provides the enhanced view of the selected metric along with the secondary metric details. Clicking the distribution icon to see the distributed view of the time series.
With distributions, you can easily uncover a deeper understanding of the significance of each metric per session. The distributions illustrate the impact of streaming sessions on the overall metric value, helping you determine whether the metric reflects consistent session behavior or if outliers cause session variance. For more details, see Trends Diagnostics.
Log Scale
Log scale provides the bar graph view in diagnostics metric widget when the secondary filter is applied. This is useful when you are analyzing larger values of the data.

Layouts
You can select from multiple layout options to enhance your experience and customize the interface to fit your needs. These new layouts allow you to tailor the dashboard’s appearance, giving you greater flexibility to interact with data in a way that aligns with your workflow and preferences.
![]()
For more information on different layouts, see Layouts in Trends.
Common Tasks by Role
Quickly get started with the tasks for each type of user.
-
ConvivaVSI system settings involve administrative tasks such as, inviting and managing users, managing filter settings, setting up API access, selecting session tags as dimensions, configuring the business / technical metric logic, and notifications, including alerts and emails.
-
TechOps and others can easily perform issue resolutions and continuous improvements, monitoring overall operational performance metrics, drilling-down to discover impacted dimension entities, and analyzing impacted session timelines and viewer experiences. All these diagnostics and operational capabilities are available for historical and real-time data, across customizable levels of granularity (1 minute to 1 month).
-
Optimizing Operational Performance (Product Lead)
Product leads and others optimizing operational performance can easily monitor overall operational performance metrics, content audience levels, and ad experience through customized executive-level displays and scheduled email reports. Also, compare asset and other dimension-based performance to gain product performance and audience insights.
-
Fixing Customer Issues (Customer Care)
Customer care professionals can easily monitor overall viewer experiences along with specifics details for each viewer session.
-
Analytics and Reporting (Data Science)
Data science and other data reporting teams can easily monitor overall summary metrics, audience levels, and detailed metrics to determine the health of their streaming
-
Optimizing Overall Performance (Executive Stakeholders)
Streaming executives and others optimizing overall performance can easily monitor overall operational performance metrics, content audience levels, and ad experience through customized executive-level displays and scheduled email reports.
Interface Components Real-Time Monitoring Automatic Insights Streaming Performance Index (SPI) AI Alerts Dimensional Drill-Downs Impacted Sessions Impacted Viewers Secondary filters Saved Dashboard Public Dashboard Private Dashboard Benchmarks MetricLens Overview Viewer Session Notification Channels Webhooks AI Alerts Email Subscription Alert Forwarding PagerDuty EI Service Integrations Viewers Presets Annotation Time Granularity Share Save Export Diagnostics Filtering Filter Builder Focus
