With VSI, customer care professionals can easily monitor overall viewer experiences along with specifics details for each viewer session.
| Executive Features | Description |
|---|---|
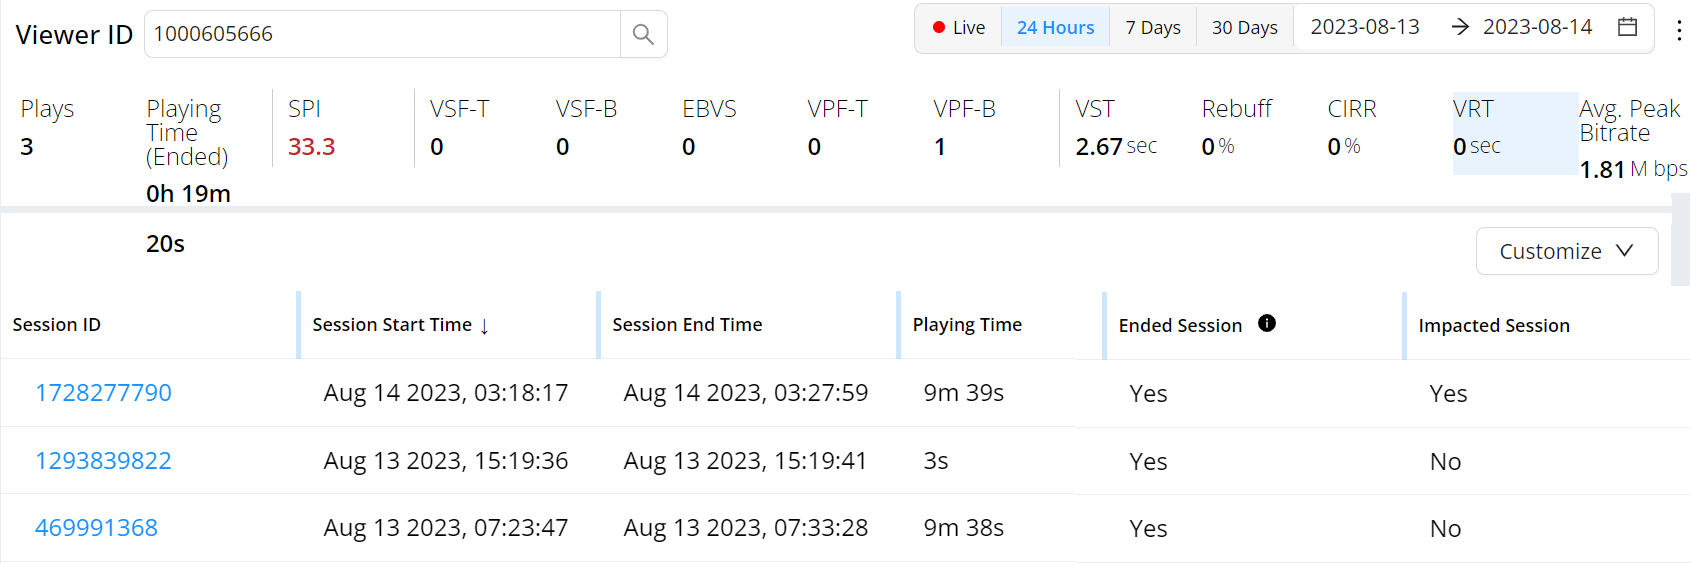
View Streaming Experiences
Access Pulse: Trends > Viewer Session > Select Viewer ID |
Quickly display the details of viewer streaming experiences across the sessions watched in a given time period. With summary, session-level data and metrics, you can easily determine a viewer's overall stream experience, while also drilling into the specific performance measurements of each session:
For more information on viewer module, see Viewer Module. |
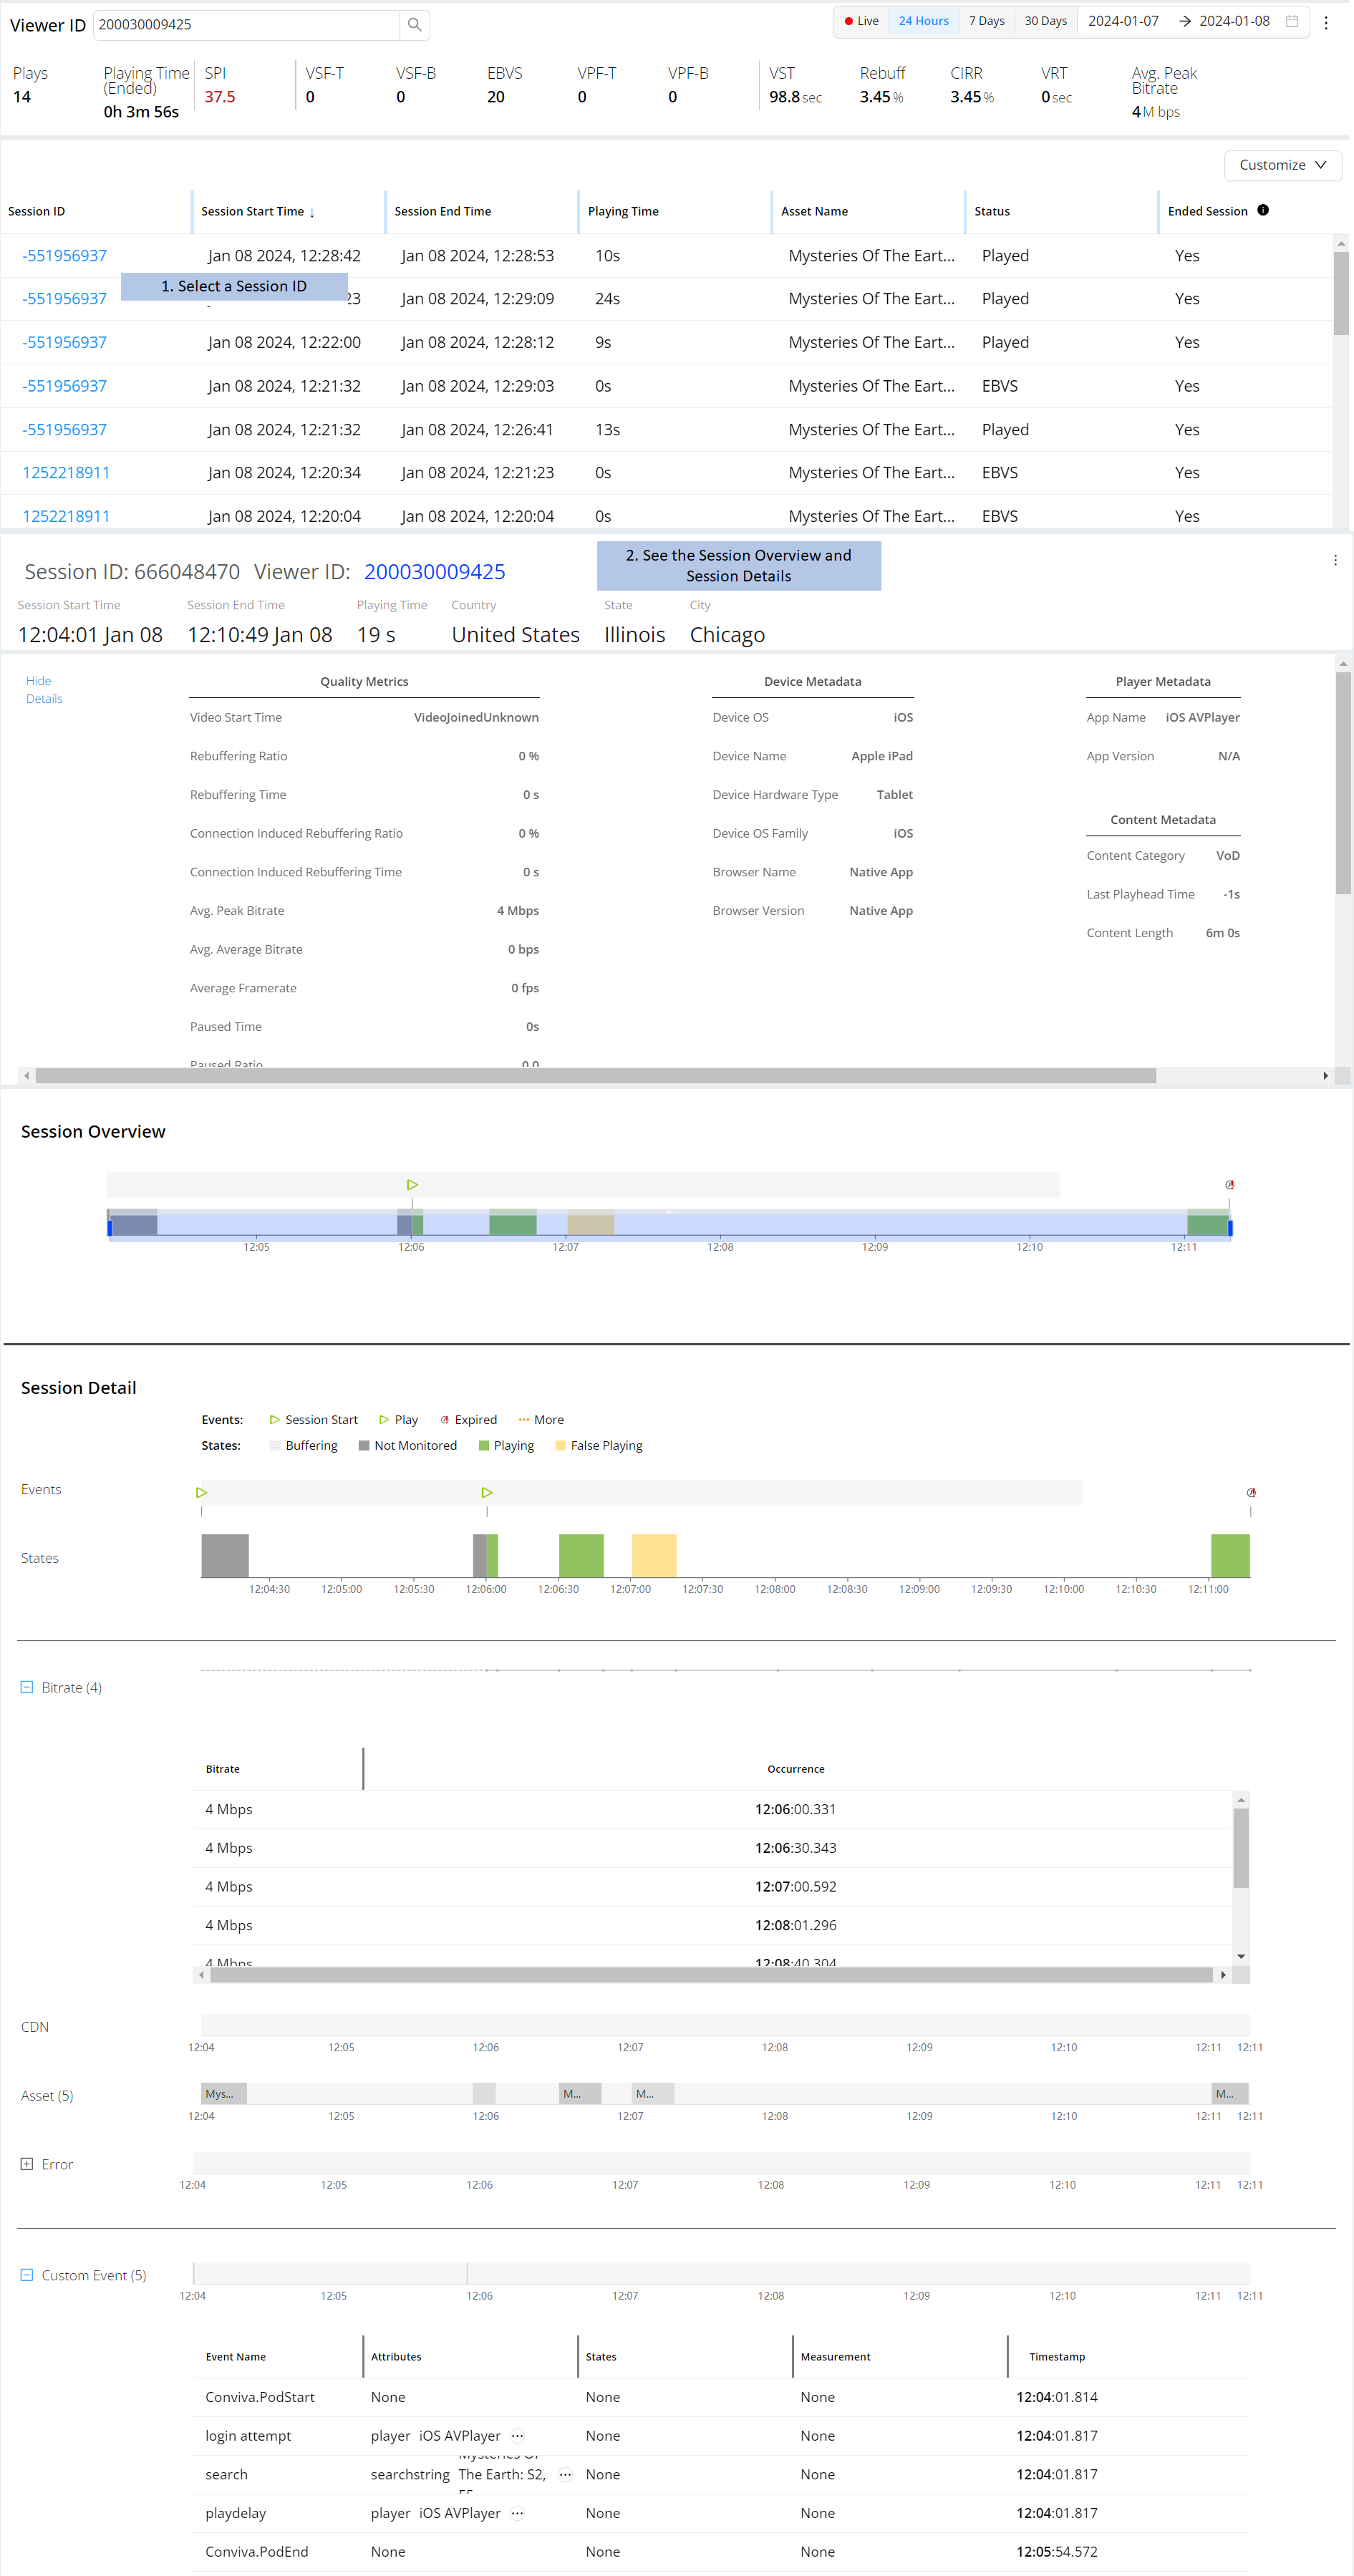
View Session Timelines
Access Pulse: Trends > Viewer Session |
Displays session details to confirm viewer experiences align with streaming events and actual session performance.
For more information on viewer sessions, see Viewer Sessions. |
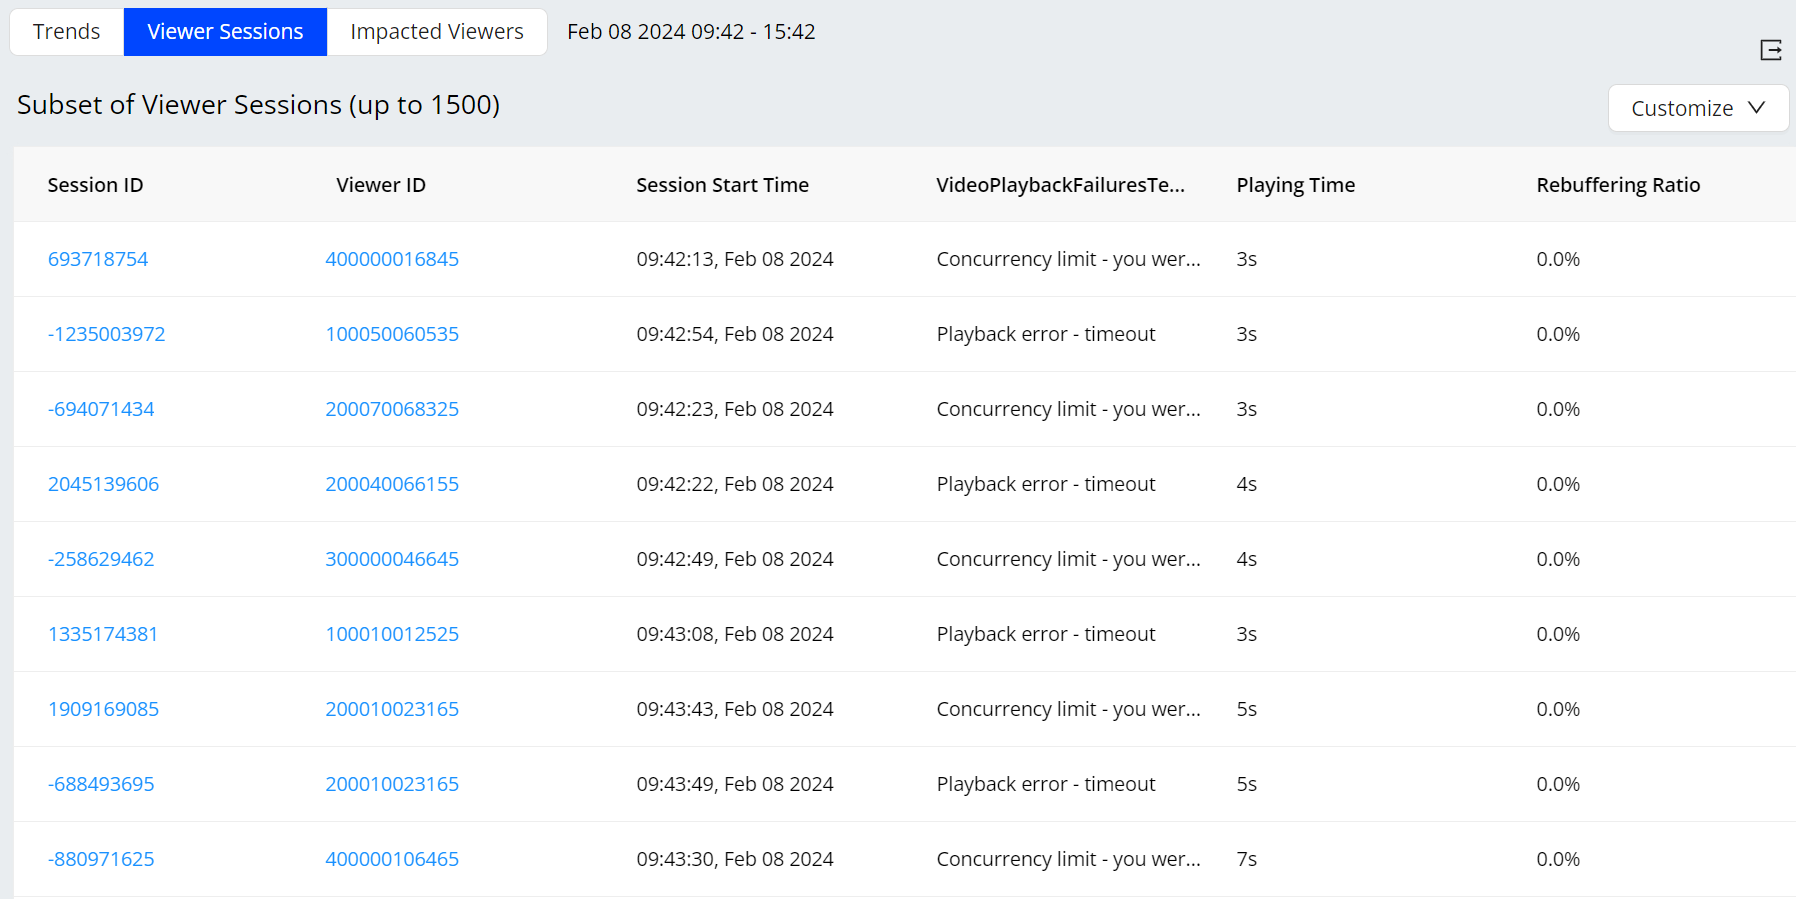
View Impacted Session
Access Pulse : Trends > Viewer Session |
Discover the most critical causes of viewer impacts and failure patterns across the impacted sessions. VSI provides a high-level time series for metric progressions analysis and the ability to drill down to the minute-level analysis of the impacted viewer session analysis:
For more information on viewer session analysis, see Viewer sessions. |
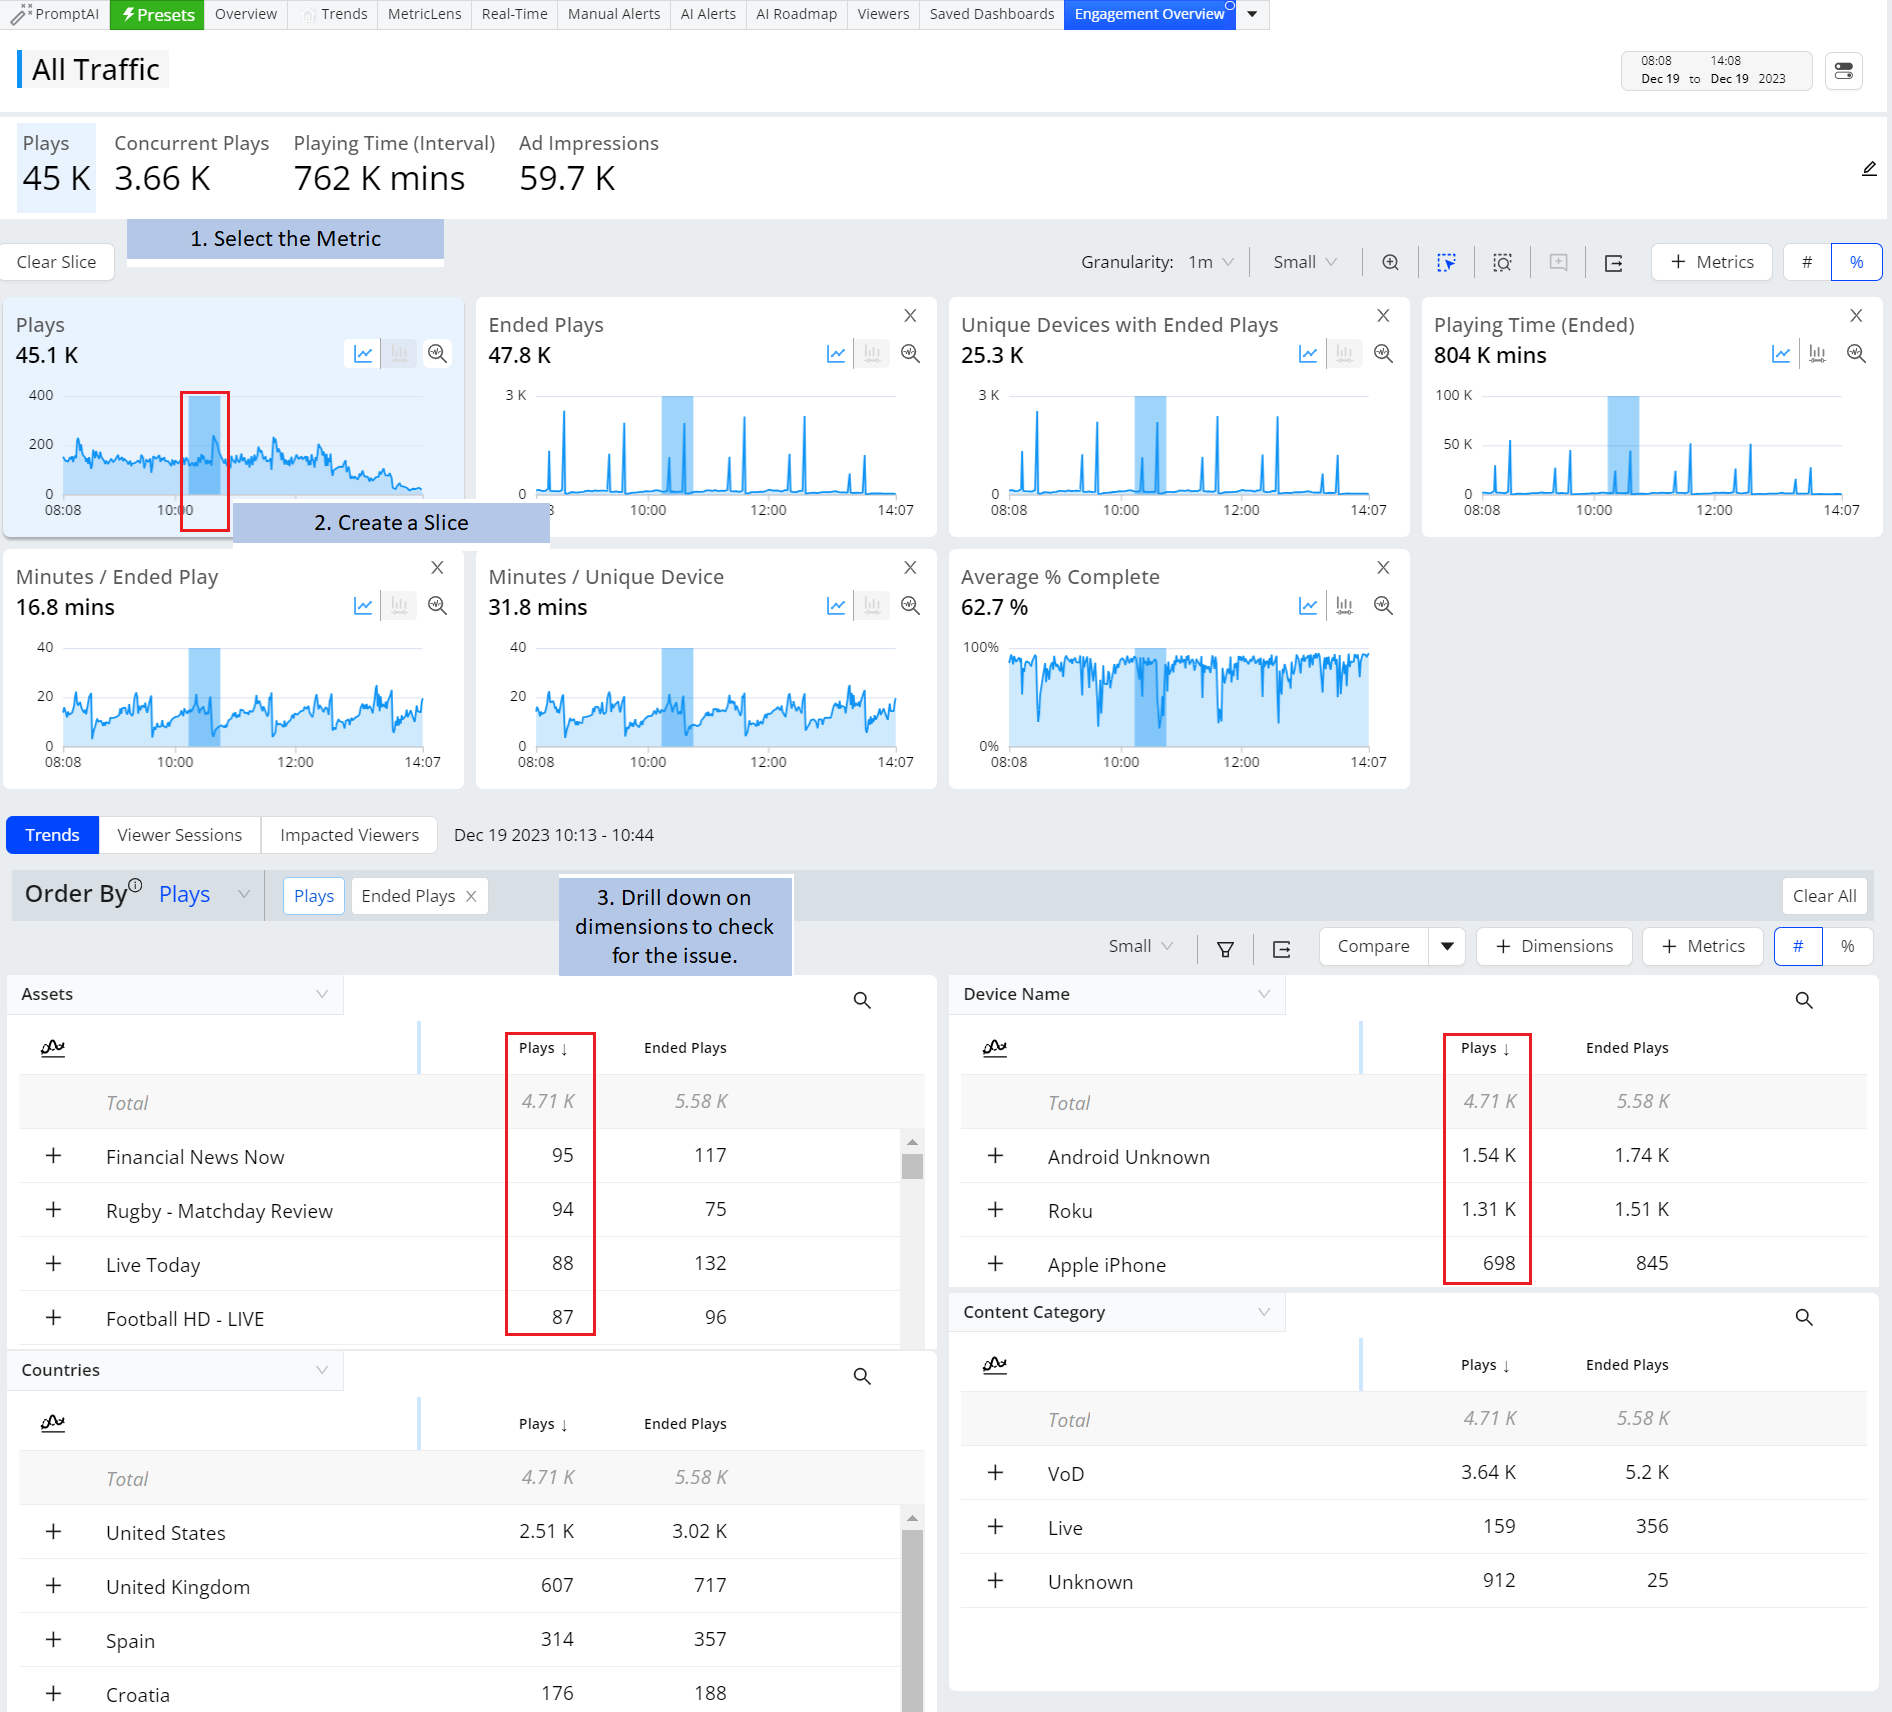
View Presets: Engagement Overview
Access Pulse: Trends > Presets
|
Track Audience and Engagement details by monitoring metrics, such as Ended Plays, Unique Devices with Ended Plays, Ended Plays Duration Minutes/ Ended Play, Minutes / Unique Device, and Average % Complete. For more information on presets in Trends, see Presets. |
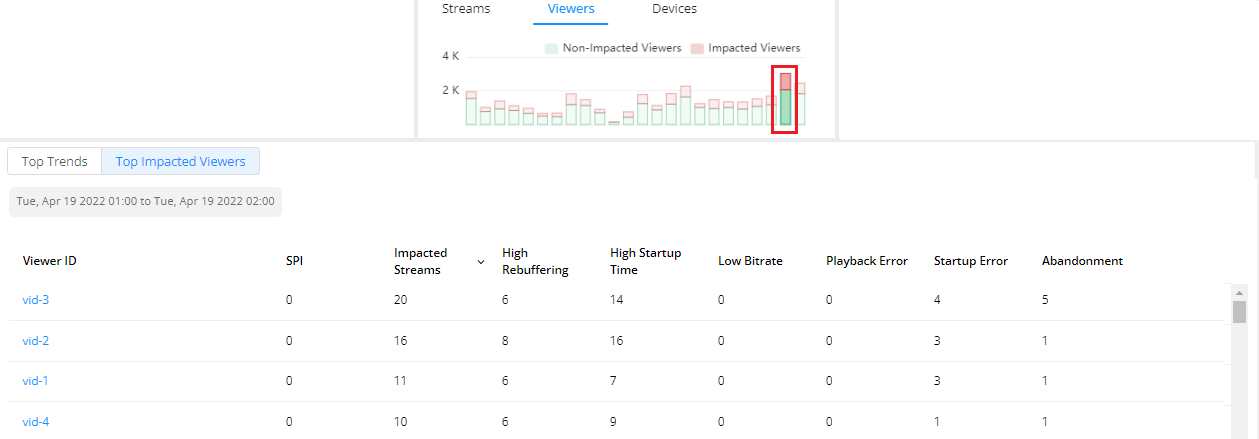
View Impacted Viewers and Sessions
Access Pulse: Overview
|
For more information on Impacted Viewers and Sessions, see Overview. |