Trends enables focused data analysis through filtering. Trends provides three types of filters and three different ways of filtering the data.
The three types of filters are Main filters, Secondary filters and Compare filters.
-
Main Filters:
Main Filters supports four filtering methods:
-
Single click instant filtering: You can click the dimension data entry to apply the filter. When the filter is applied the metric widget and dimension data is updated based on the applied filter. The applied filter in visible in and you can share this filter across other users.
-
Filter Builder Tool Bar settings enable quick acces to save the current filter settings, open the advanced filter builder settings, updated an applied filter, and access filter settings in savedfilters, dimensions, and custom tags.
-
Advanded Filter builder: Trends allows you to build the filter from the Filter Builder option using the basic or advance modes, which displays on the main filter bar updating the diagnostic metric widget and dimension data.
-
Inline Filters: You can create, edit, and apply filters without opening the filter builder pop-up screen.
-
-
Secondary Filters: This is built on top of the data built on the main filter which is applied from the distribution view in the metric widget. For example, If there is a main filter applied to view the Roku traffic, the secondary filter is applied only the selected metric using the Roku traffic. See Using Secondary Filters and Secondary Filter Examples.
-
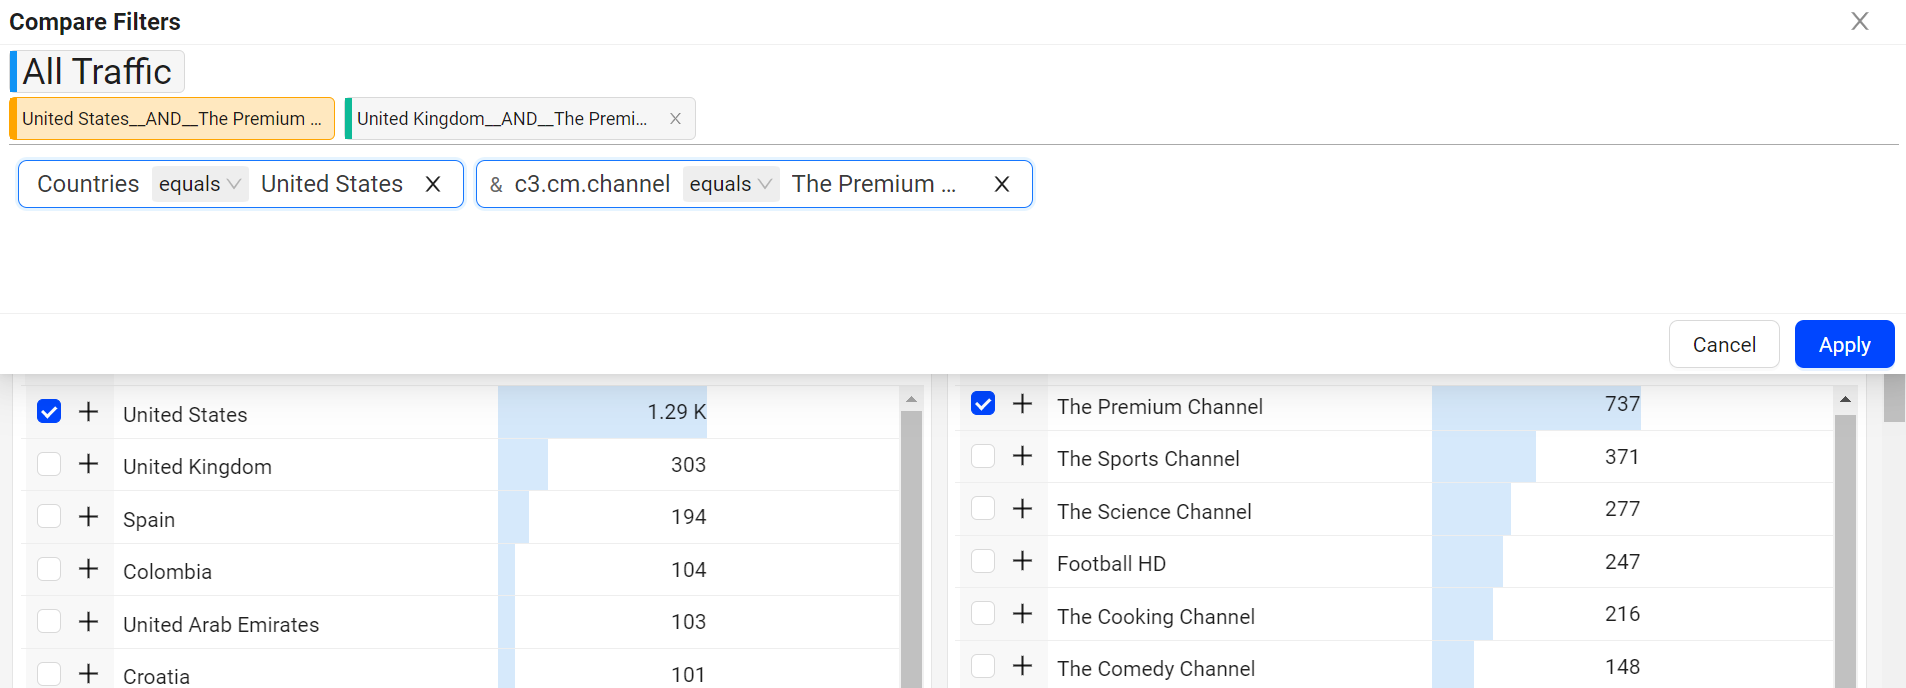
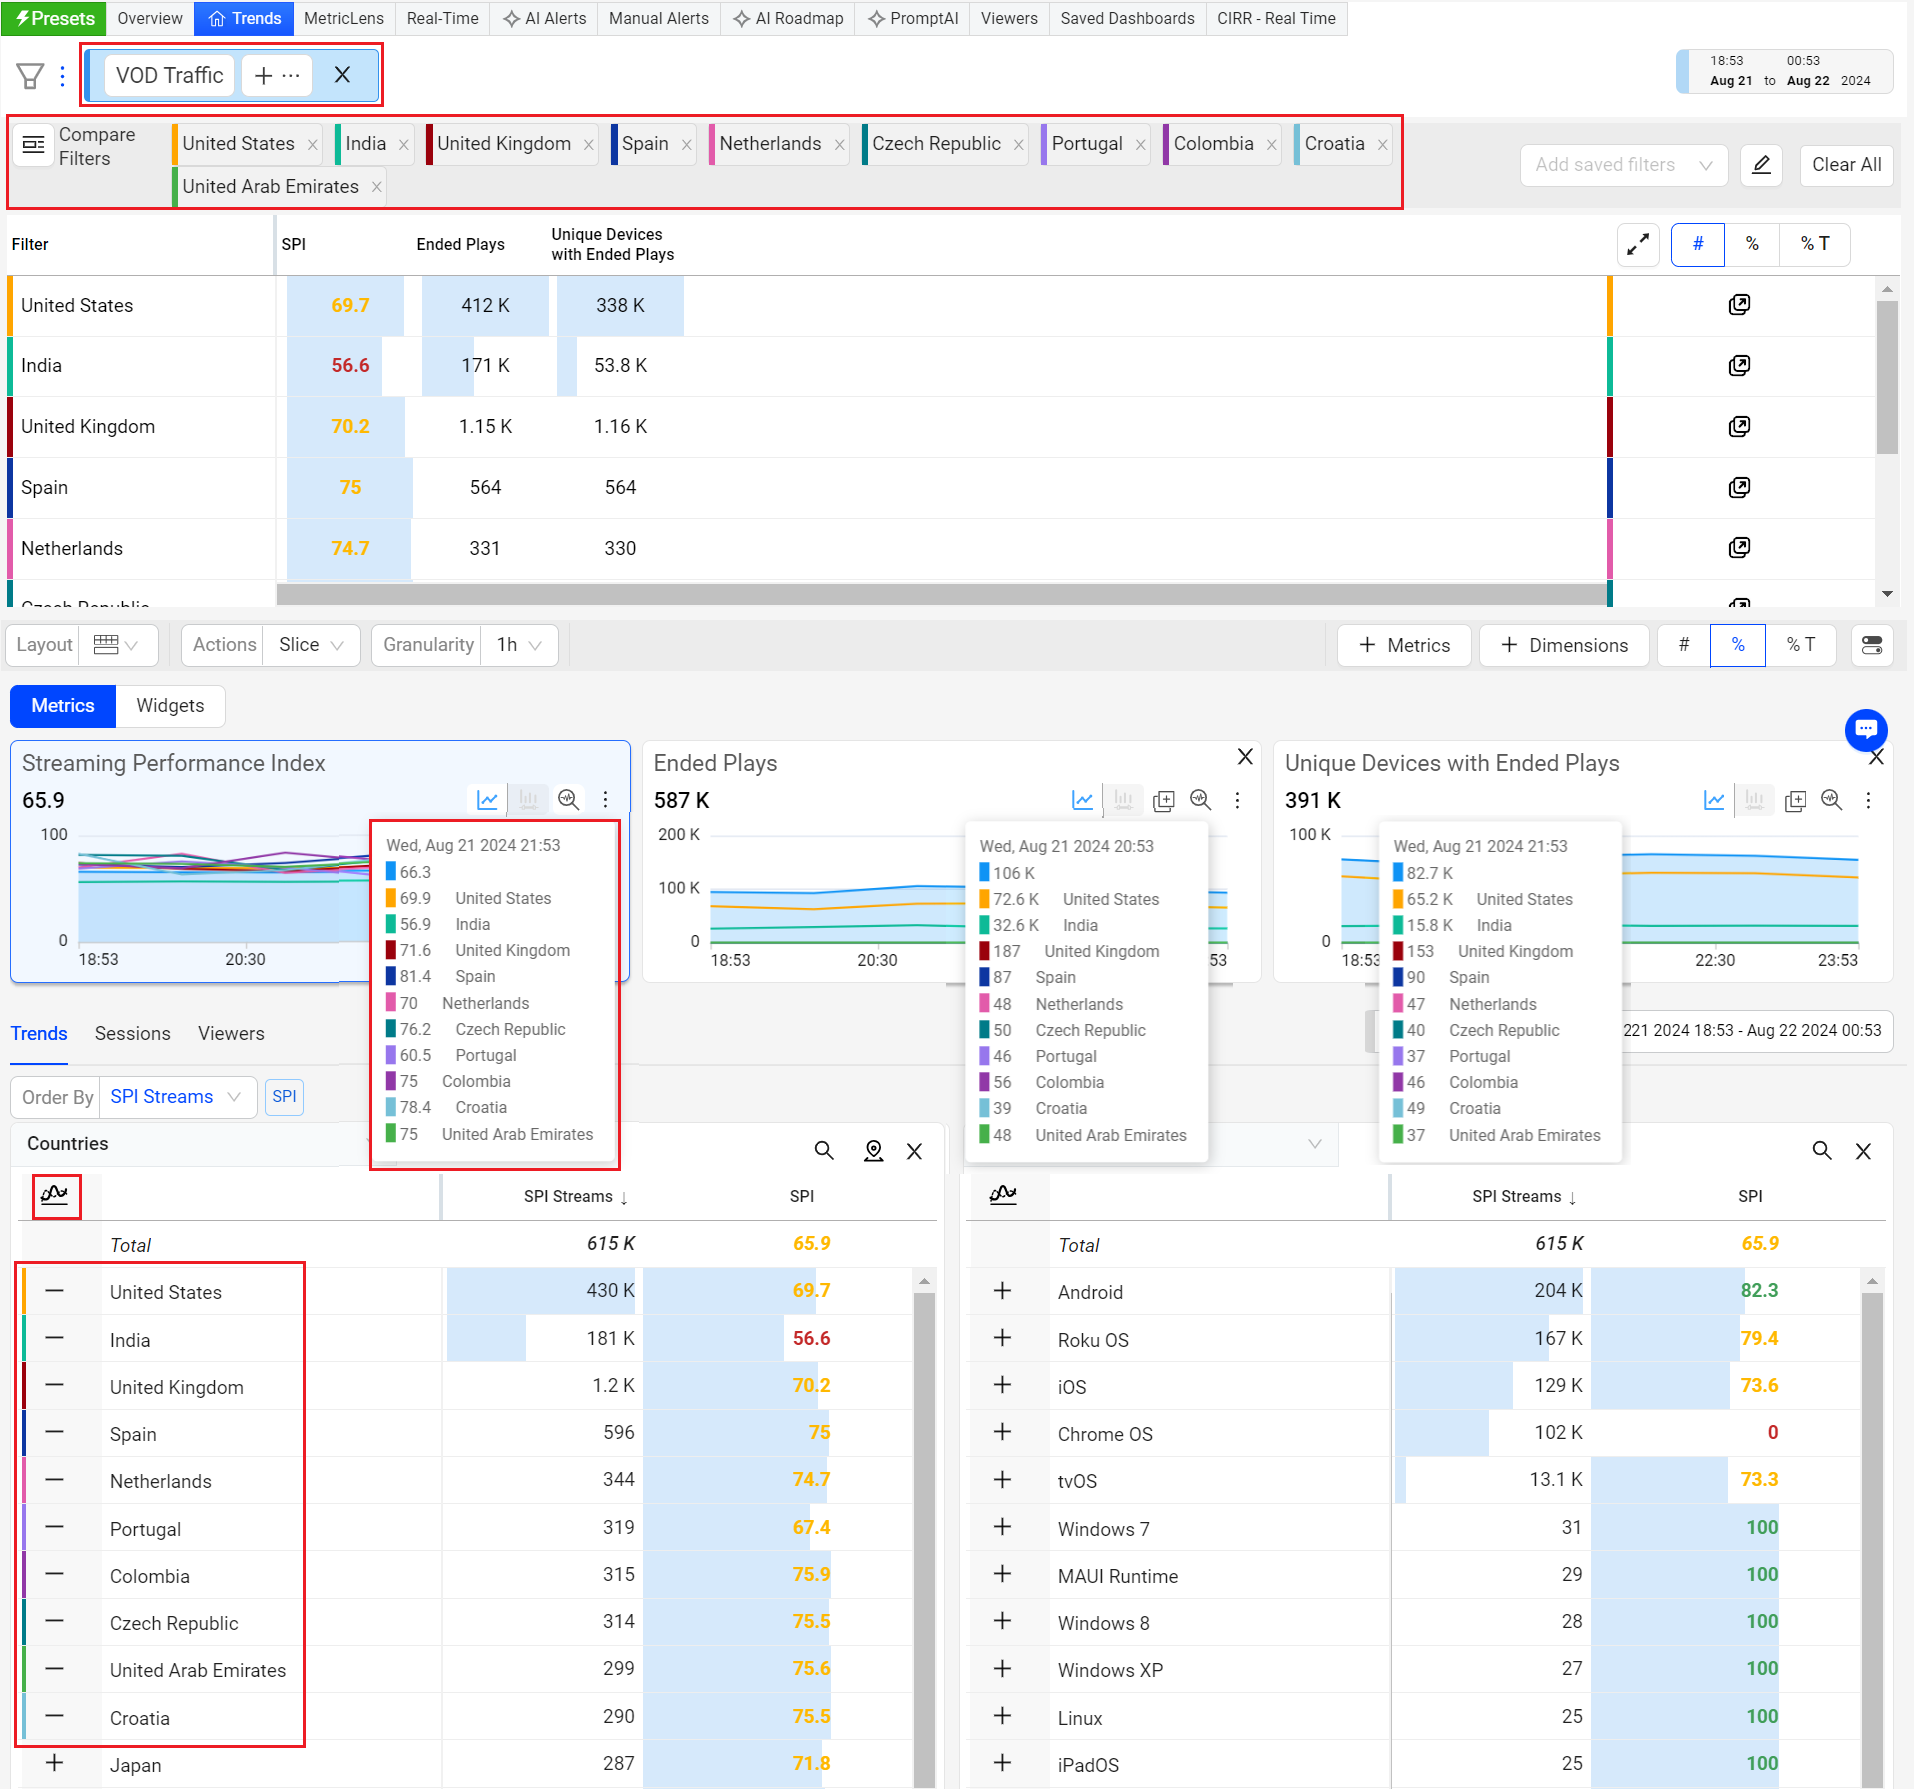
Compare Filters: You can quickly compare the filters for the top dimension entities or the custom lists of dimension filters.
Main Filters
Trends provides you to apply filters using single click instant filters or apply filters using Filter Builder (with basic and advance filtering options).

Filter Builder (based on Dimensions)
Easily visualize side-by-side comparisons based on advanced filter settings, in the dimension tables with links to Trends.
After zoom, select and dimension filters, you can create the filters to see the specific data. Along with the single click filters you can create dimension filters based on equals and contains filter options.
For example, create a dimension filter for asset analysis that does not contain video trailers.
Trends allows you to create a complex filter with conditions easily. Also, you can filter the unknowns.
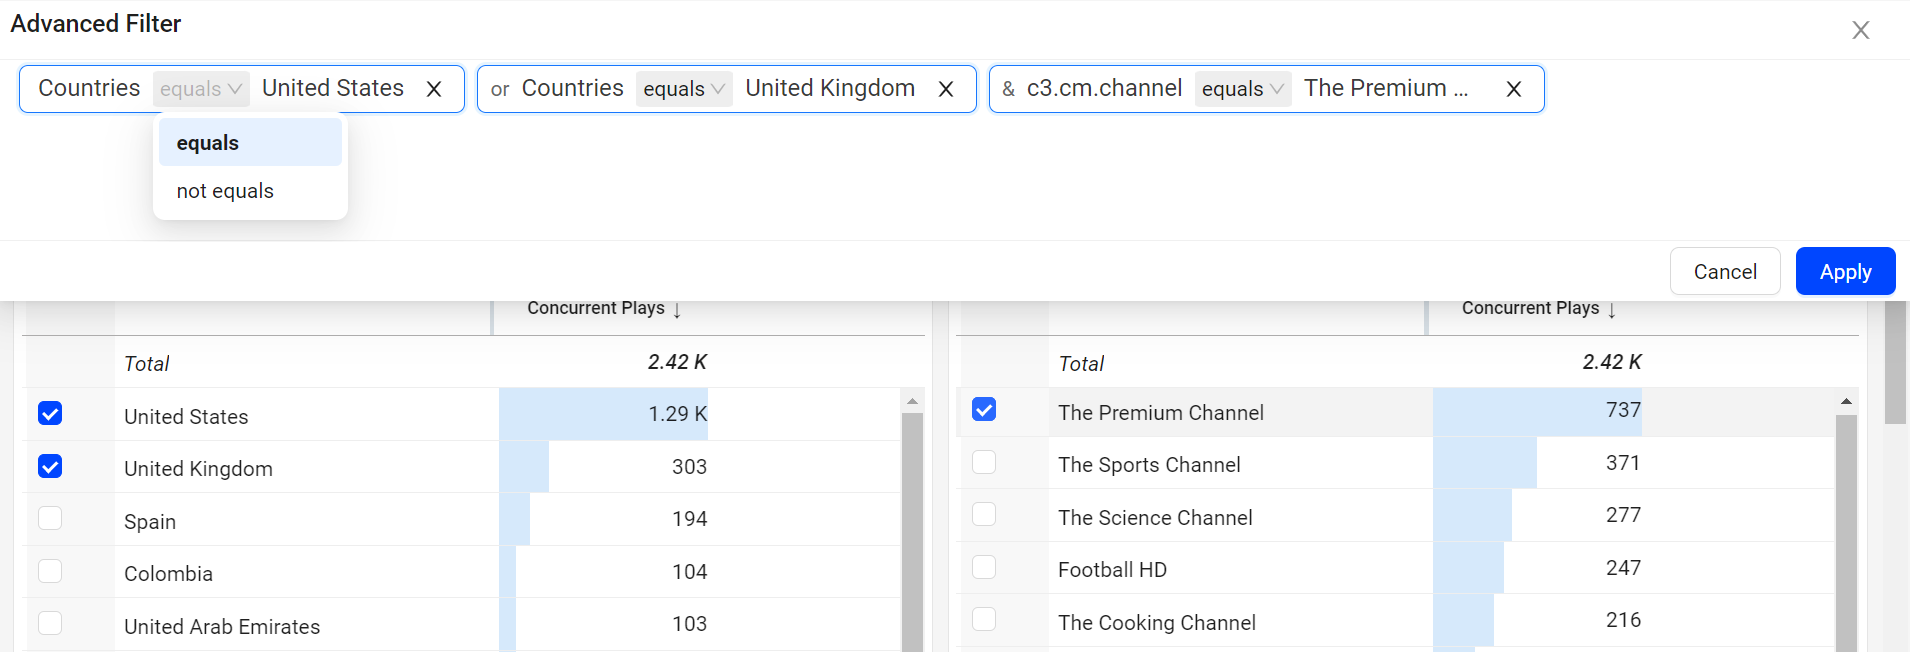
The Advanced option allows you to easily see the conditions applied and modify the filters. This advance mode allows you to change the condition equals and not equals on the fly.
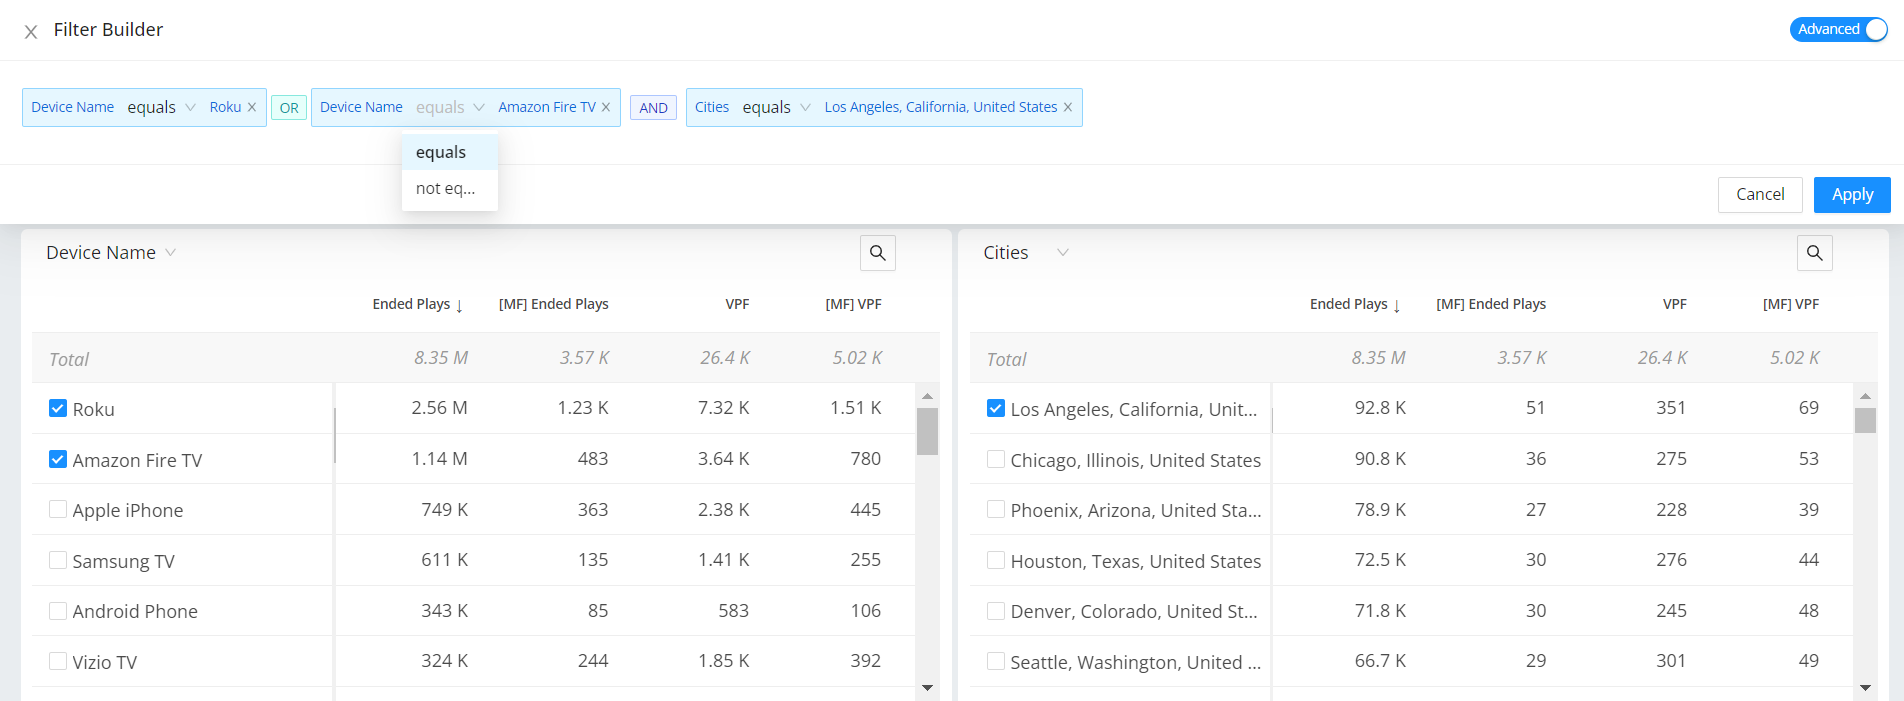
For example, set the advance filter for specific device groups while filtering out irrelevant assets to the performance analysis, such as trailers, older players, and viewers from less relevant geographies.
Note: When you add data from the same dimension table, it creates a logical OR, and when you add data from different dimension tables, it creates a logical AND during the filter creation.
Converting Custom Tags to Dimensions
Dimension Management enables the conversion of custom tags into custom dimensions for use in VSI and Ad Experience. Users can select the required tags for conversion, adhering to a tag conversion limit specified in their company's contract. For more information, see Dimension Management.
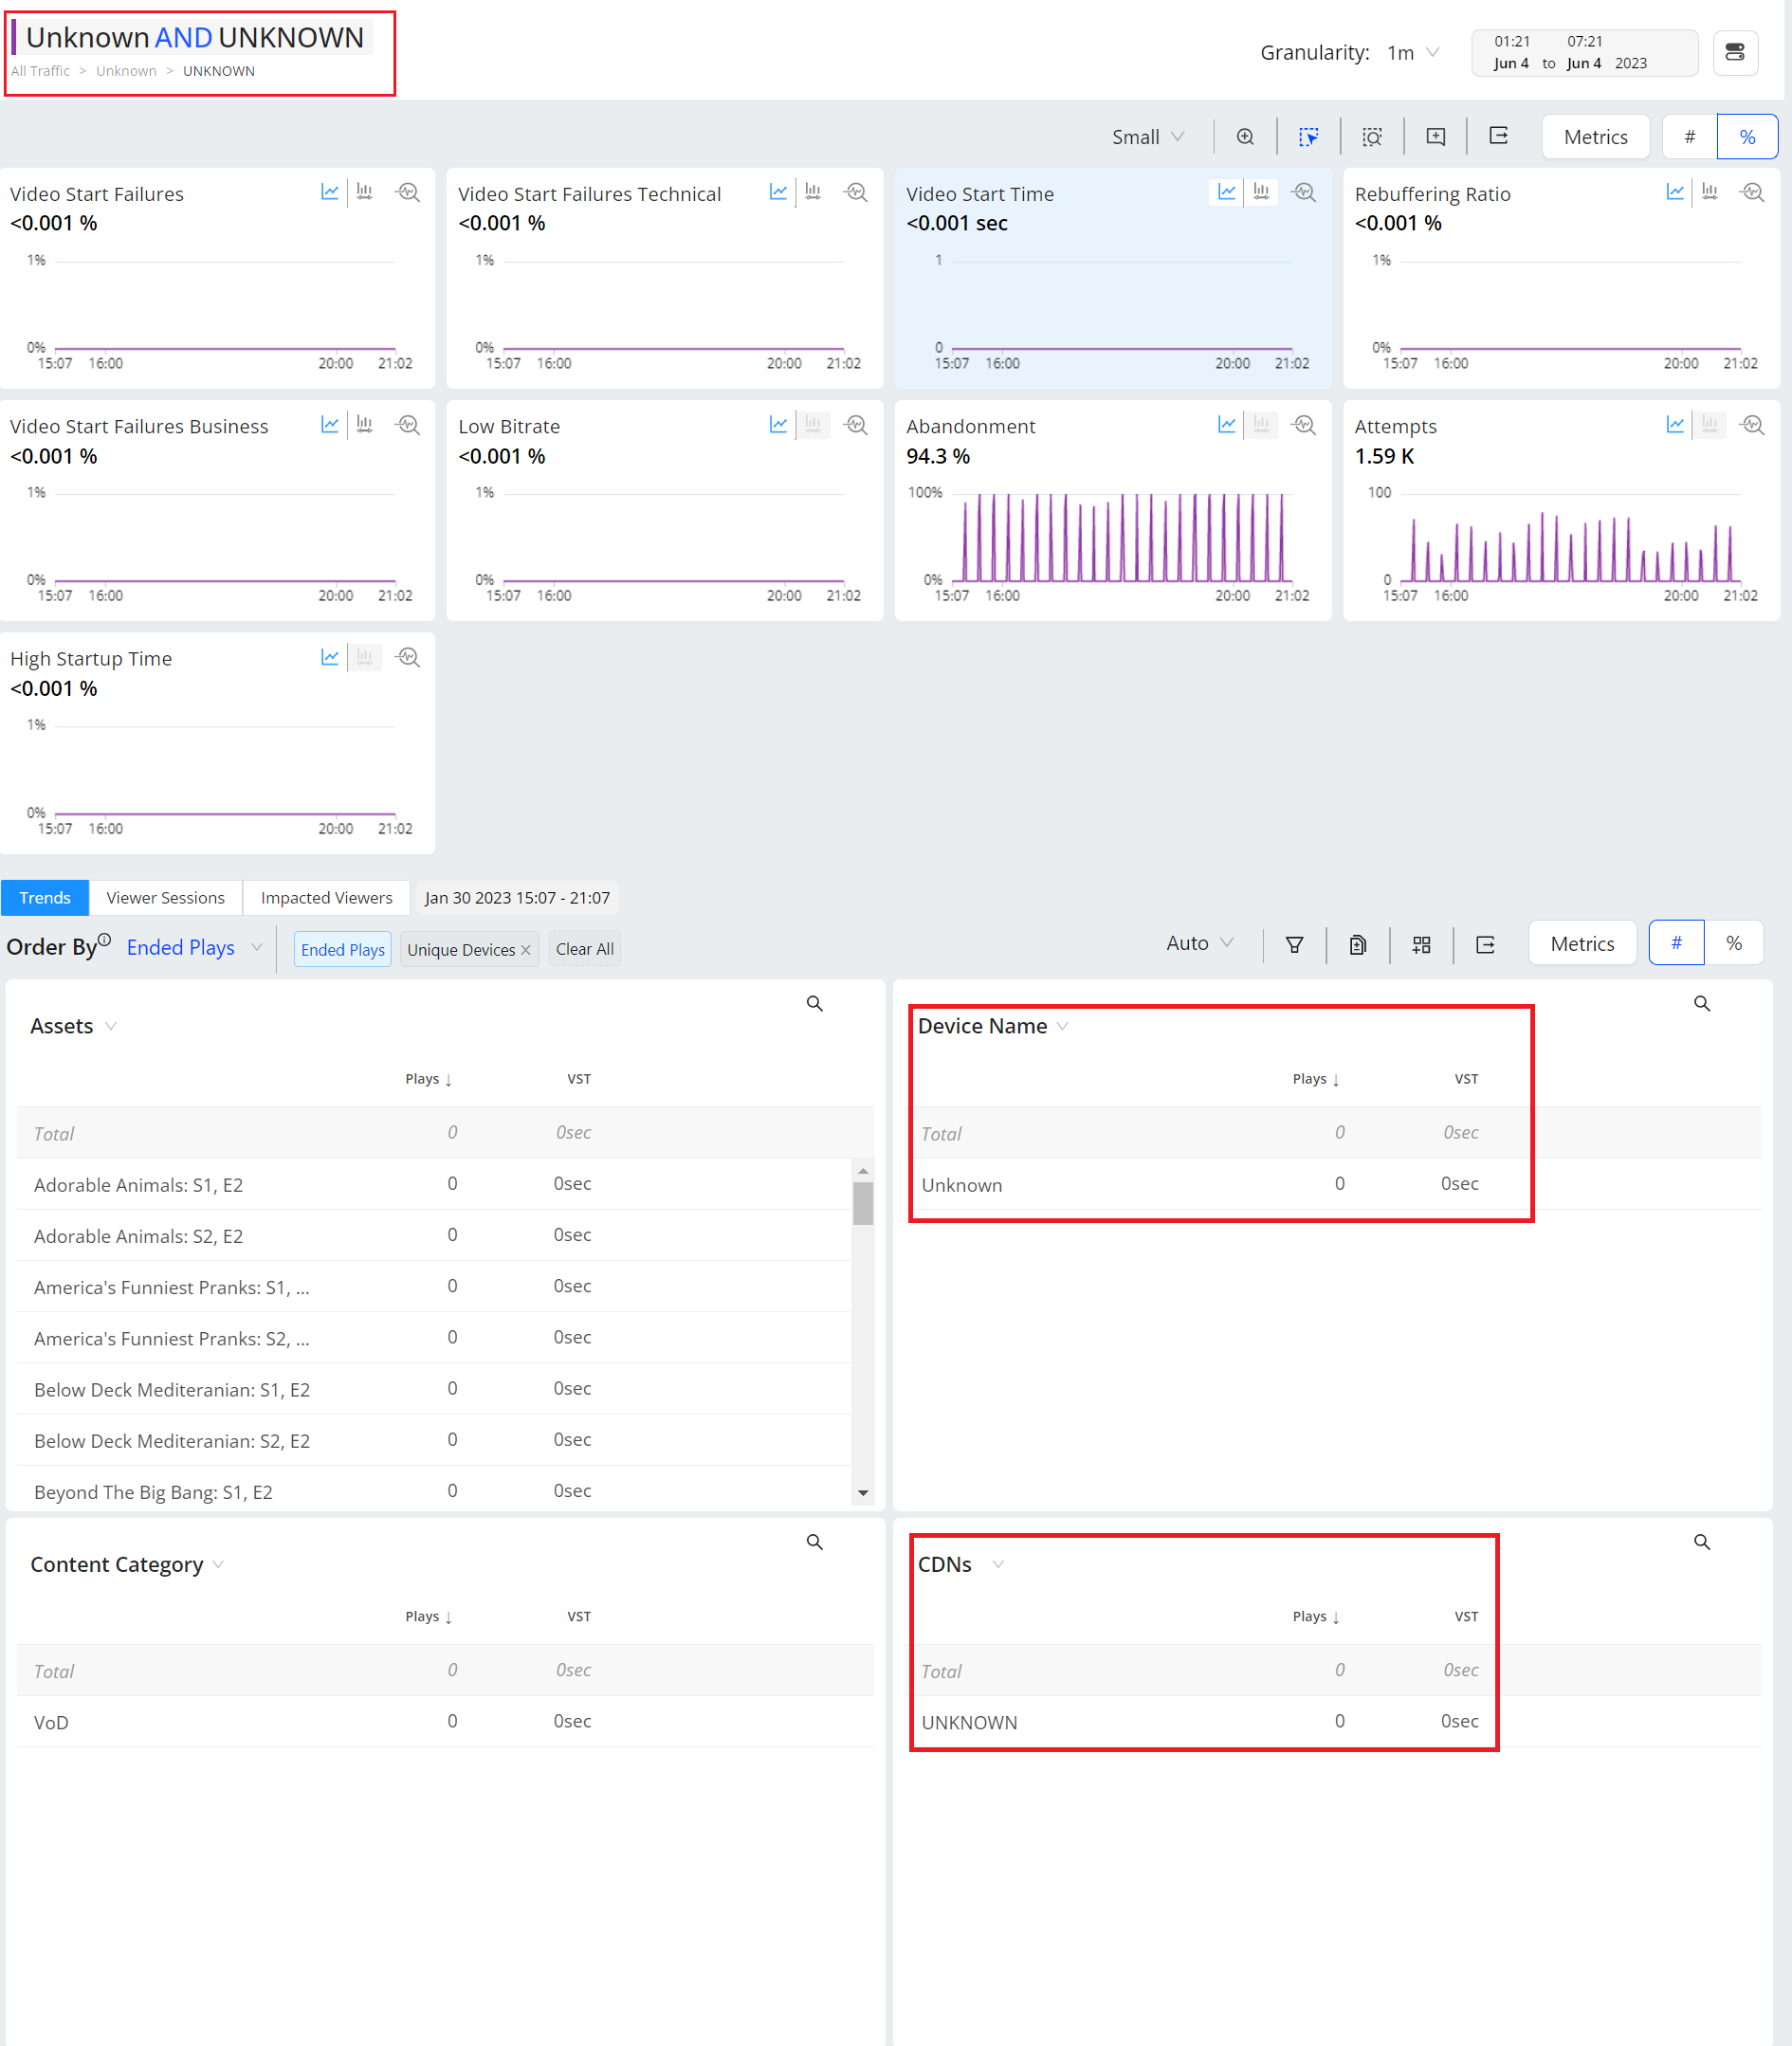
Filtering Unknowns
You can create one click instant filter on the unknown dimension values and drill down to the discover the details of the dimension values.
Standalone Compare
Trends provides a new instant compare mode, allowing easy compare in advanced modes.
Select the dimensions within or across the dimension table.
Compare In Trends
Trends offers instant comparison of filters for the top dimension entities or across a custom dimension filters. You can add up to 20 filters to compare the data.
For more information on Compare Integrated in Trends, see Compare.
Note: Advanced Compare Mode does not support direct editing of filter details. To modify filter configurations, navigate to the Filter Management and apply the required changes.
Annotate in Diagnostics and Compare dashboard
You can also annotate on the Diagnostics and the Compare dashboards.
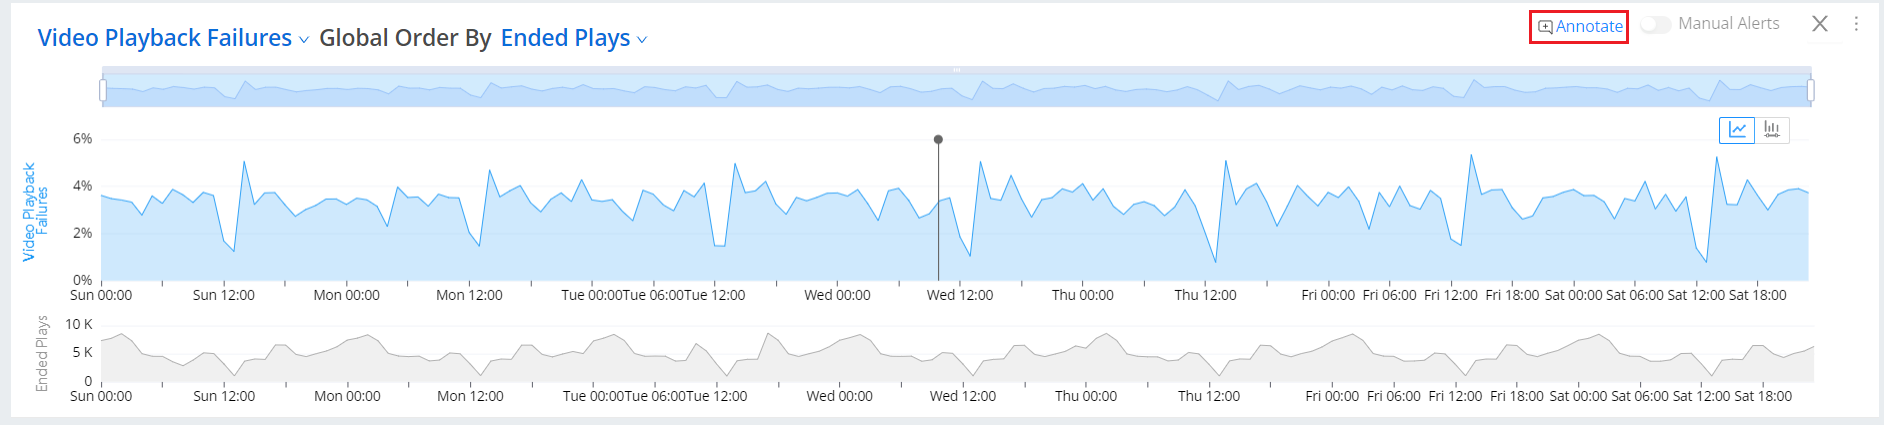
Annotate in Diagnostics
-
Click Annotate on the diagnostics view of the desired metric.
-
Click on the timeline to see the annotations popup page.
Annotate in Compare
-
Click Annotate on the compare page.
-
Click on the timeline to see the annotations popup page.
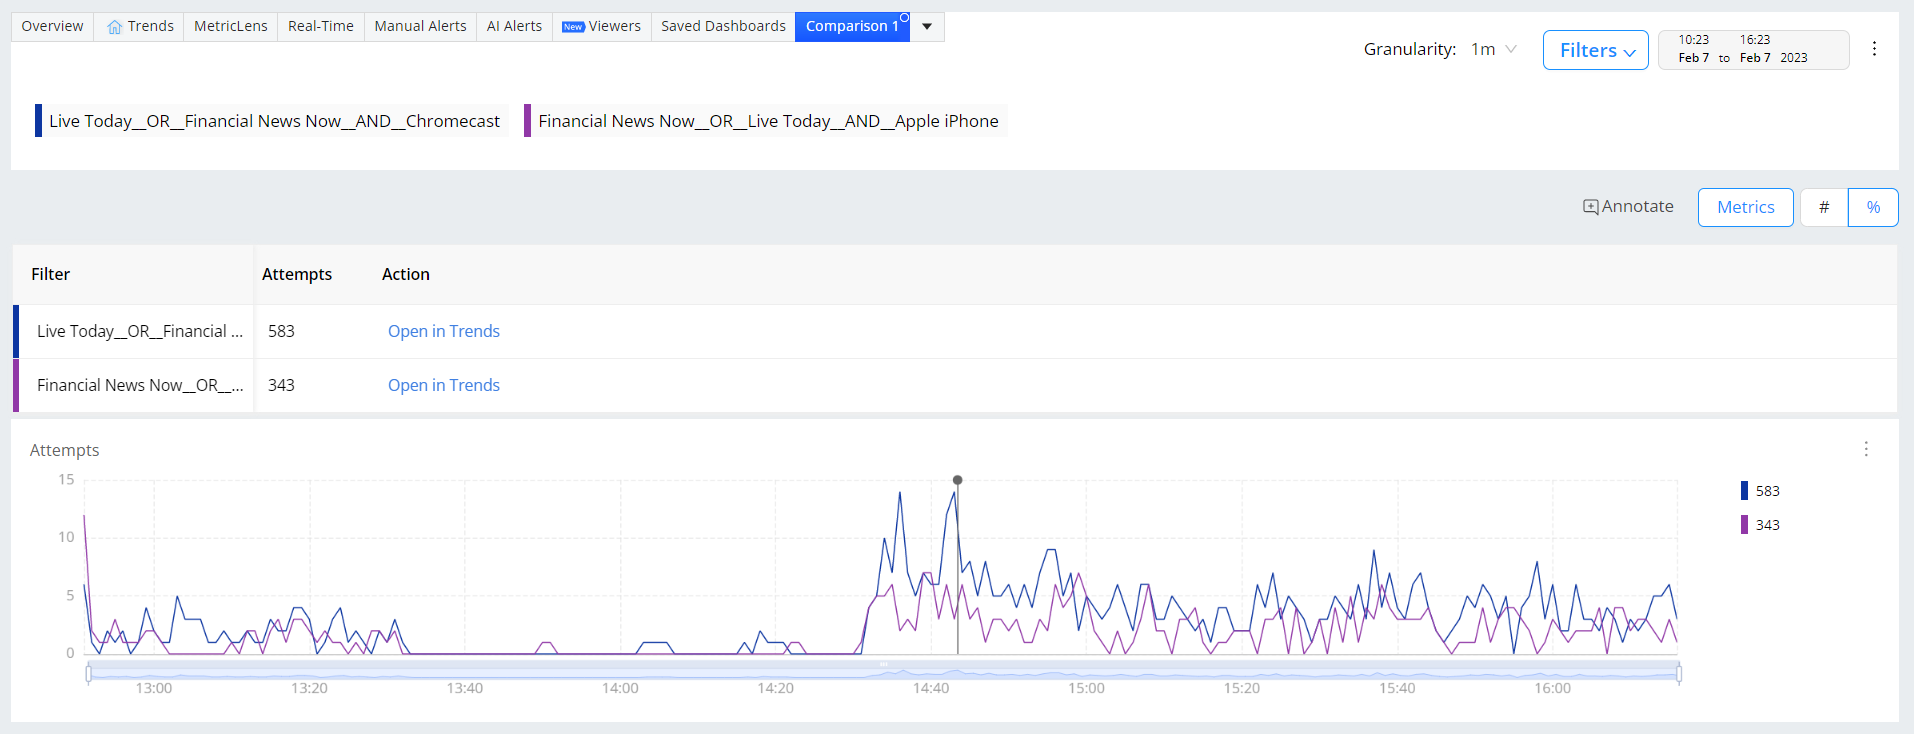
You can export the annotation data along with comments from the page export option in action bar.
Note: c3.[accountname] is mentioned in the exported file.
For more information on adding custom text to the metric widgets, see Annotations.
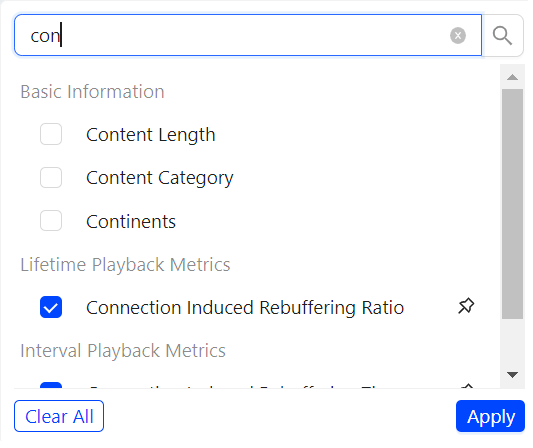
Search in customize drop-down
Enhanced the customize drop-down in viewer sessions with the search facility to search the desired dimensions.
Using Secondary Filters
To create the secondary filters:
-
Click Distribution
 on the metric widget.
-
Select the distribution bucket (bars).
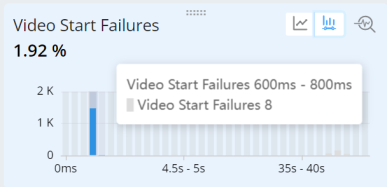
-
This creates a metric filter and filters the data in all the other metric widgets, displaying the primary filter (blue) and the secondary (black) trends in the time series.

The metrics which support distribution and metric filters are:
-
Audience and Engagement: Average % Complete, Ended Play Duration
-
Startup Experience: Video Start Time, Video Start Failure, Video Start Failure Business, Video Start Failure Technical, Exit Before Video Starts, Starting Bitrate, Exit During Pre-Roll
-
Playback Experience: Video Playback Failures, Video Playback Failures Business, Video Playback Failures Technical, Rebuffering Ratio, Connection Induced Rebuffering Ratio, Connection Induced Interrupted Plays, Video Restart Time, Avg. Peak Bitrate, Average Framerate, Avg. Average Bitrate, Bitrate Switches, Paused Ratio, Paused Time, CIR Related Exits, Exit During Pre-Roll
Log Scale
Log scale provides the bar graph view in diagnostics metric widget when the secondary filter is applied. This is useful when you are analyzing larger values of the data.
-
Apply a secondary filter.
-
Click the Focus button.
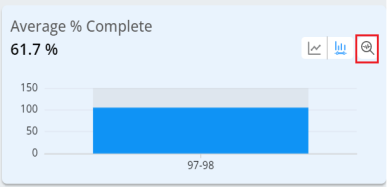
-
Click the Log Scale toggle button to see the bar graph view of the metric.
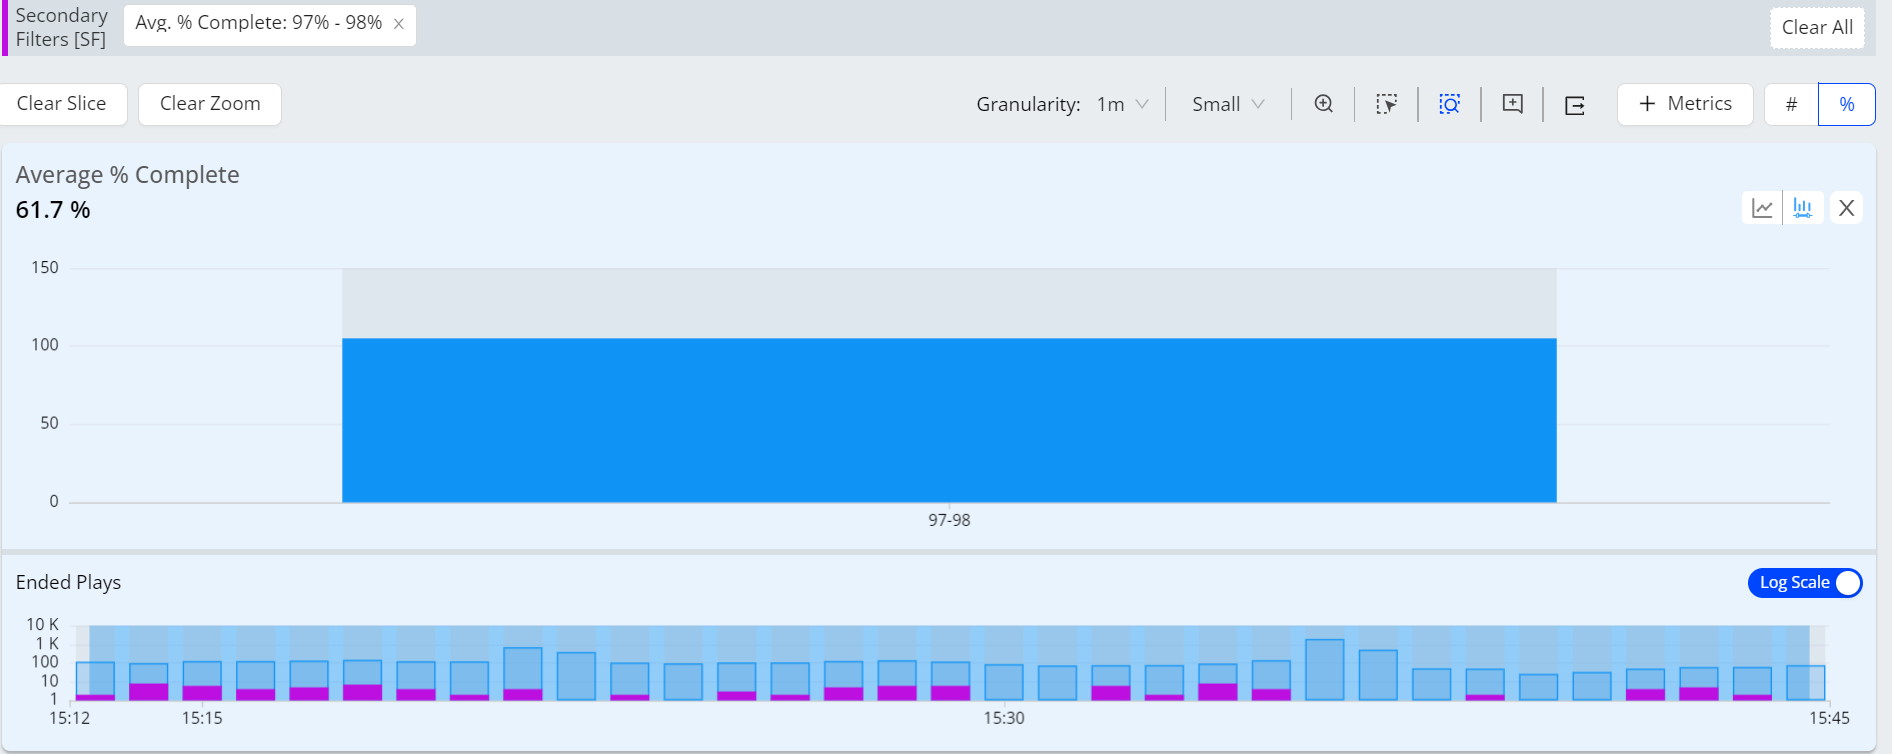
Secondary and Companion Metrics
For each filtered metric, a secondary metric along with the Unique Devices companion metric display for additional comparative analysis.
-
Secondary metric for different comparisons across startup and playback experience.
-
Companion metric for comparison based on unique devices.
| Startup Experience Metrics | Secondary Metric (Y axis in distribution) |
|---|---|
| VSF, VSF-B, VSF-T, EBVS, Exit During Pre-Roll, Abandonment | Attempts |
| Starting Bitrate | Ended Plays |
| Video Start Time, High Start Time | Plays |
| Playback Experience Metrics | Secondary Metric (Y axis in distribution) |
|---|---|
| VPF, VPF-B, VPF-T, VRT, Connection Induced Interrupted Plays, Paused Time, Paused Ratio, Avg. Average Bitrate, Average Peak Bitrate, Bitrate Switches |
Ended Plays |
| Rebuffering Ratio, CIRR, Average Framerate | Plays |
For example, for VPF the secondary metric displays the number and percent of related ended plays impacted by the playback failures. The Unique Devices companion metric displays as the Unique Devices, devices related to the ended plays, and Impacted Unique Devices, devices related to the ended plays but also including devices from early exits and start failures. These device metrics help you analyze and compare the number and percent of devices impacted by the metric across all sessions versus the filtered sessions.
Note: You can switch between viewing the metrics as a numerical value or a percentage by using the toggle button.
In this example of metric filtering on VPF, secondary metric is Ended Plays and companion metric is Unique devices and Impacted Unique Devices with number and percent values.
| Column | Description |
|---|---|
| Ended Plays | The number of Ended Plays (from the Ended Plays metric widget) during the selected time period as the secondary metric. Compare with the metric filter version to determine the number of impacted ended plays. |
| [SF] Ended Plays |
The number of Ended Plays (based on the metric filter) during the selected time period for the filtered sessions as the filtered version of the secondary metric. Compare with the metric widget version to determine the number of impacted ended plays. |
| [SF] Ended Plays% |
The percentage of the impacted Ended Plays during the selected time period for the filtered sessions, enhancing the filtered version of the secondary metric. Shows the percent of the ended plays as [MF] ended plays. The Ended Plays secondary metric value for the selected time period is 115K. The number of ended plays impacted with the metric filter of VPF< 4 seconds is 22K Play, which accounts for 19.2% of the total Ended Plays. |
| Unique Devices |
The number of unique devices (based on ended plays) during the selected time period (matching the Unique Devices metric widget) as the companion metric. Compare with the metric filter version to determine the number of impacted unique devices. |
| [SF] Unique Devices |
The number of Unique Devices (based on the metric filter) during the selected time period for the filtered sessions as the filtered version of the secondary metric. Impacted unique devices includes devices for the ended plays along with early exits and startup failures. |
| [SF] Unique Devices% |
The percentage of the impacted Unique Devices (based on the metric filter) during the selected time period for the filtered sessions, enhancing the filtered version of the companion metric. Impacted unique devices includes devices for the ended plays along with early exits and startup failures. The devices shown in the example indicate the Apple iPhone is a high impacted device with the metric filter setting for less than 4 seconds of VPF. The Unique Devices companion metric shows the values of 46.2K total unique devices with ended plays, and 10.4K devices as impacted unique devices, which accounts for 22.6% of the total unique devices. |
Based on the metric filter settings, the Apple iPhone experiences a considerable amount of playback failures that could impact a large number of unique devices. Hence, it may be wise to closely monitor this device as you work to address the issue, as its users are heavily impacted.
Note: When applying metric-level filters to startup metrics, the system excludes interval and playback metrics from the results. Similarly, when applying metric-level filters to playback metrics, the system excludes metrics from other categories. In such cases, the system returns an empty dataset as expected.
 Secondary Filter Examples
Use secondary filters along with the displayed secondary and companion metrics to analyze which dimensions are associated with performance behaviors, such sessions with high rebuffering and high bitrate (likely ABR issues), video start failure business errors by geo location, and high rates of session failure error codes associated with specific device operating systems.
Secondary filters with the displayed secondary and companion metrics can also help isolate the dimensions associated with Streaming Performance Index (SPI) changes. Often, the highest and lowest SPI scores highlight the impacting dimensions. In other cases, combining SPI score and the number/percentage of impacted sessions and unique devices can help determine which dimensions have the highest performance impact.
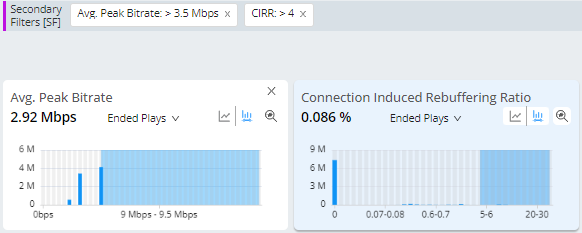
ABR Functionality Check
Check for sessions with high CIRR on devices that didn’t switch to lower bitrates. Highlights ABR functionality issues when players didn’t switch to lower bitrates when high rebuffering occurred.
Metrics: Average Peak Bitrate, CIRR
Metric Filters: High Average Peak Bitrate > lowest ABR setting, CIRR >= High Rebuffering

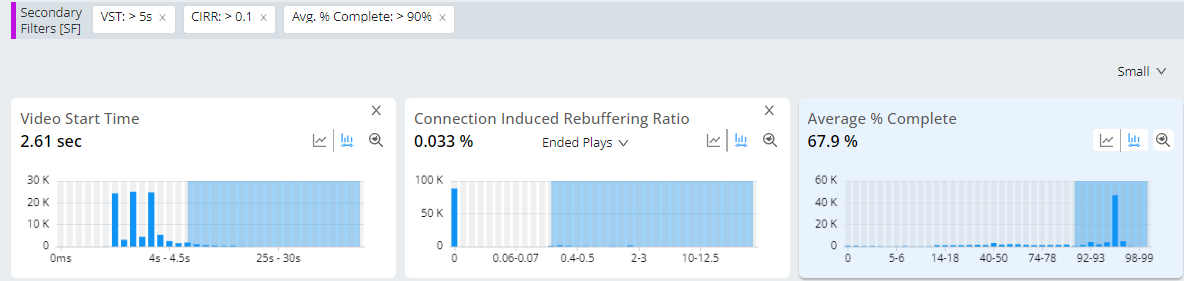
Long Video Startup Times, High CIRR, High Avg % Complete
Check for sessions with viewers that tolerated long video startup times and CIRR. Supports identifying highest and least motivated viewers willing to tolerant long wait times and high CIRR, but still watched most of the video.
Metrics: VST, CIRR (or High Rebuffering), Avg % Complete
Metric Filters: VST>= 5 seconds, CIRR >= 0.1%, Avg % Complete > 90%

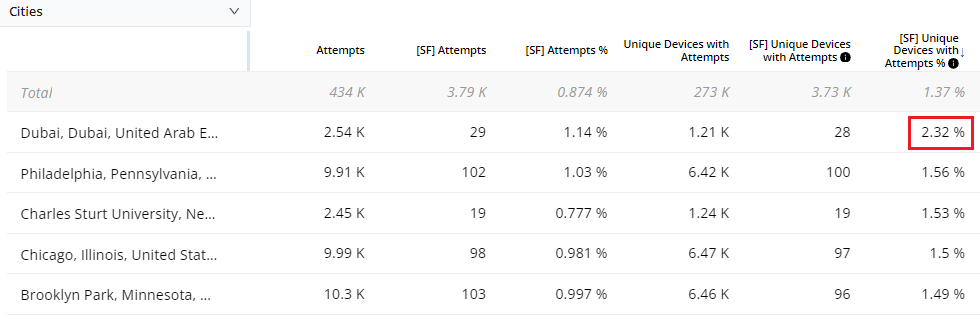
Video Start Failure-Business After 400ms Due to Content Not Available Across Cities
Discover the geo which had the highest percent of VSF-B issues after a set time due the a specific error.
Metrics: VSF-B
Metric Filter: VSF-B =< 400ms, VSF-B Error Due to Content Unavailable

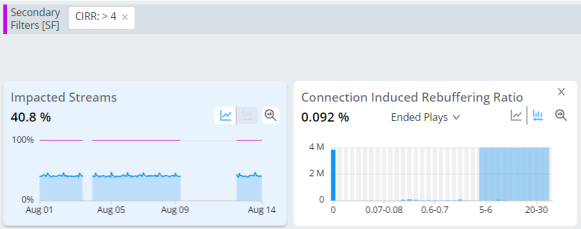
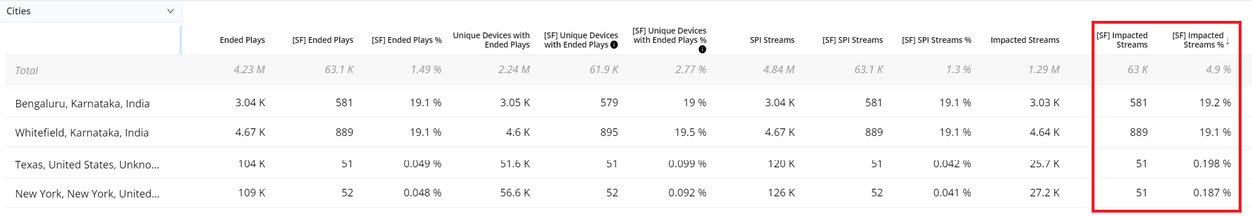
Secondary Filter with Impacted Streams
Add Impacted Streams metric to the dimension analysis to highlight the number and percentage of streams with performance impacted by the secondary filter settings, in this example CIRR > 4%.
Metrics: CIRR, Impacted Streams
Metric Filter: CIRR > 4%
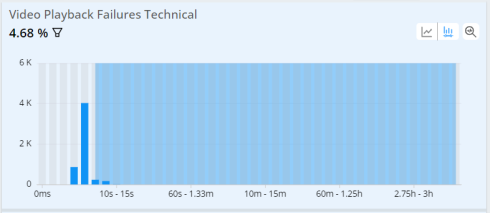
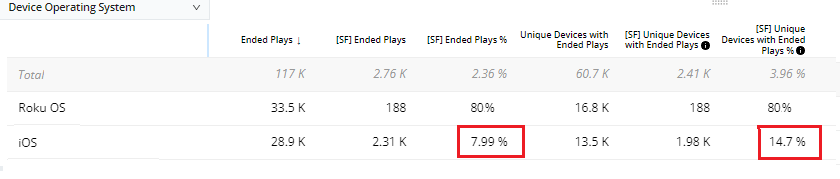
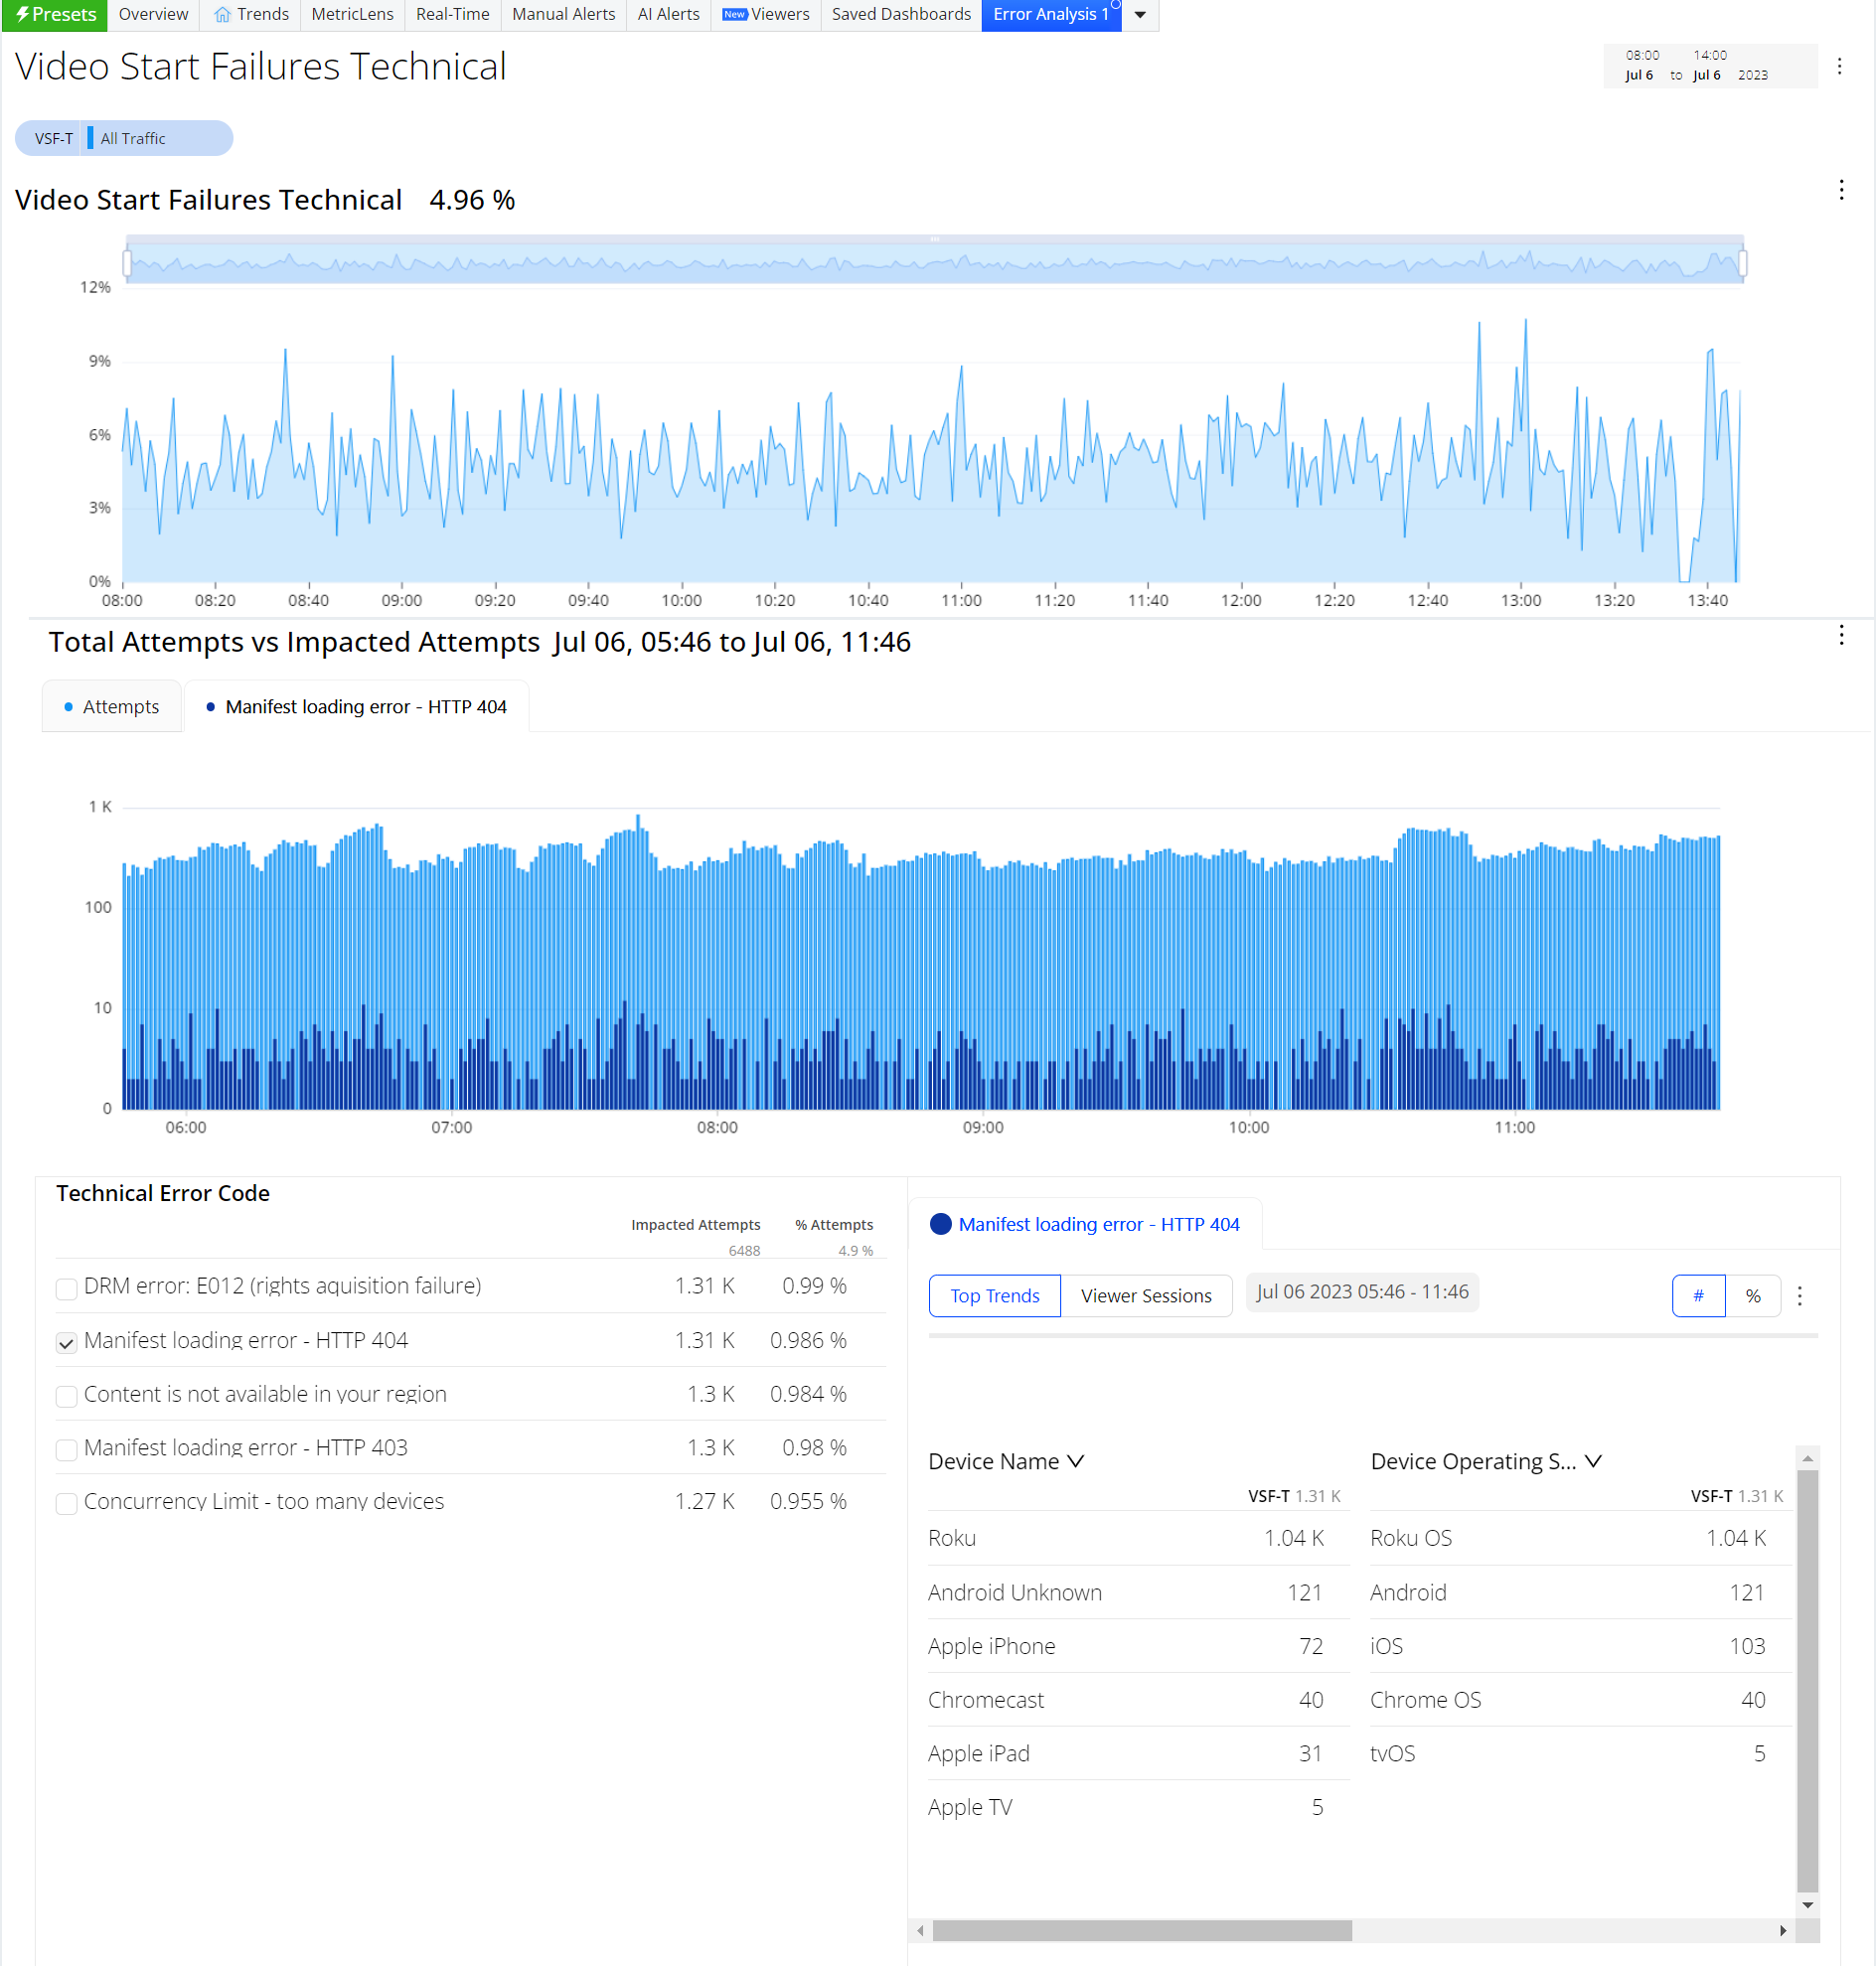
Improved VSF/VPF Error Code Diagnostics with Analysis Across Impacted Devices and Sessions
Previous error code diagnostics was limited to only device analysis, so if an error occurred on 80% of Roku devices, Roku devices appeared associated with the cause of the error. Applying a Secondary Filter (SF), for example VPF-T > 4 seconds, displays the percentage of errors by ended plays for both sessions and devices. The difference in error distribution across devices and sessions indicates how much of the error is associated with the device. In this case, 80% of the Roku sessions and 80% of the Roku devices were impacted, a balanced occurrence across devices and traffic.
However with iOS, the error rate was 7.99% of the sessions and 14.7% of SF unique devices, indicating an association of the device with increased VPF-T error rates.
Quick Error Filtering
To provide a better error code analysis, Quick Error Filtering in Trends allows applying a single-click secondary filter for one or more error codes. This functionality enhances the impact measurement and facilitates a quick understanding of the dimension with a higher value for a given error. For instance, it allows users to easily identify the impacted unique devices affected by a specific error.
To apply error filtering,
-
Select the VSF or VPF metric (Tech and Business)
-
Click one or more error codes on Technical Error Code dimension data.
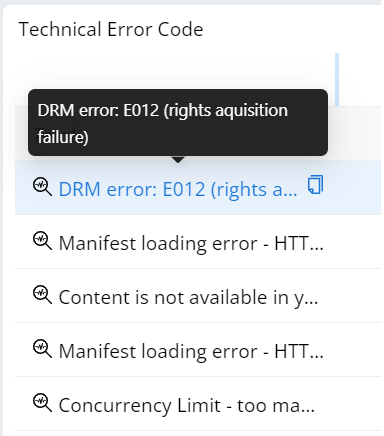
A secondary filter is applied and the secondary Unique Devices metric is displayed.
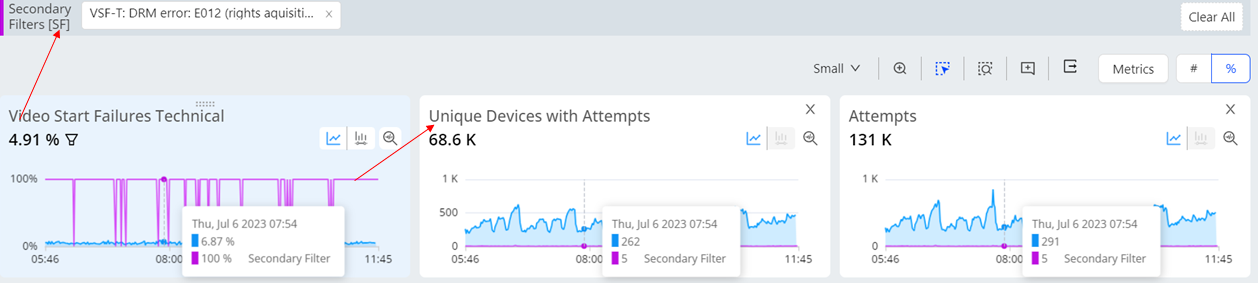
The dimension data is updated based on the filter applied.
-
Click the Old Error diagnostics icon to see the error diagnostics dashboard.

-
Check the details to analyze the data on the error diagnostics dashboard.
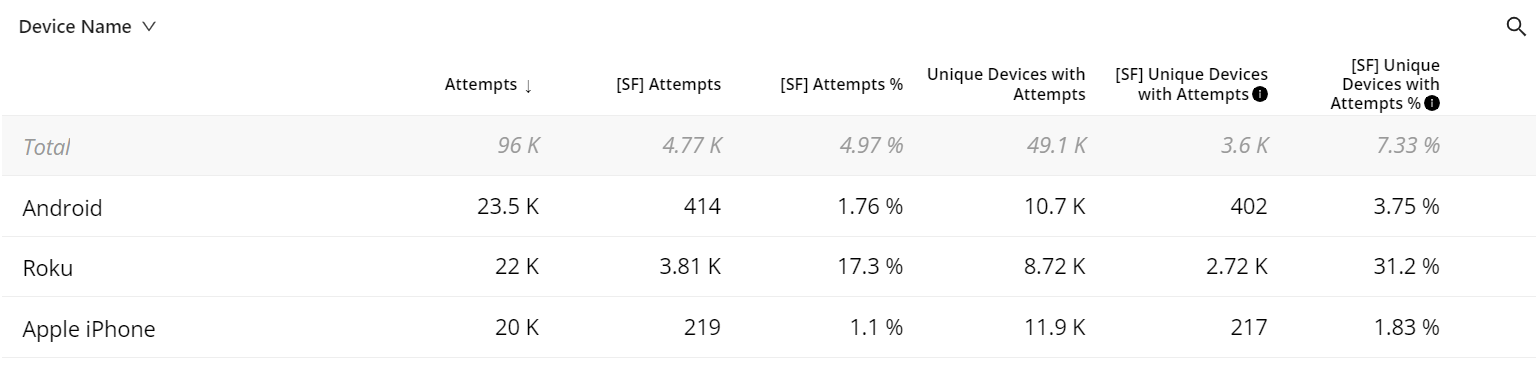
Quick Boolean Filter
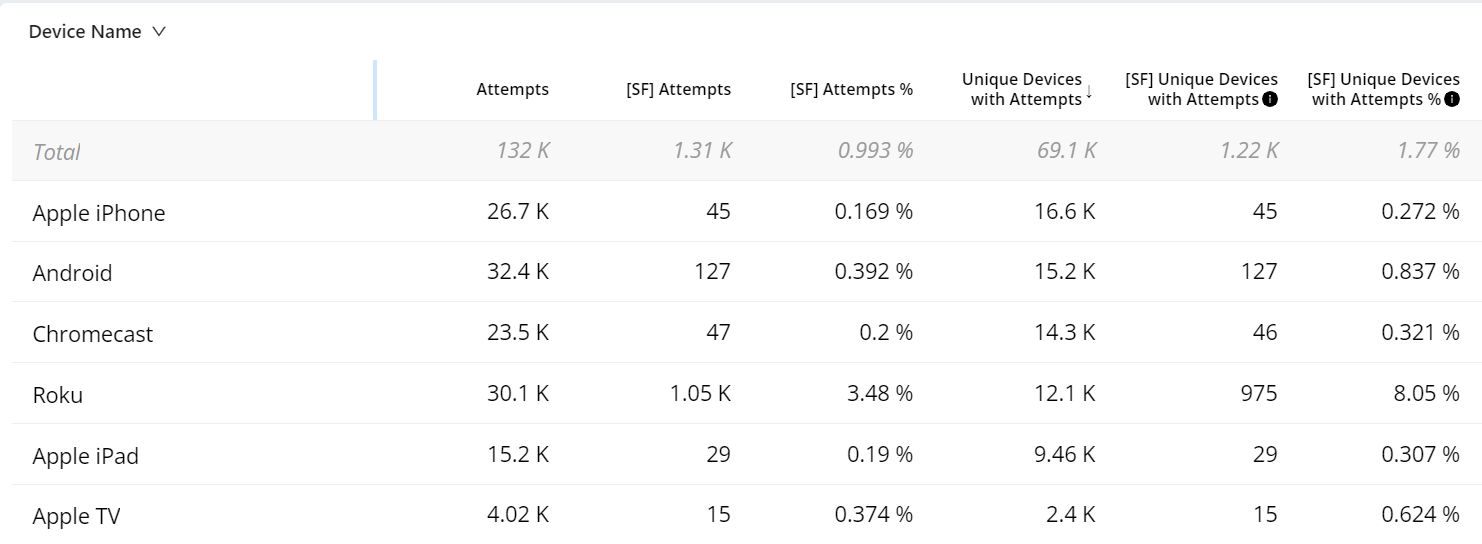
In order to obtain the number of unique devices that have VSF-T or VPF-T for a specific device, geo, or any other metadata cohort, trends enable you to apply a single click secondary filter on all VSF-T/VPF-T and automatically include the [SF] Unique Devices column in the Dimension table, along with the corresponding percentage column.
To apply the Boolean filter
-
Click the Error filter icon on the metric widget.
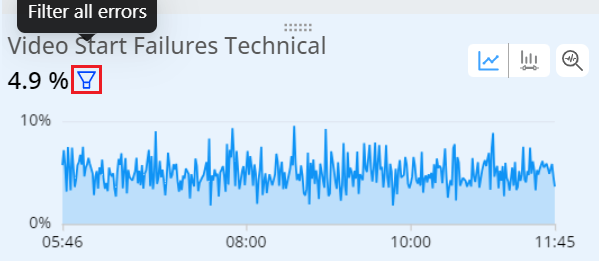
Secondary Boolean filter is applied for the metric.
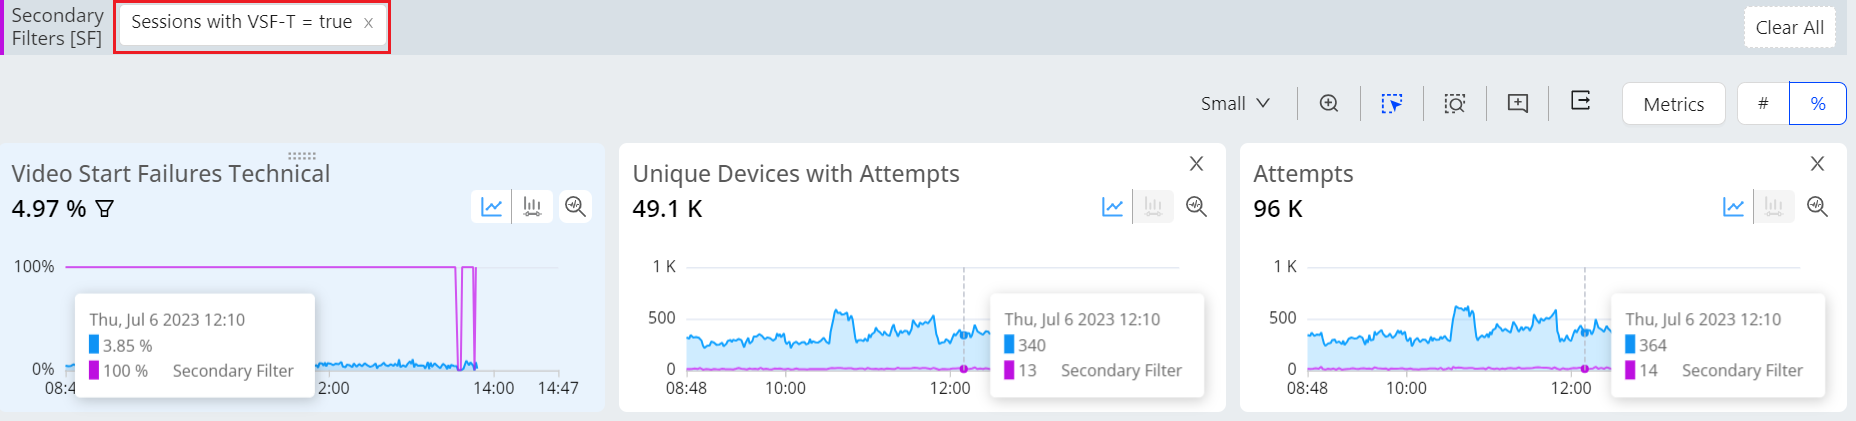
[SF] Unique Devices column is added in the dimension table.
You can do the error code diagnostics within Trends which is more flexible.
Filtering Filters Filtering Filters Filtering Filters Secondary Filters Secondary Filters Secondary Filters Compare Filtering