Issue Resolutions (TechOps)


With Video, TechOps and others can easily perform issue resolutions and continuous improvements, monitoring overall operational performance metrics, drilling-down to discover impacted dimension entities, and analyzing impacted session timelines and viewer experiences. All these diagnostics and operational capabilities are available for historical and real-time data, across customizable levels of granularity (1 minute to 1 month).


Tech Ops Features Description

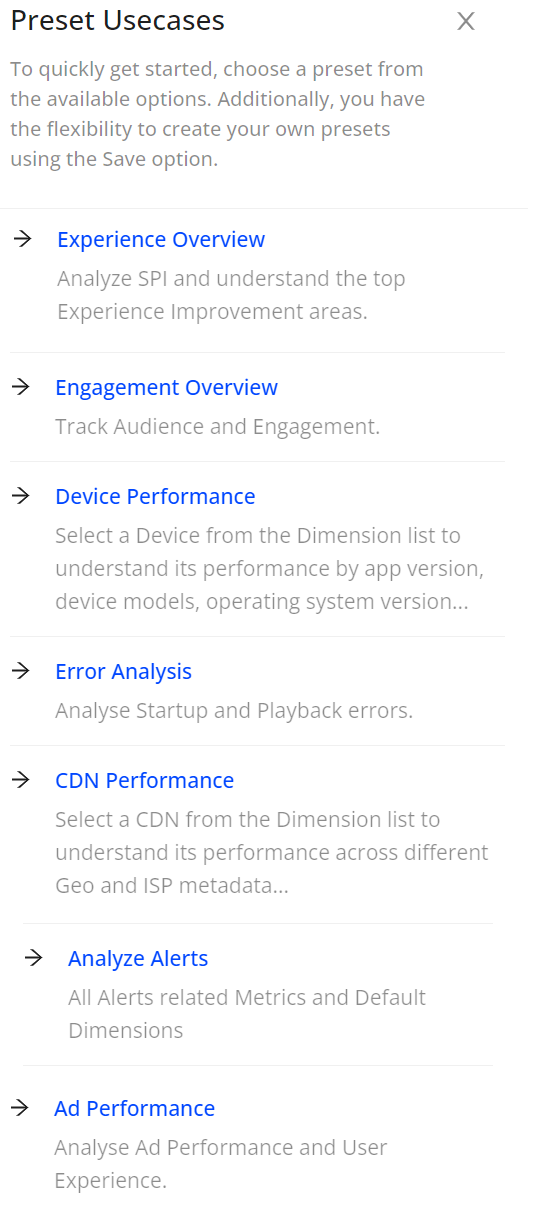
Presets

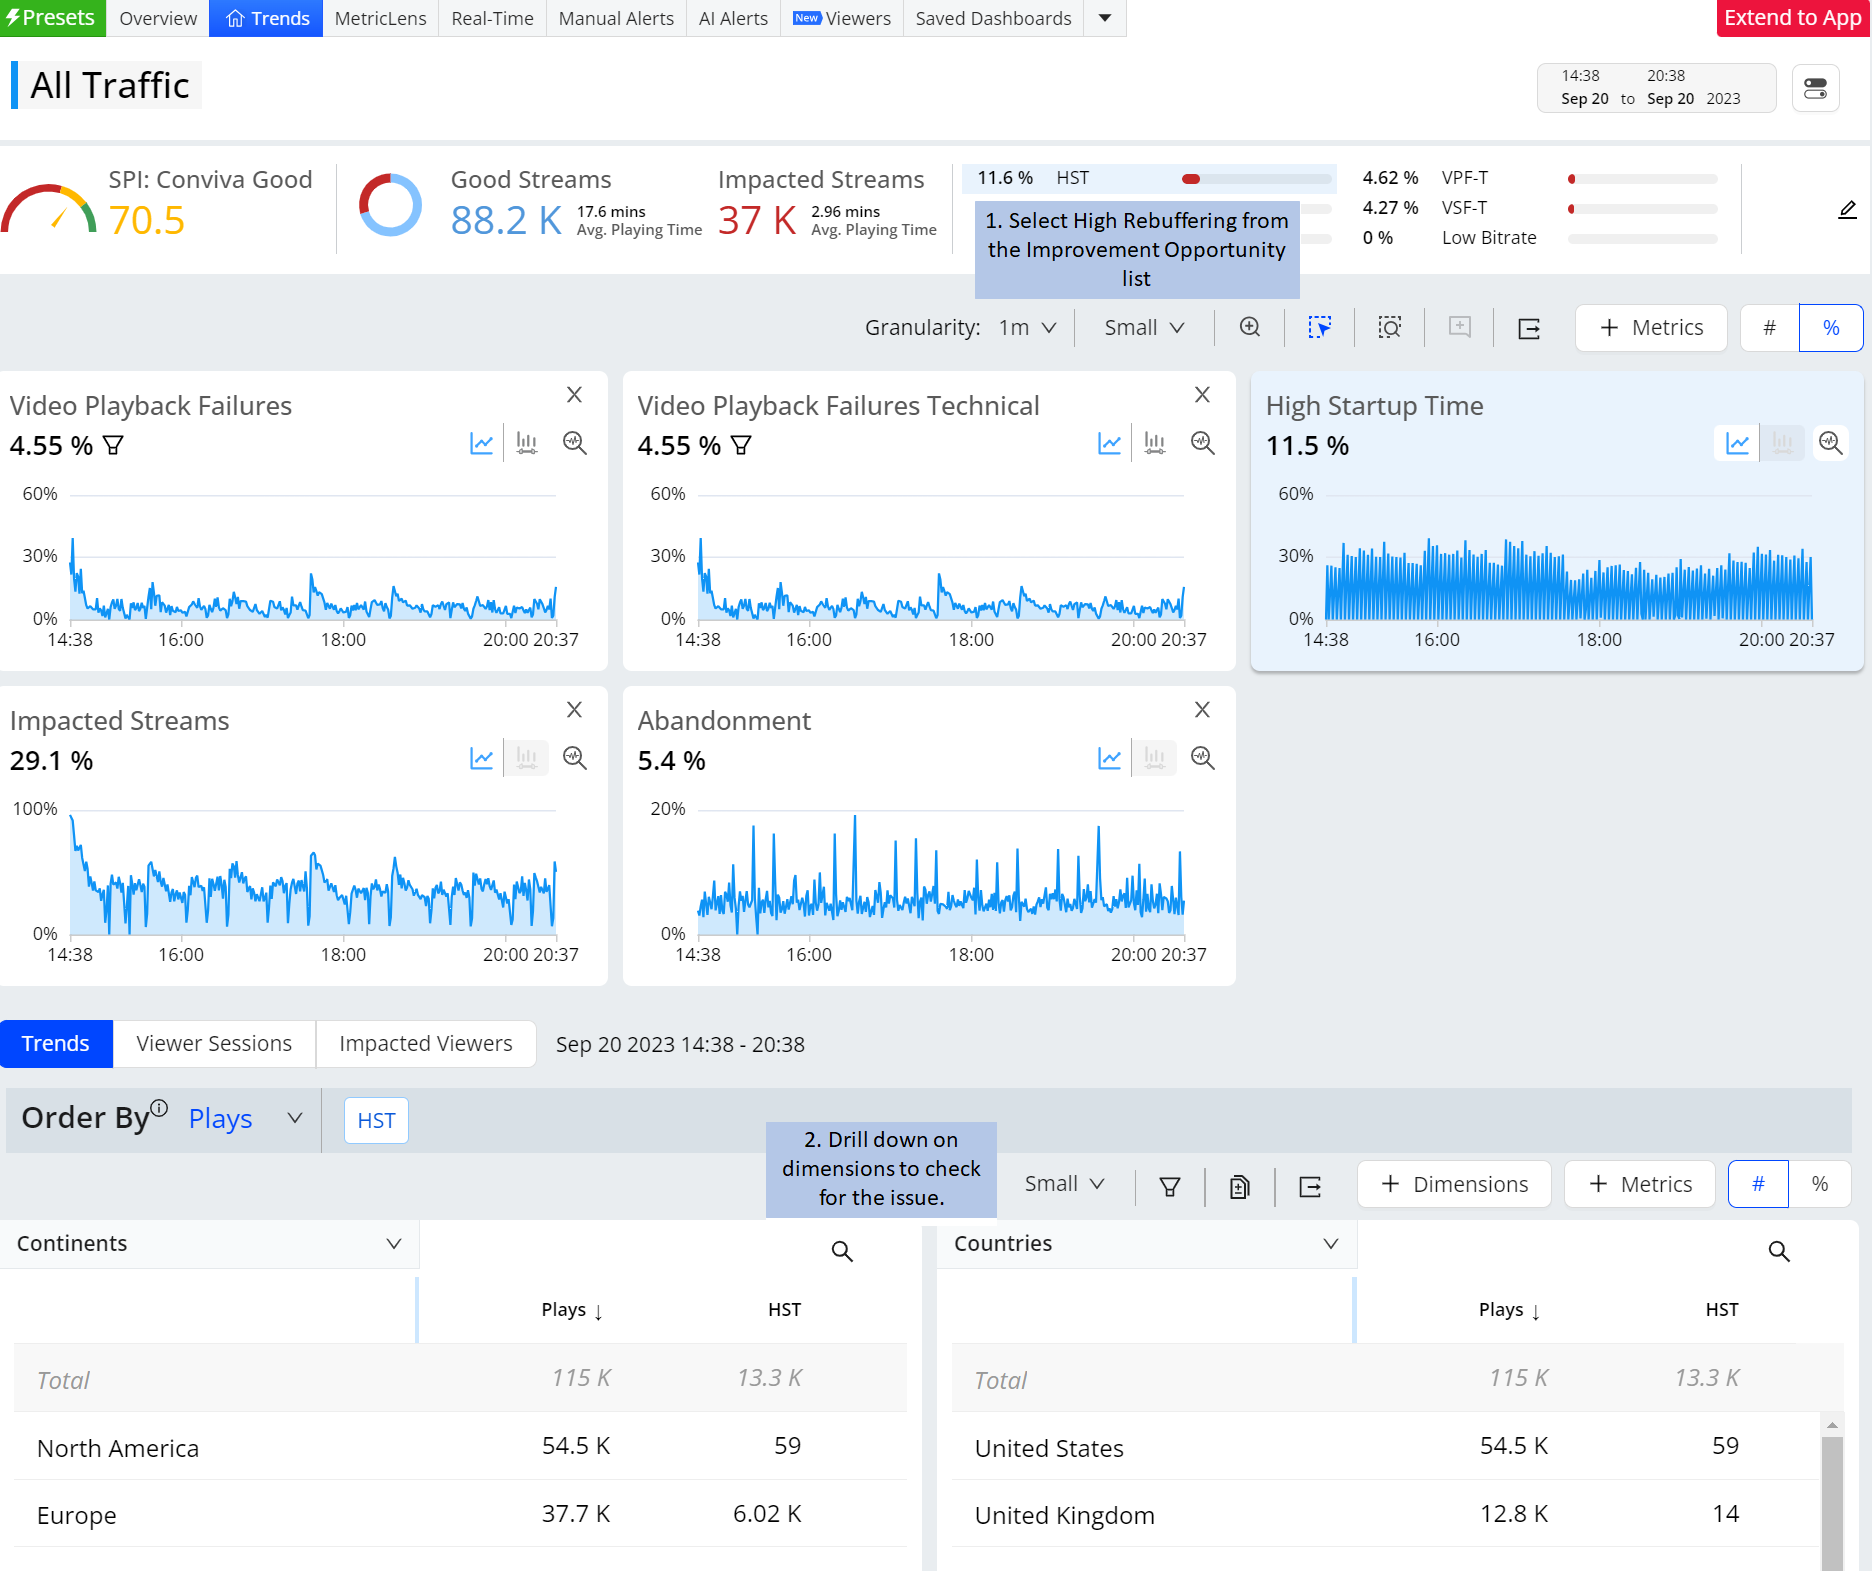
Access Pulse: Trends.

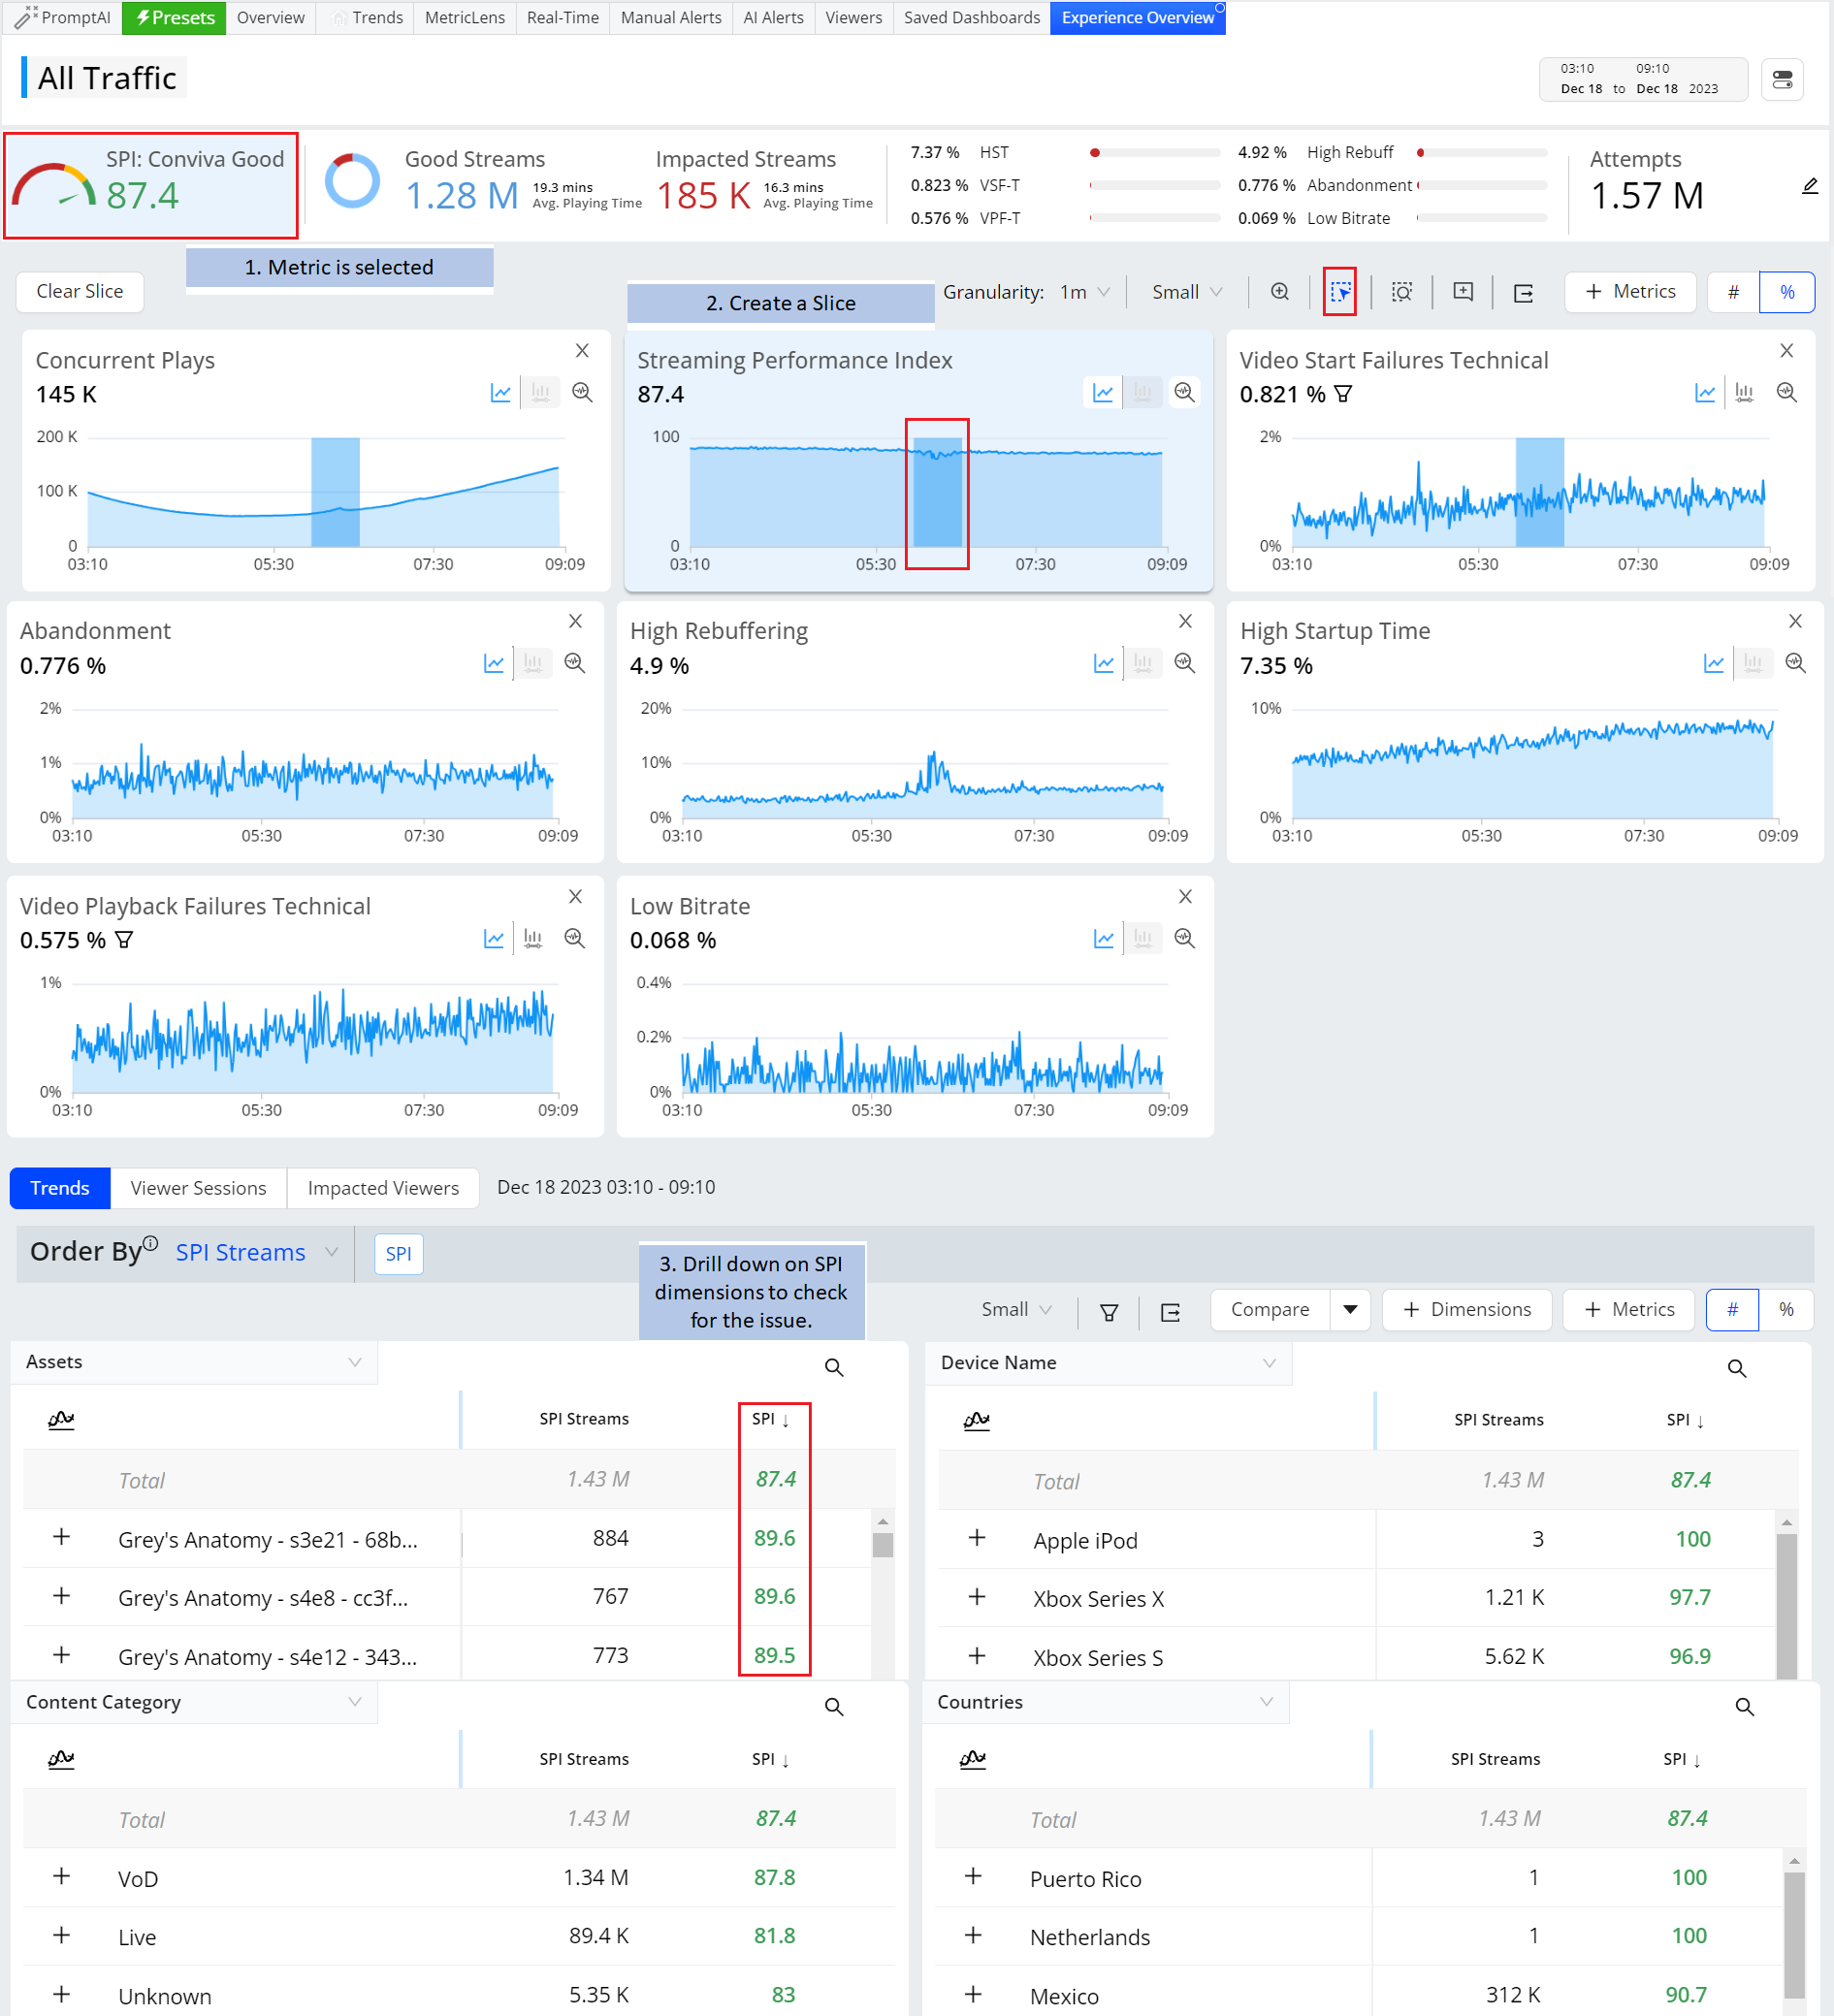
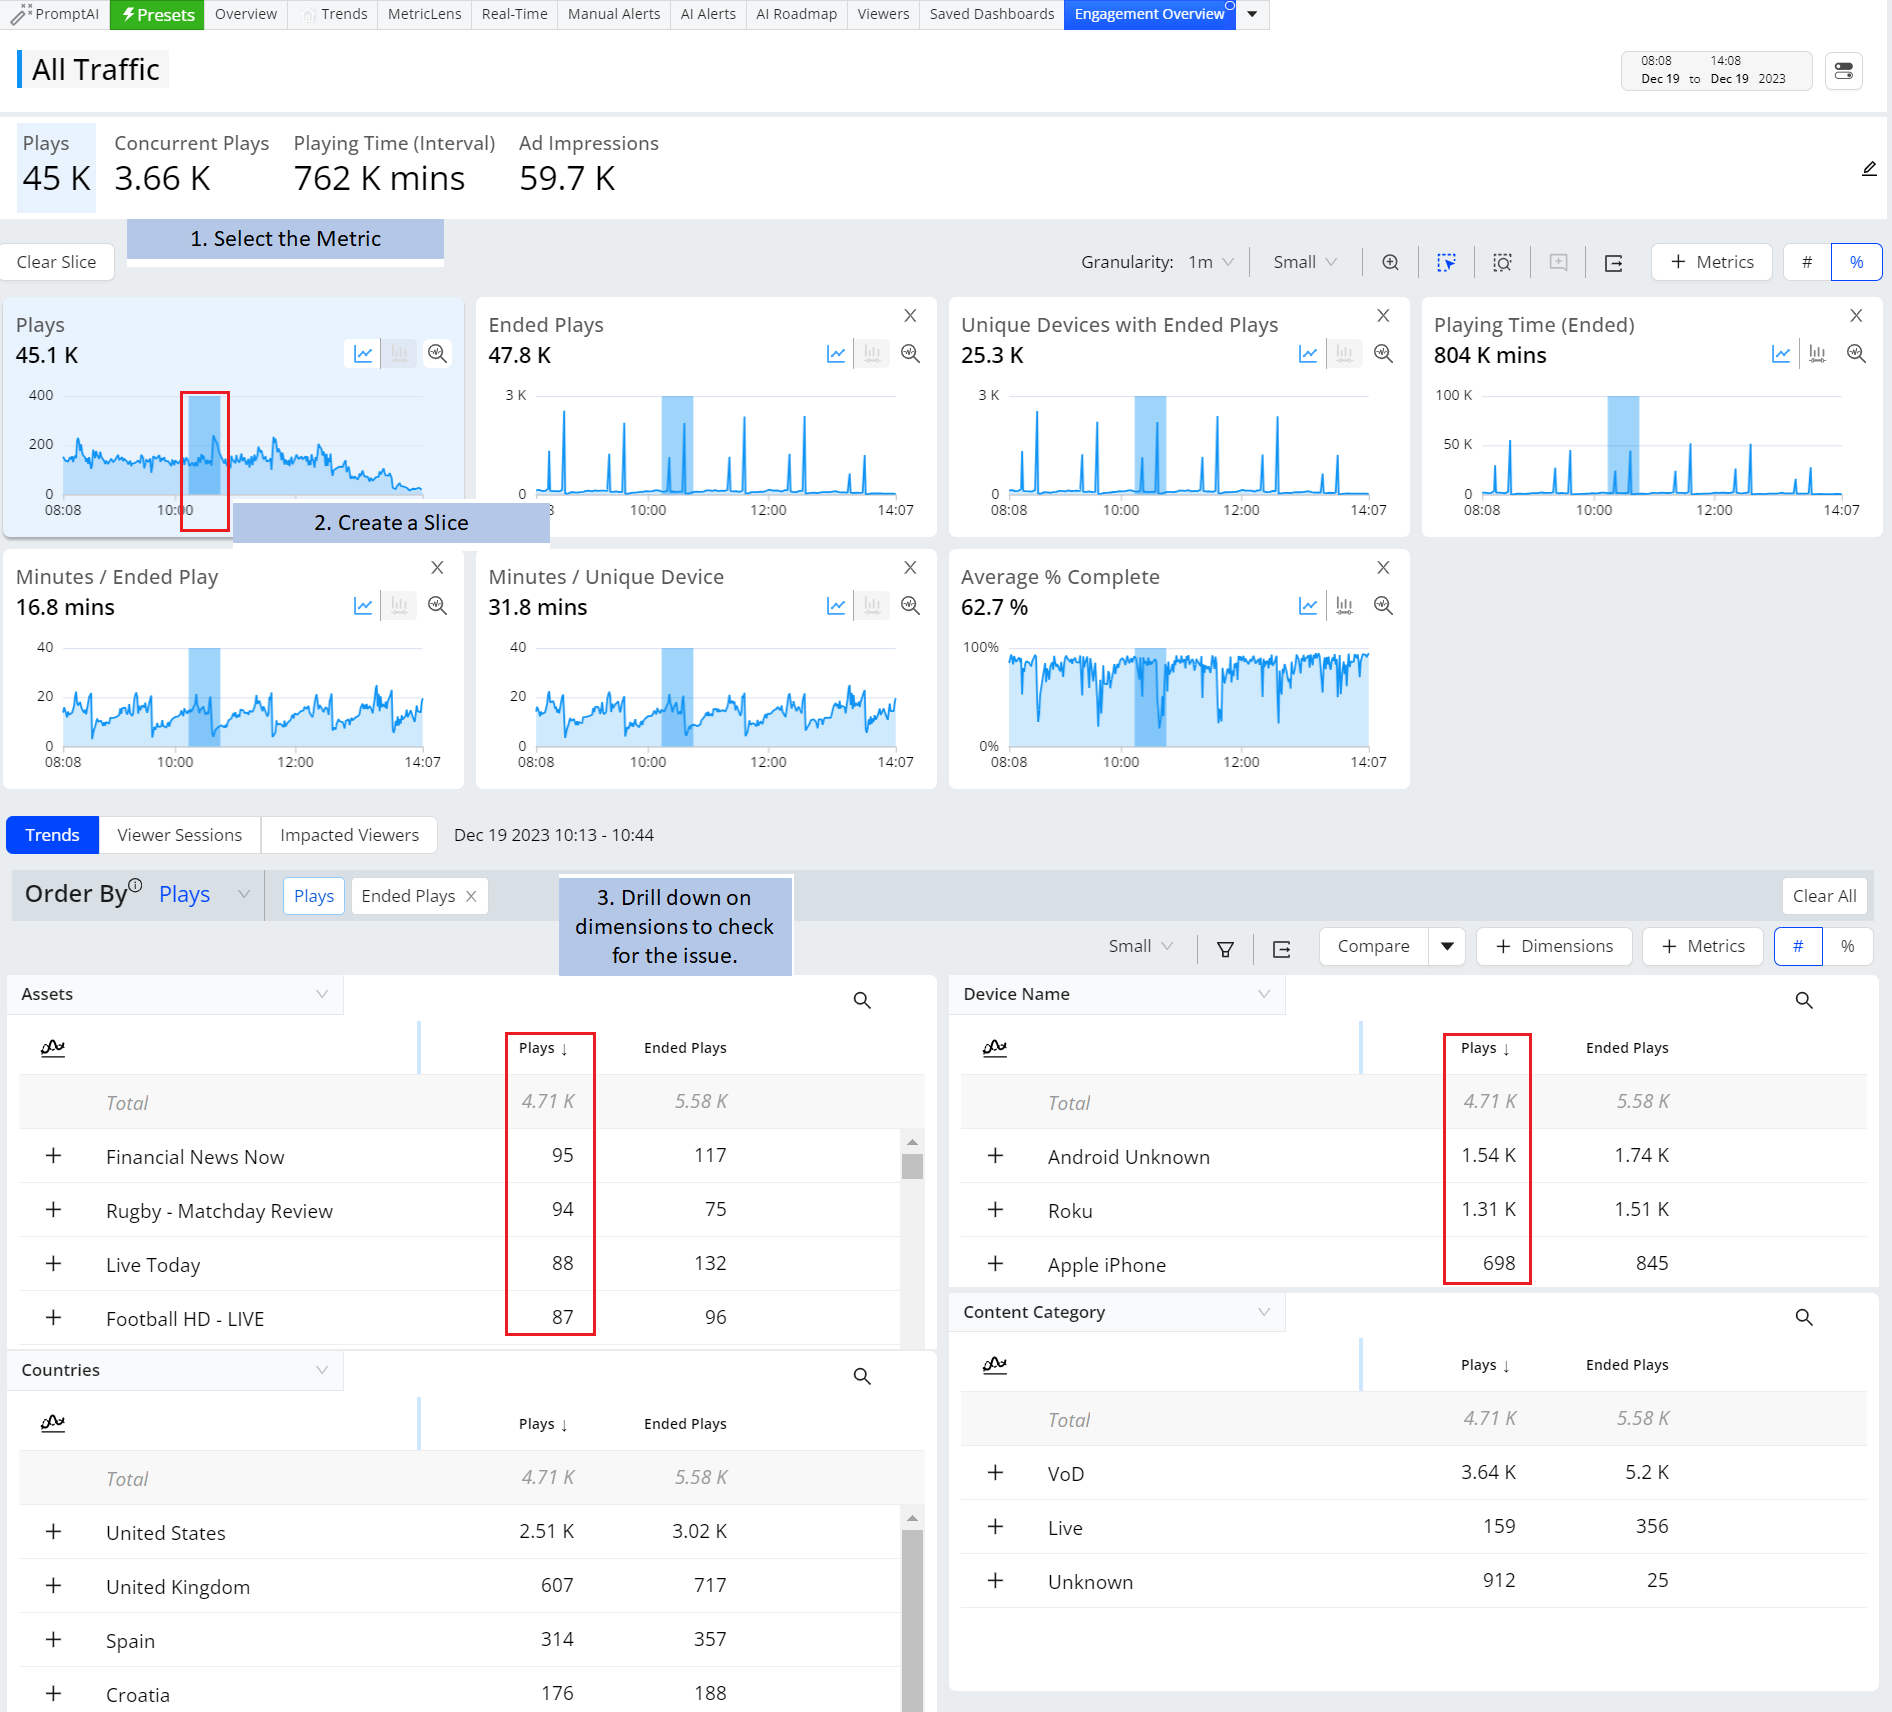
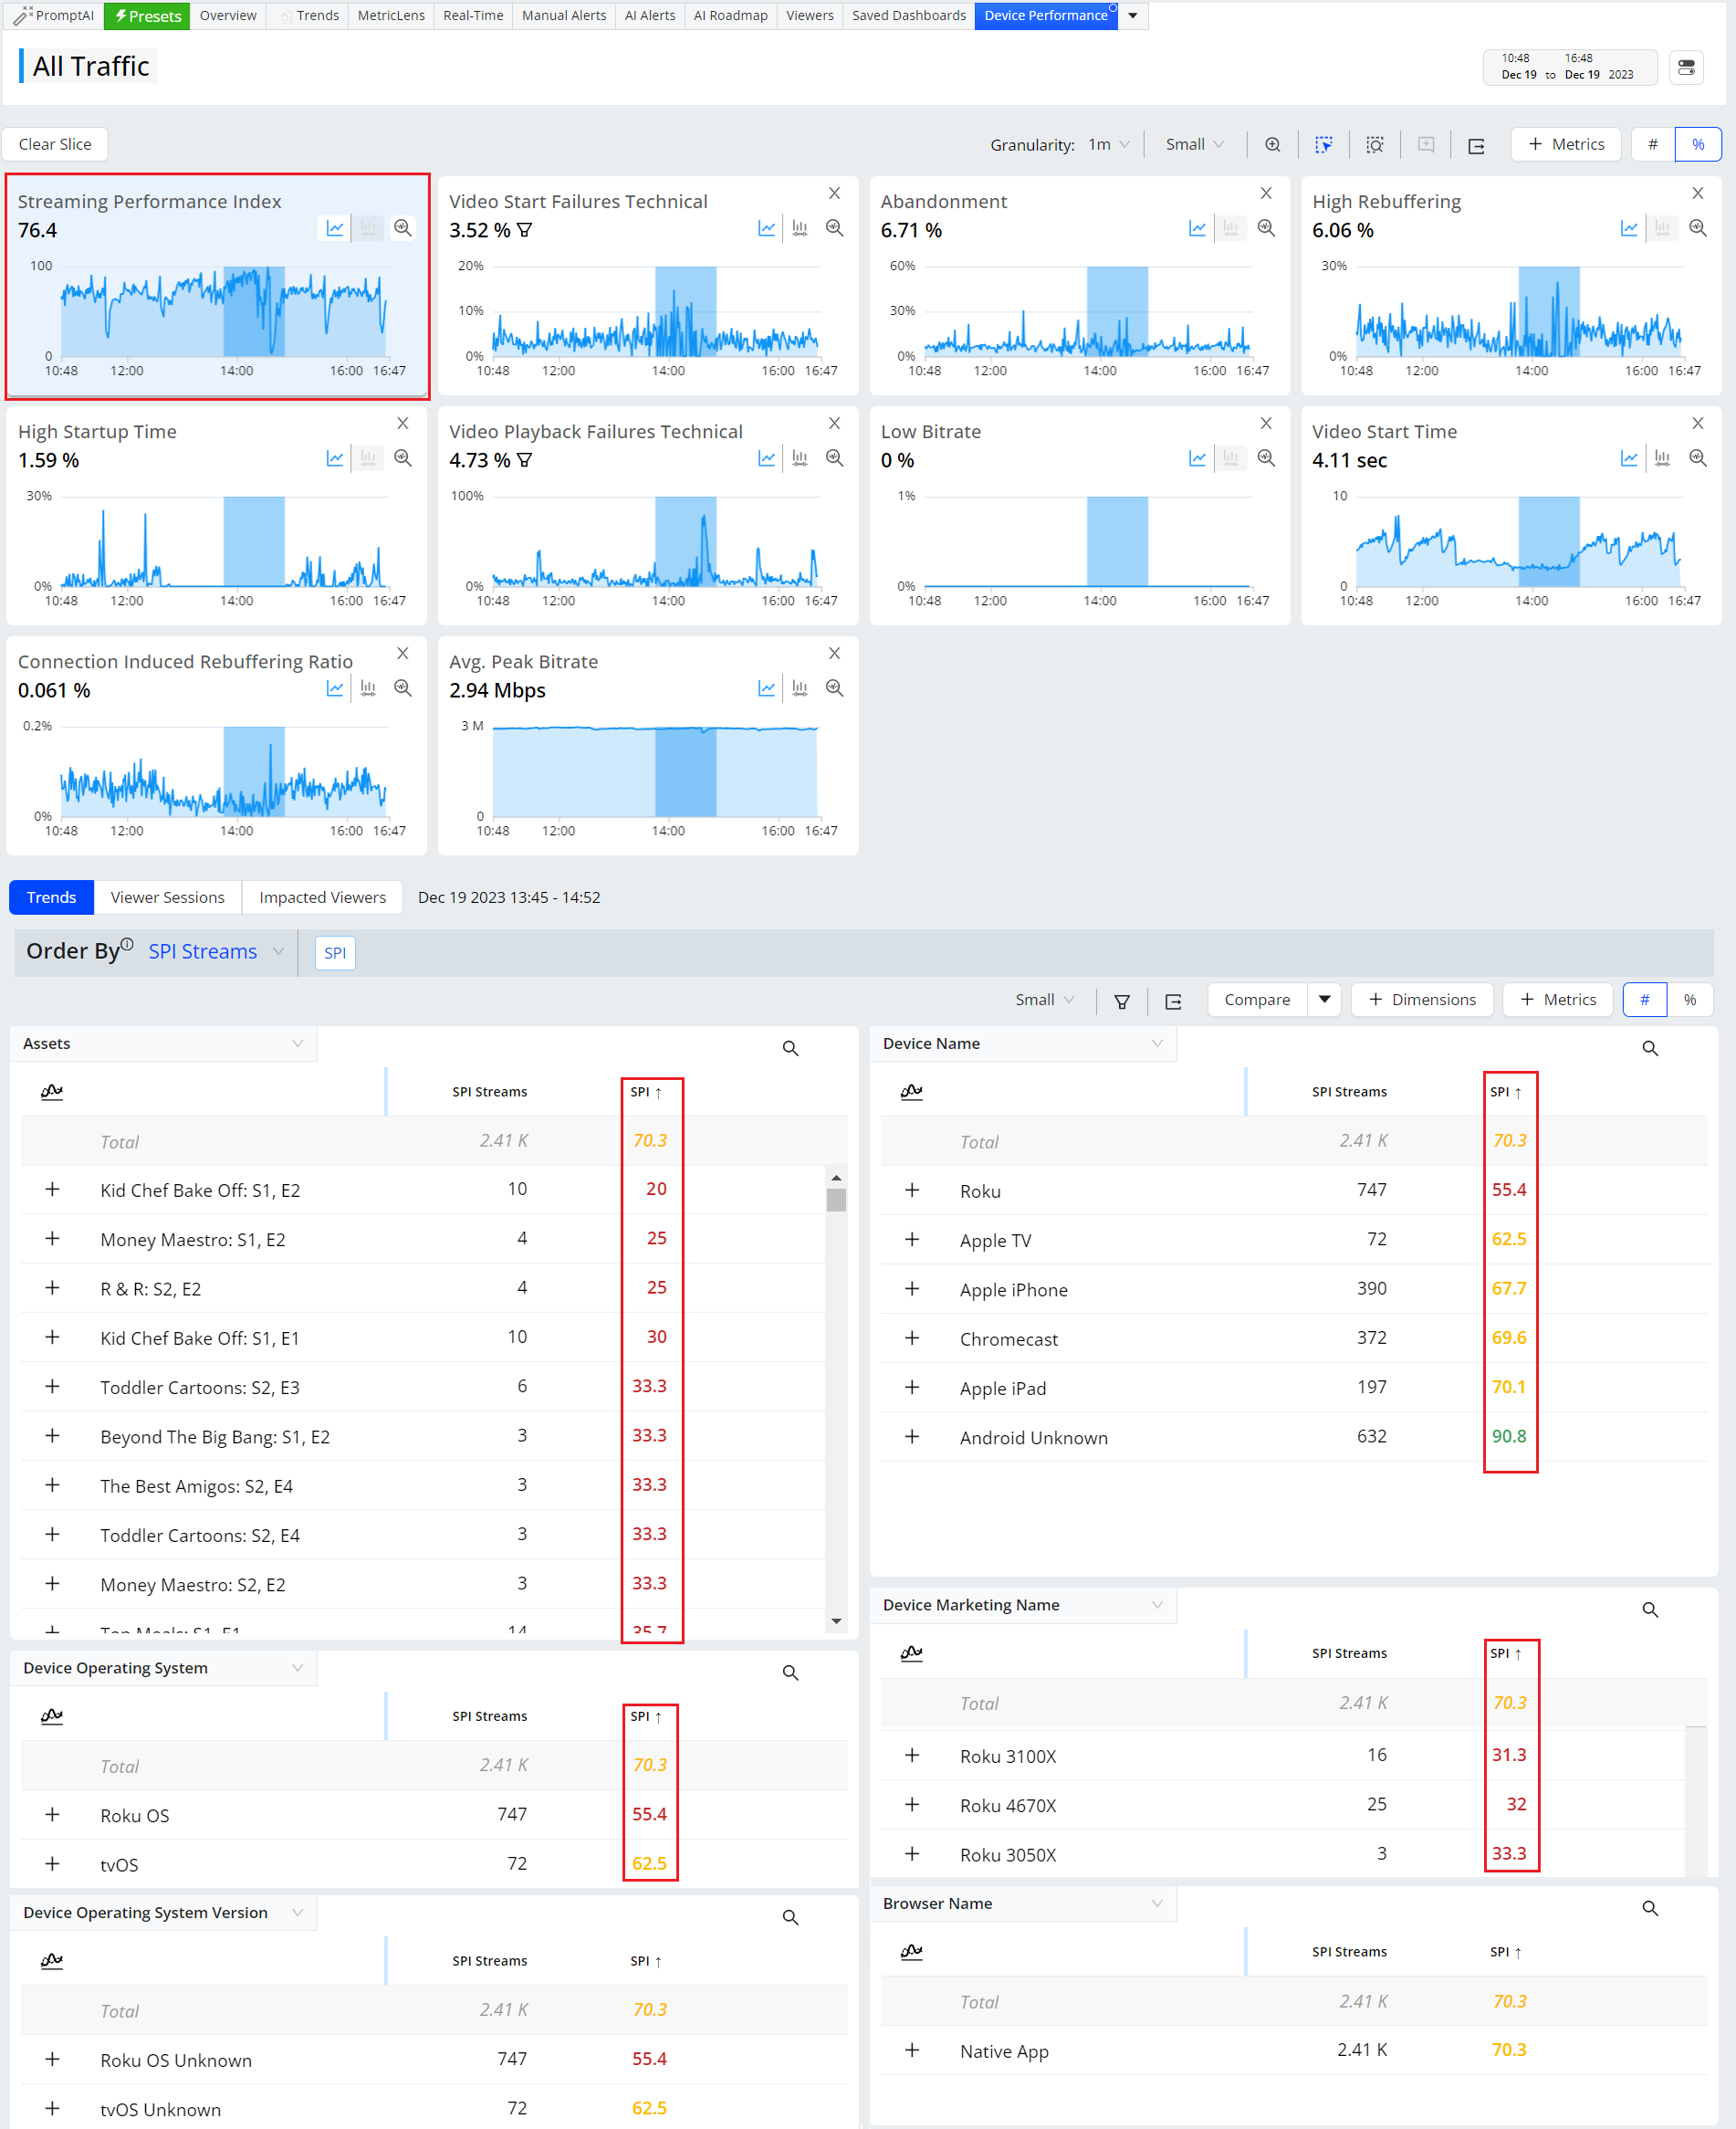
Starting with viewer experience and engagement overviews, quickly monitor performance levels and impacts across your video ecosystem:

Experience Overview

Engagement Overview

Device Performance


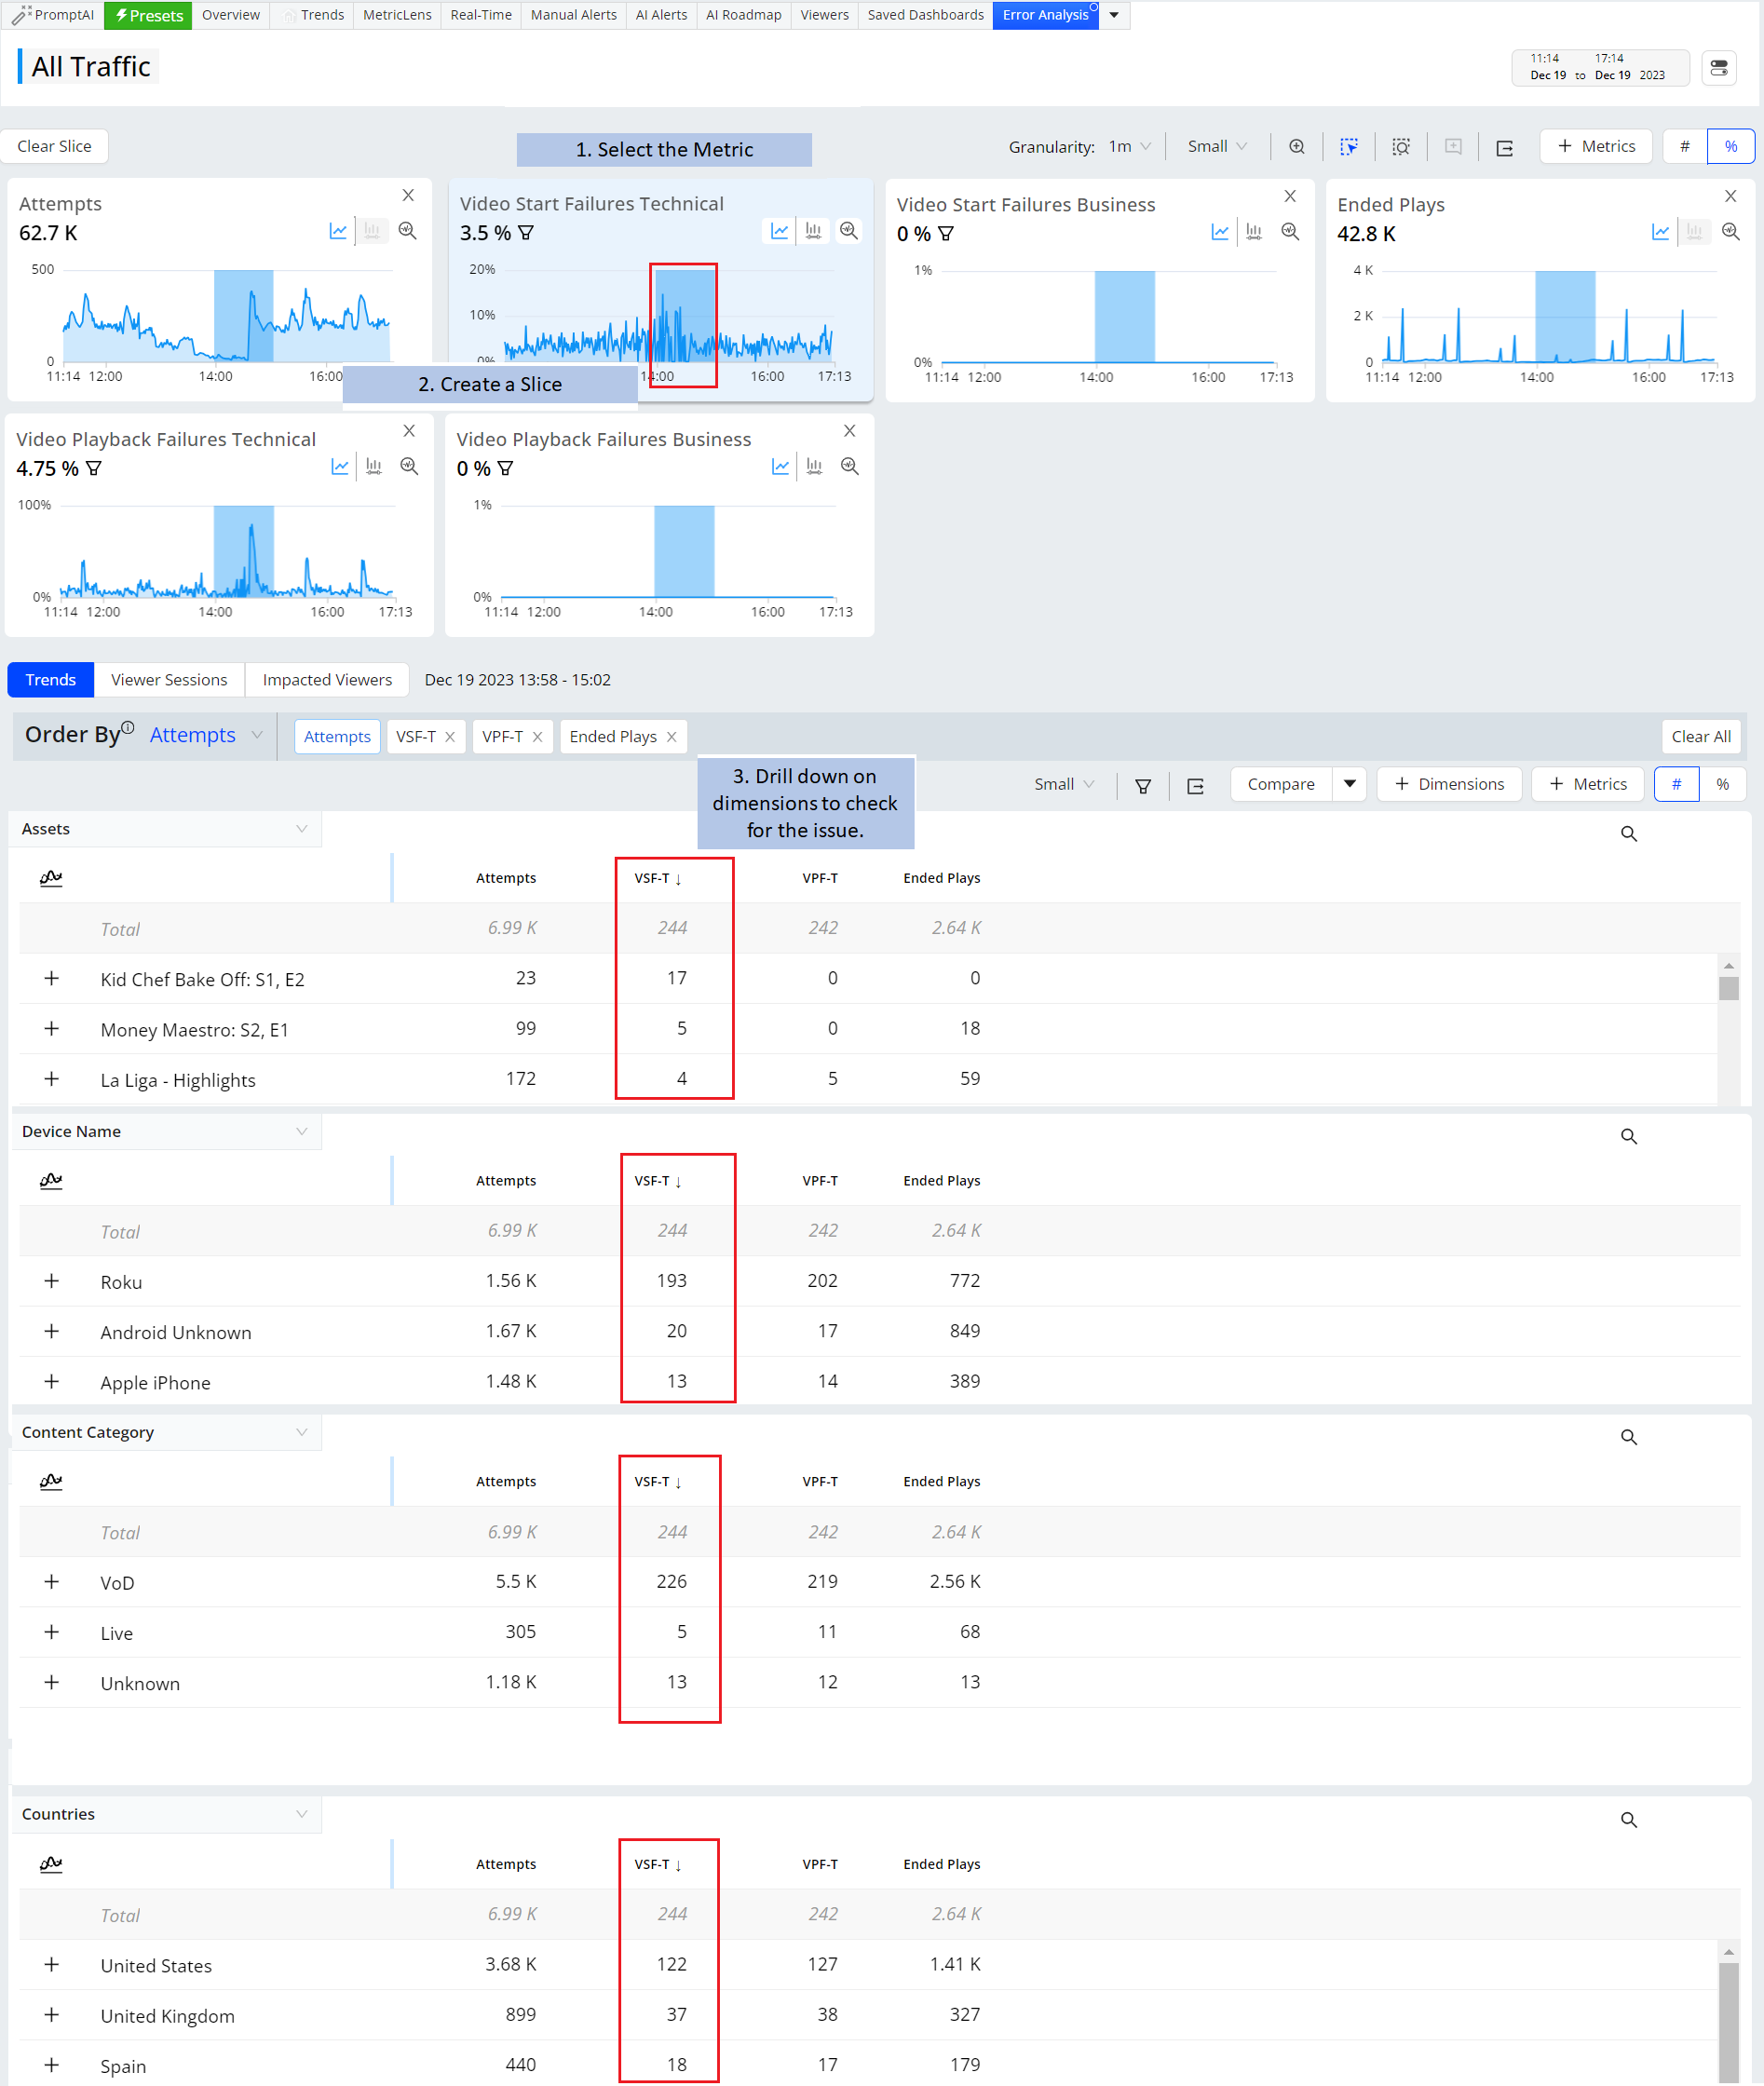
Error Analysis

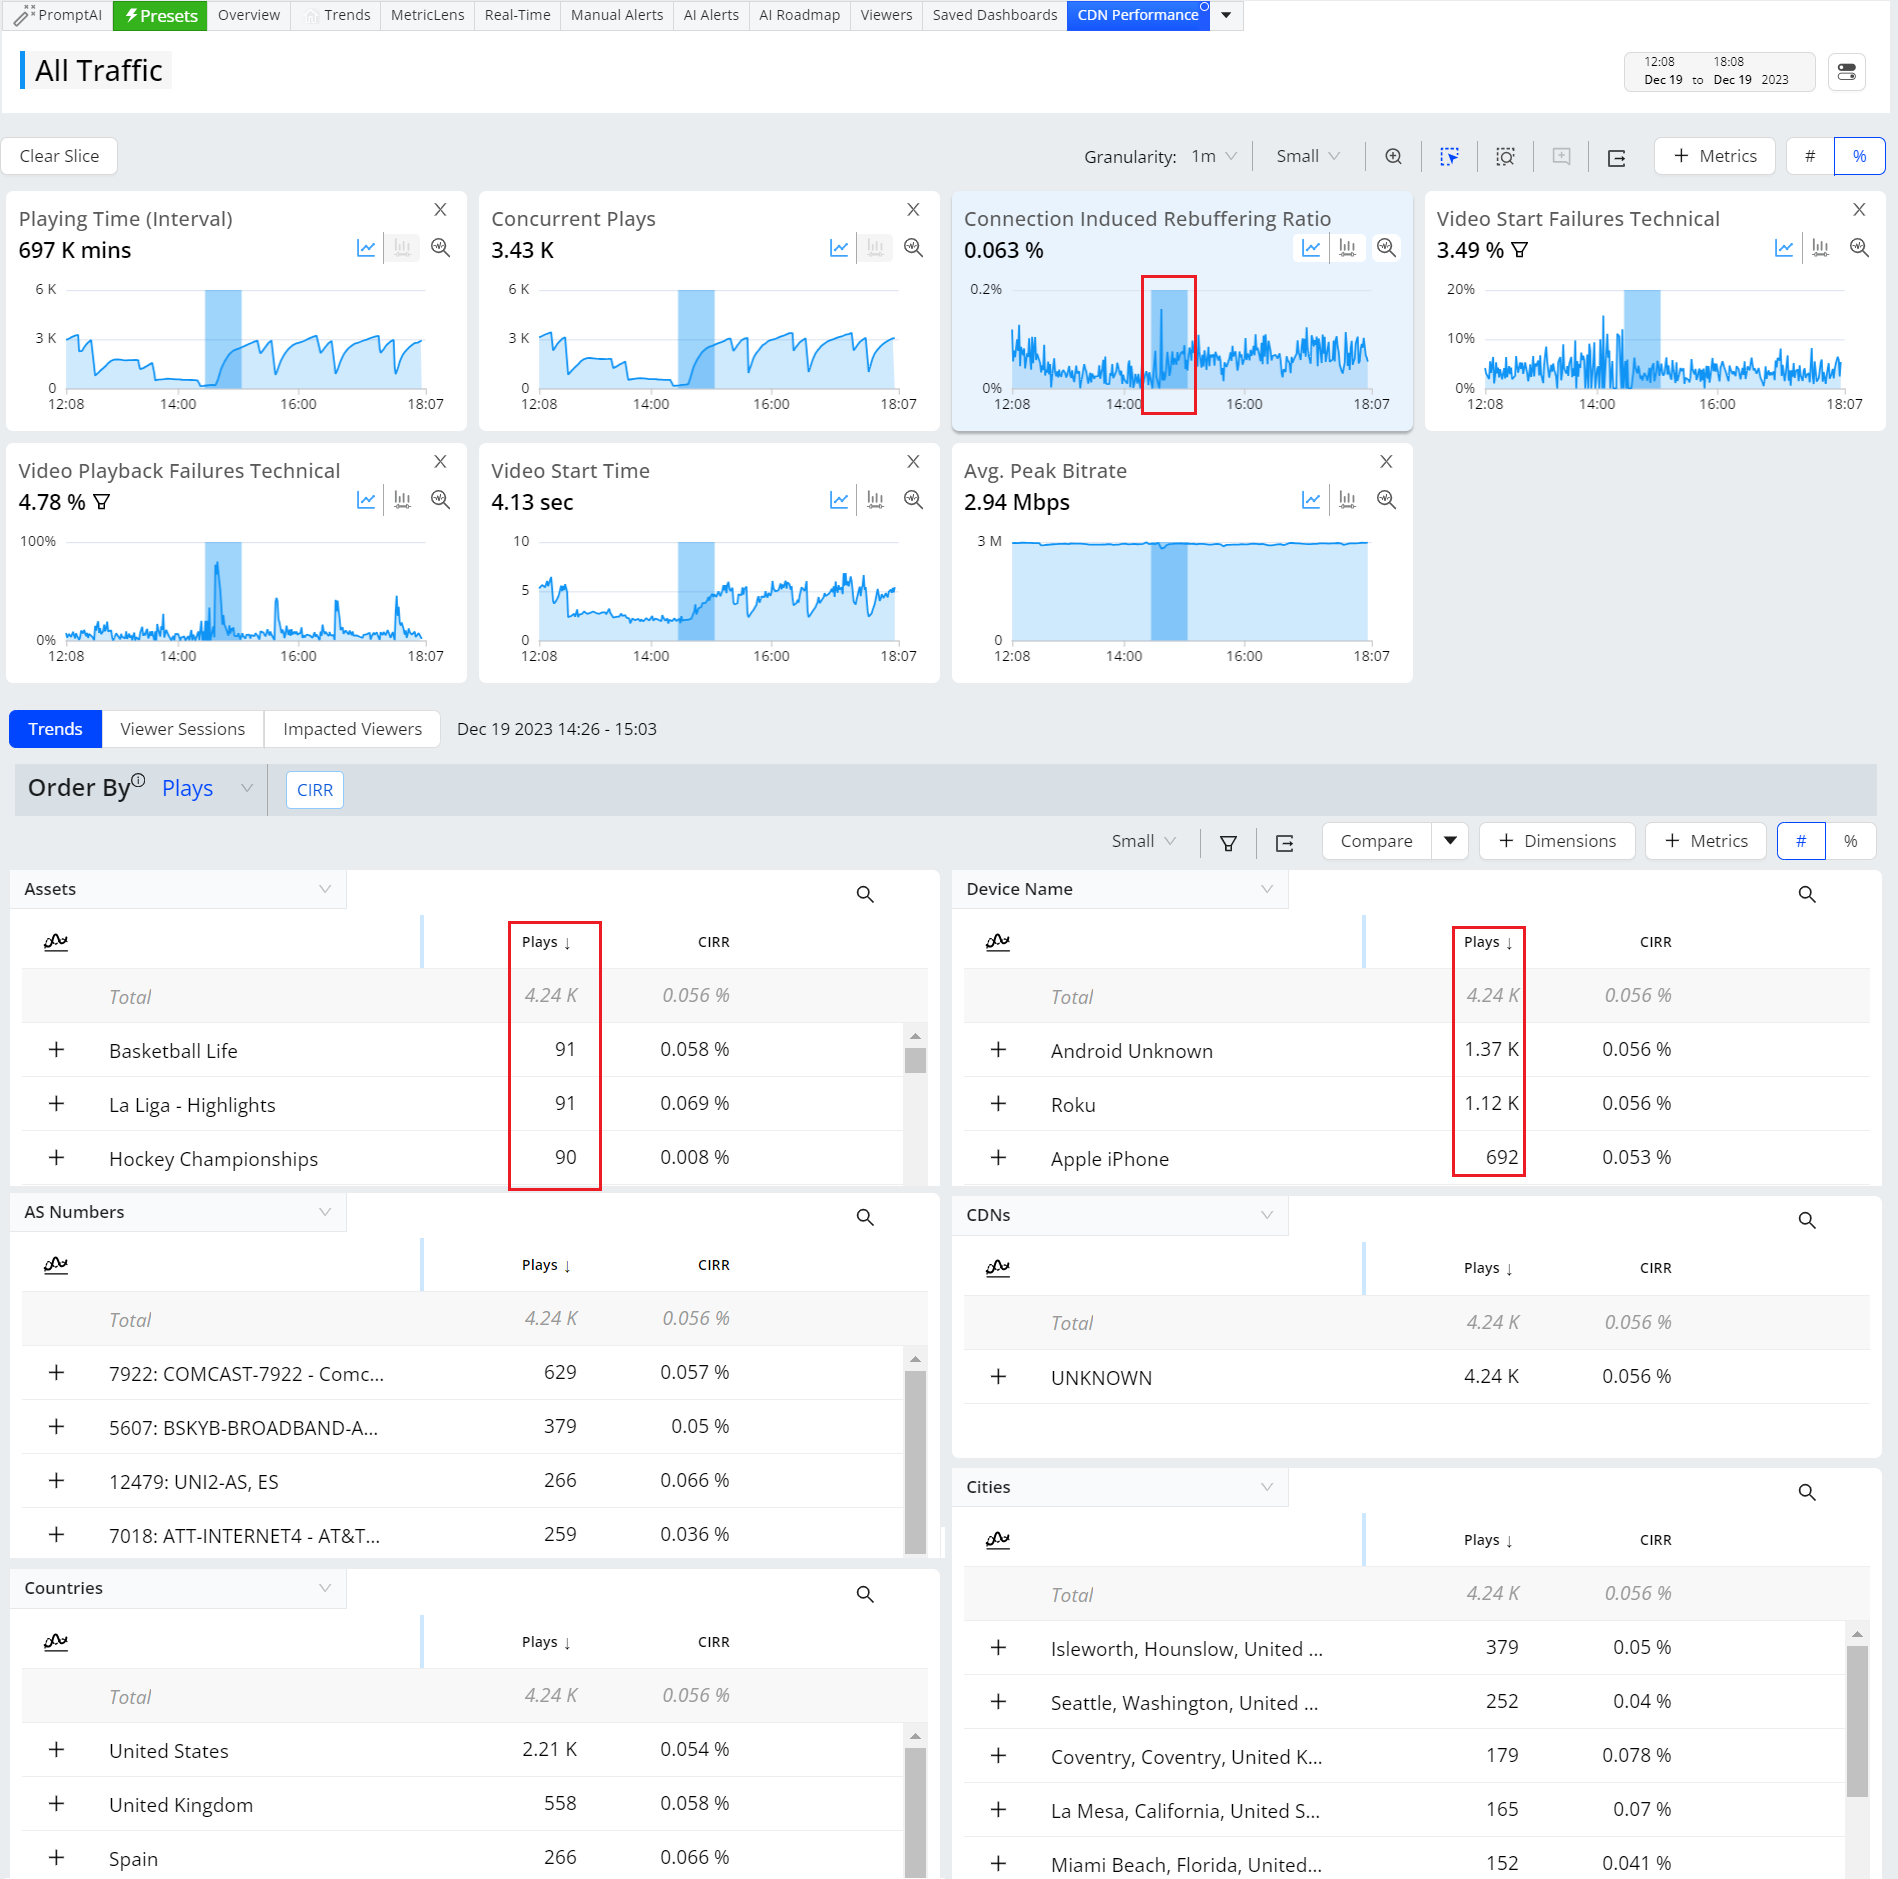
CDN Performance

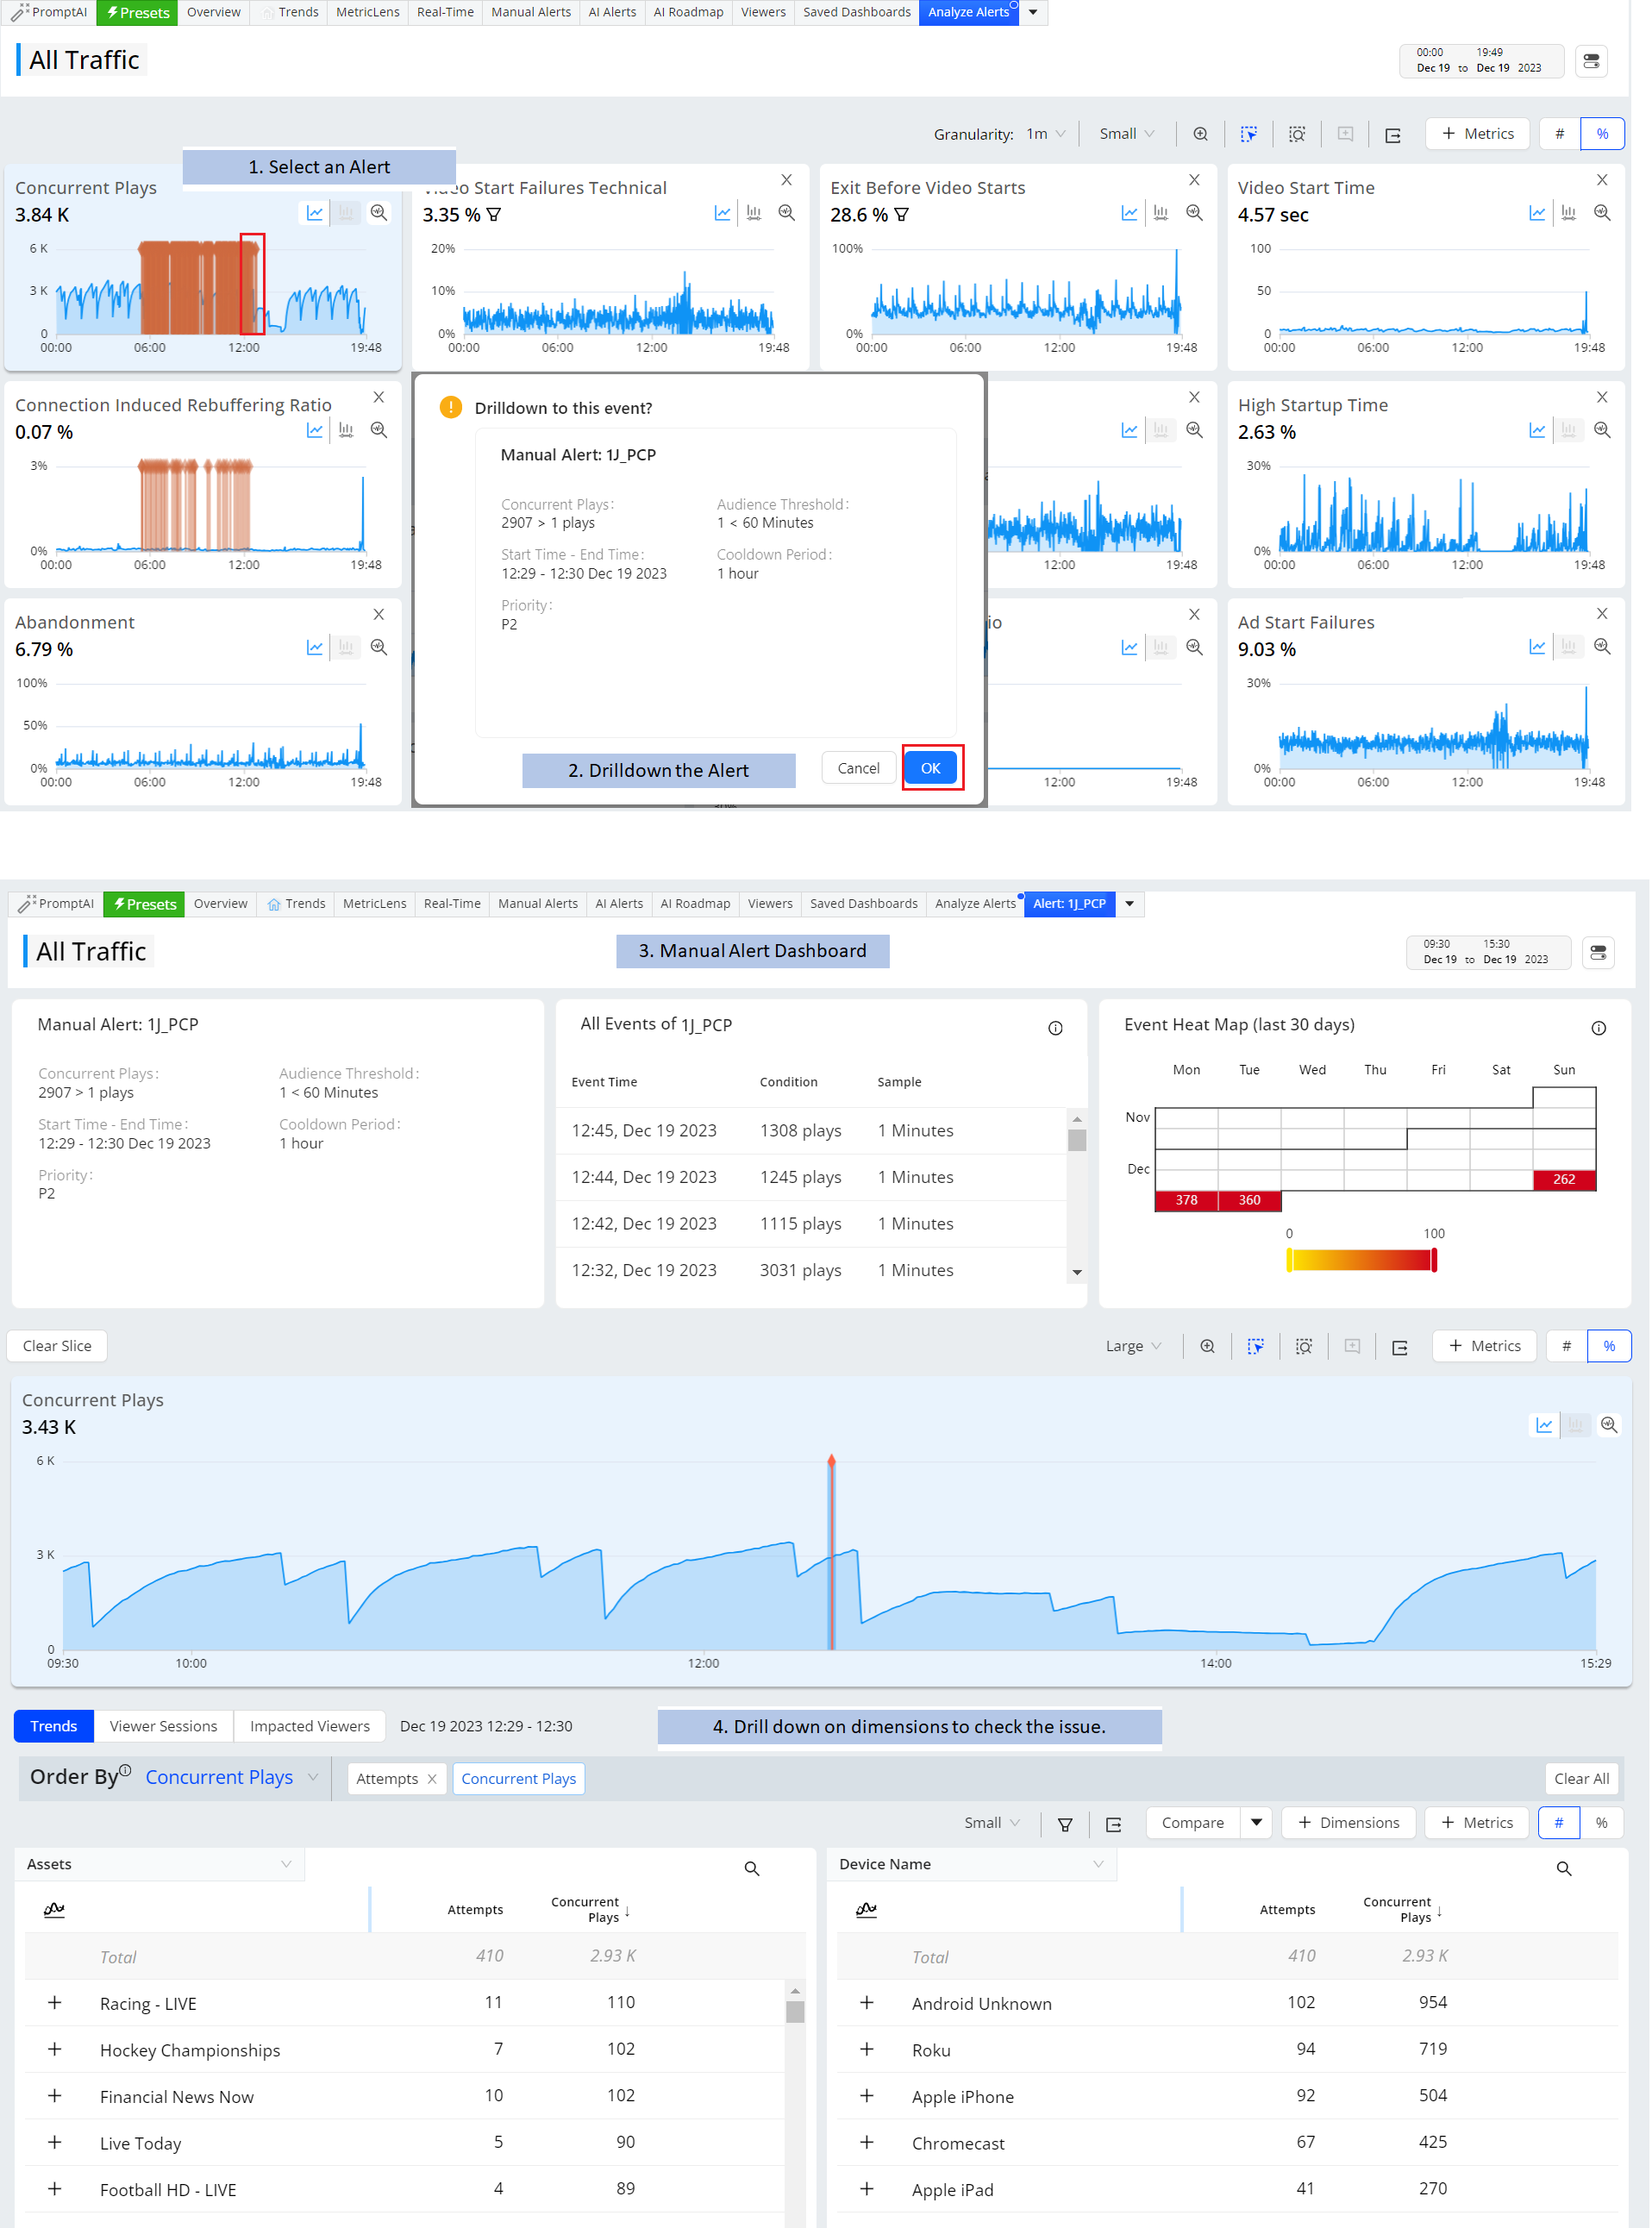
Analyze Alerts

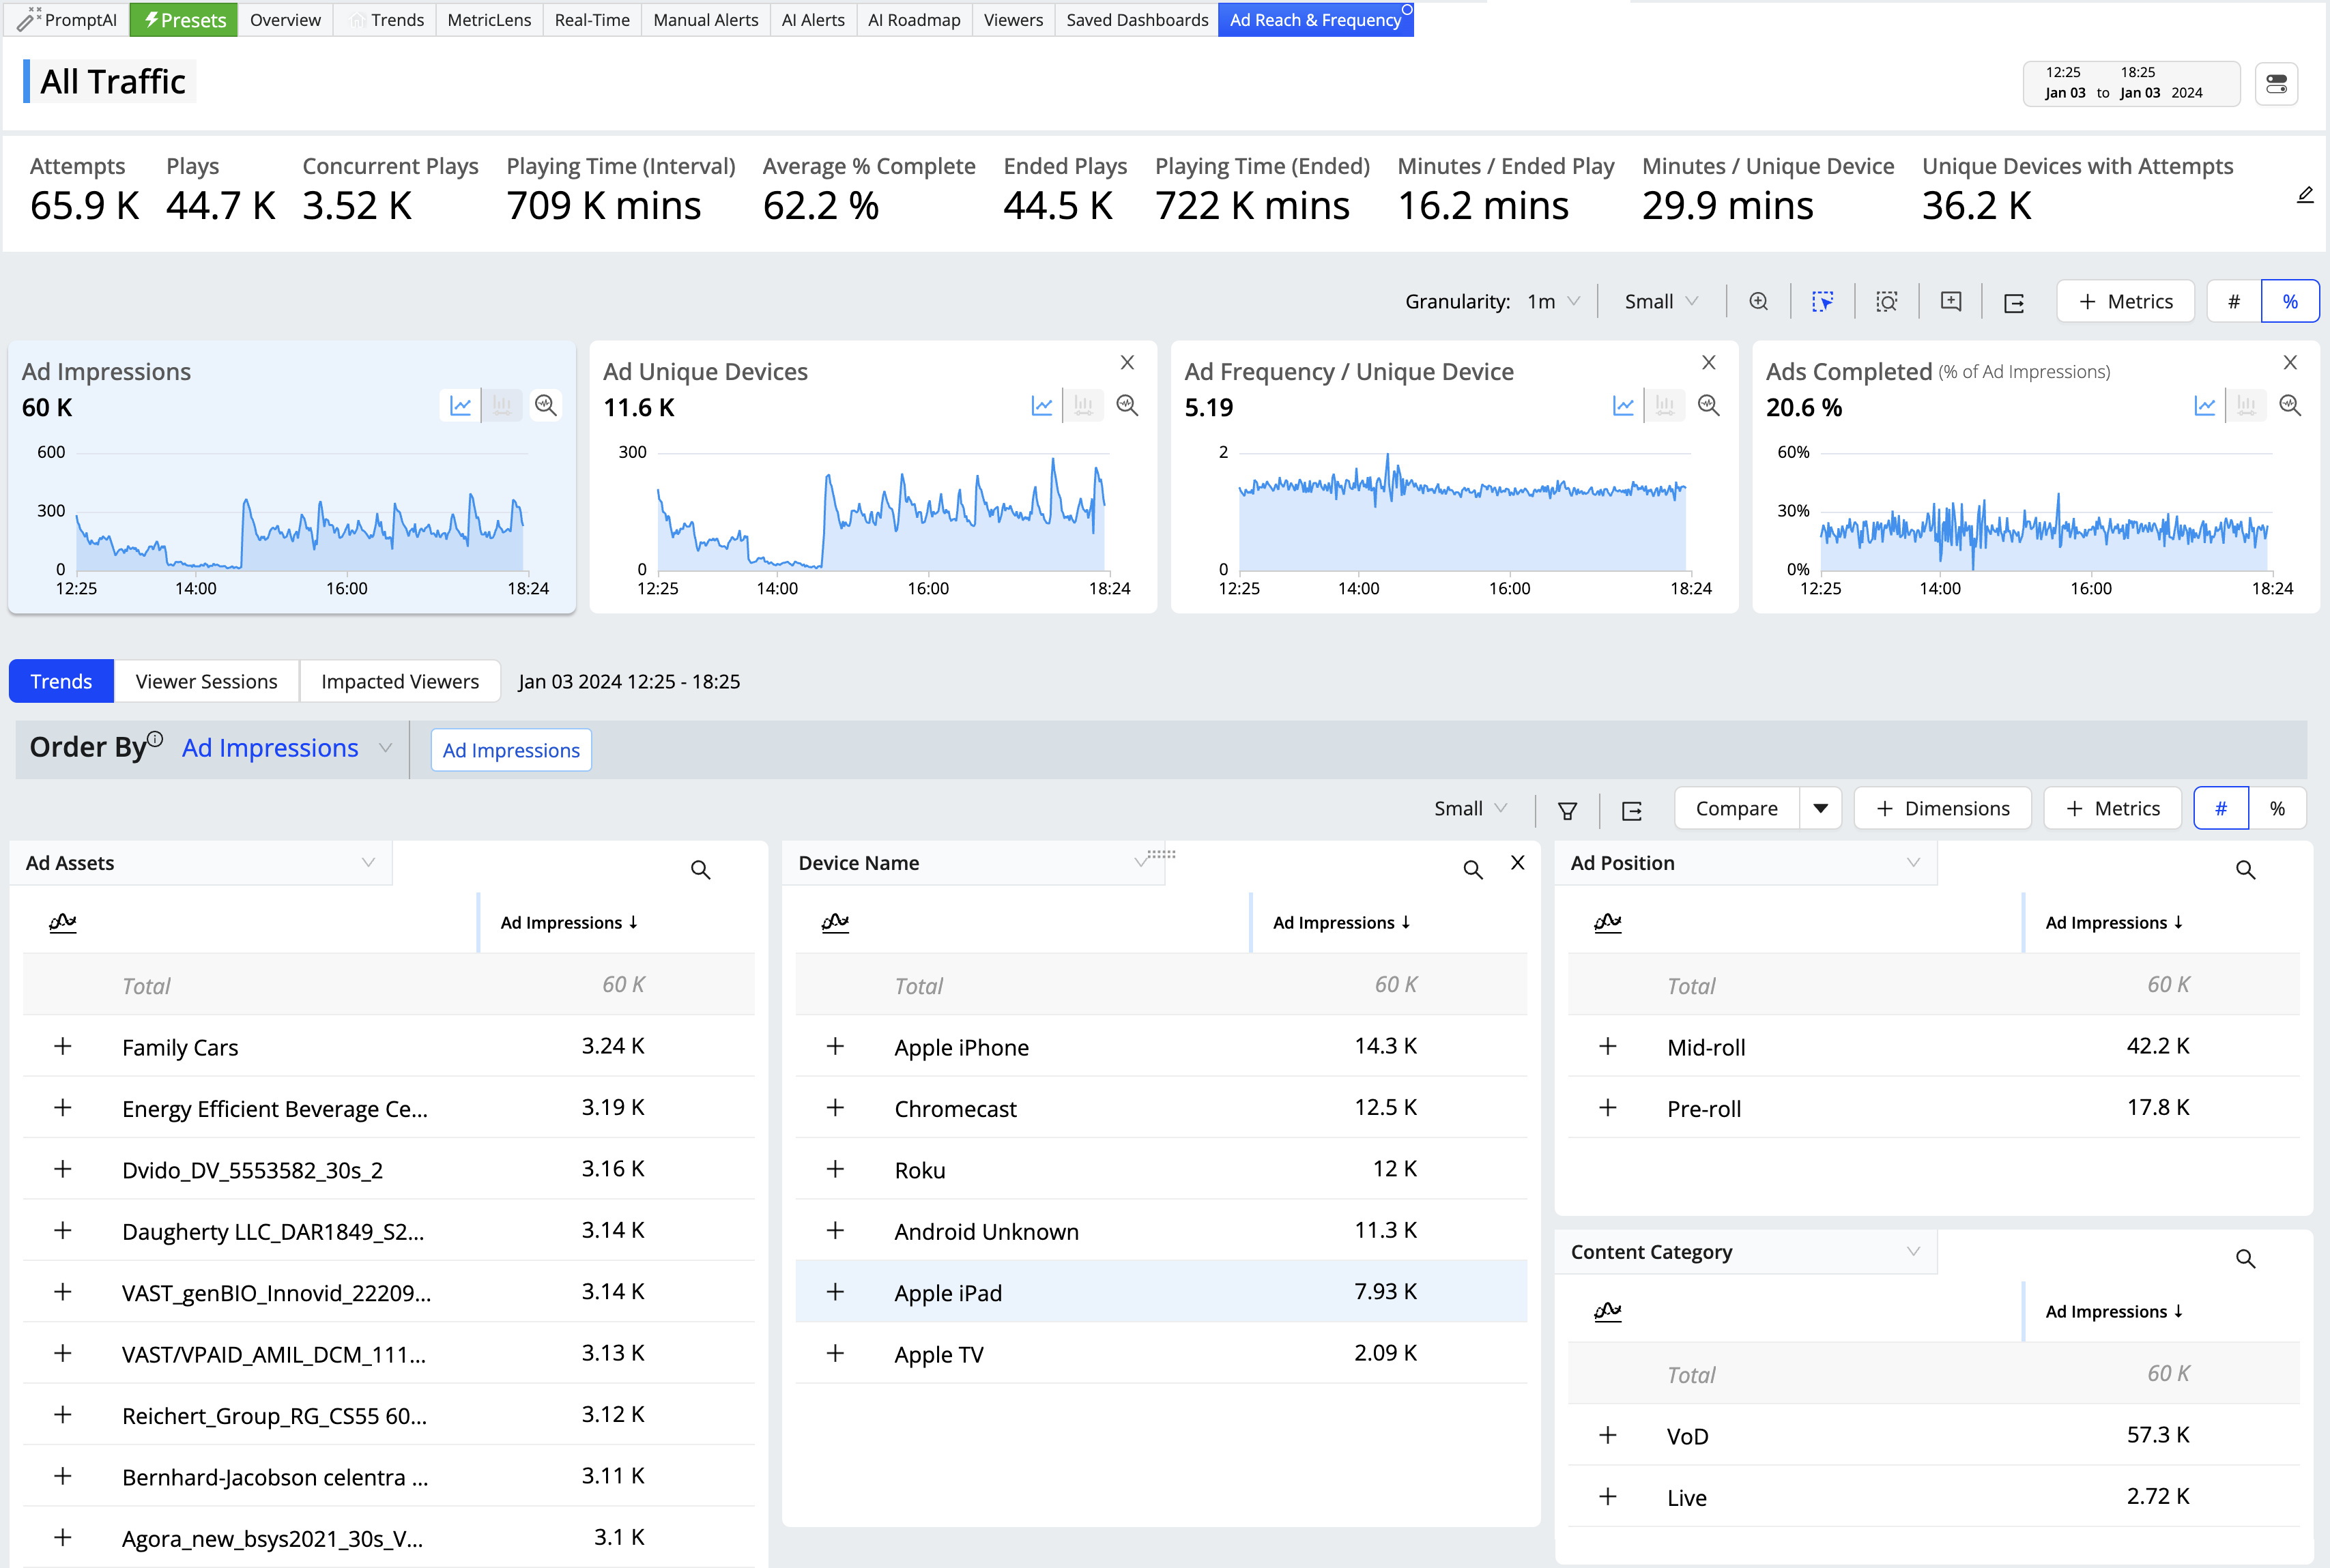
Ad Use and Performance

For more use case information, see Presets.

Trends Drill-Downs and Diagnostics

Access Pulse: Trends.


Quickly discover trends and dive into diagnostics:

  • Provides a several different workflows to diagnose streaming session performance based on the dimensional drill-downs, session impacts, and impacted viewers.

  • Click a metric in the Summary panel or a metric widget, such as High Rebuffering or VST, tp filter the displayed data to the related impacted sessions and displays secondary and companion metrics in the dimension tables.

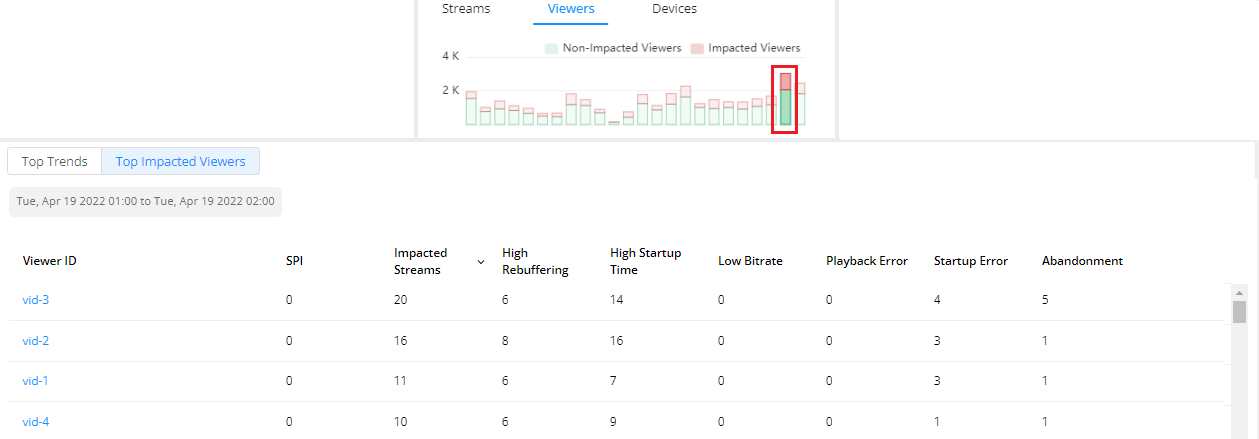
Impacted Viewers and Sessions

Access Pulse: Overview.


Go beyond issues to viewer and session impacts:

  • The Impacted stream widget shows the value only when the number of good sessions exceeds bad sessions by 10 percent; else, it displays the message "Engagement difference low."

  • Impacted and non-impacted streaming times shows the average playing times of the related sessions in minutes, uncovering specific impacted viewer and sessions details.

    For example, impacted streaming time is calculated as the sum of impacted session minutes in the current interval divided by the number of impacted sessions.

Automatic Insights

Access Pulse: Trends.

Set up automatic insight detection:

  • Quickly learn the most meaningful impacts throughout your video ecosystem, such as recurring AI alert root cause groups, broken assets, and new application versions to help streamline root cause analysis and uncover underlying performance issues.

  • Automatic Insights continuously checks performance against configured thresholds and compiles insights at the end of each day.

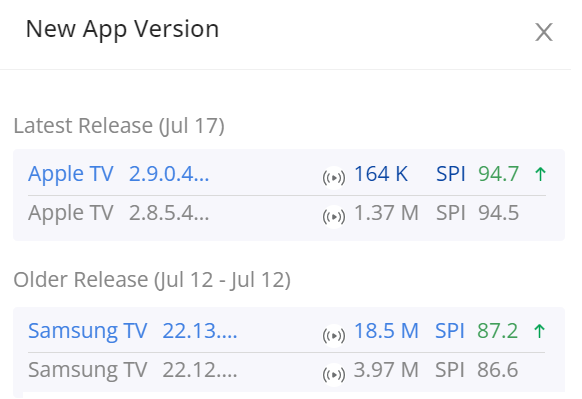
    • New App Version

    • Broken Assets

    • AI Alert Insights

  • The New App Version insights enable you to compare the performance of a new app version release with the previous release on each device.

  • The list, by default, is sorted by release date with the latest release on top. This insight has two configurable settings: Impacted Unique Devices and Traffic on App Version. The Traffic on App Version percentage is based on the new app traffic compared to the total traffic on that device.

    For more information, see Automatic Insights.

Focus Mode

Access Pulse: Trends.

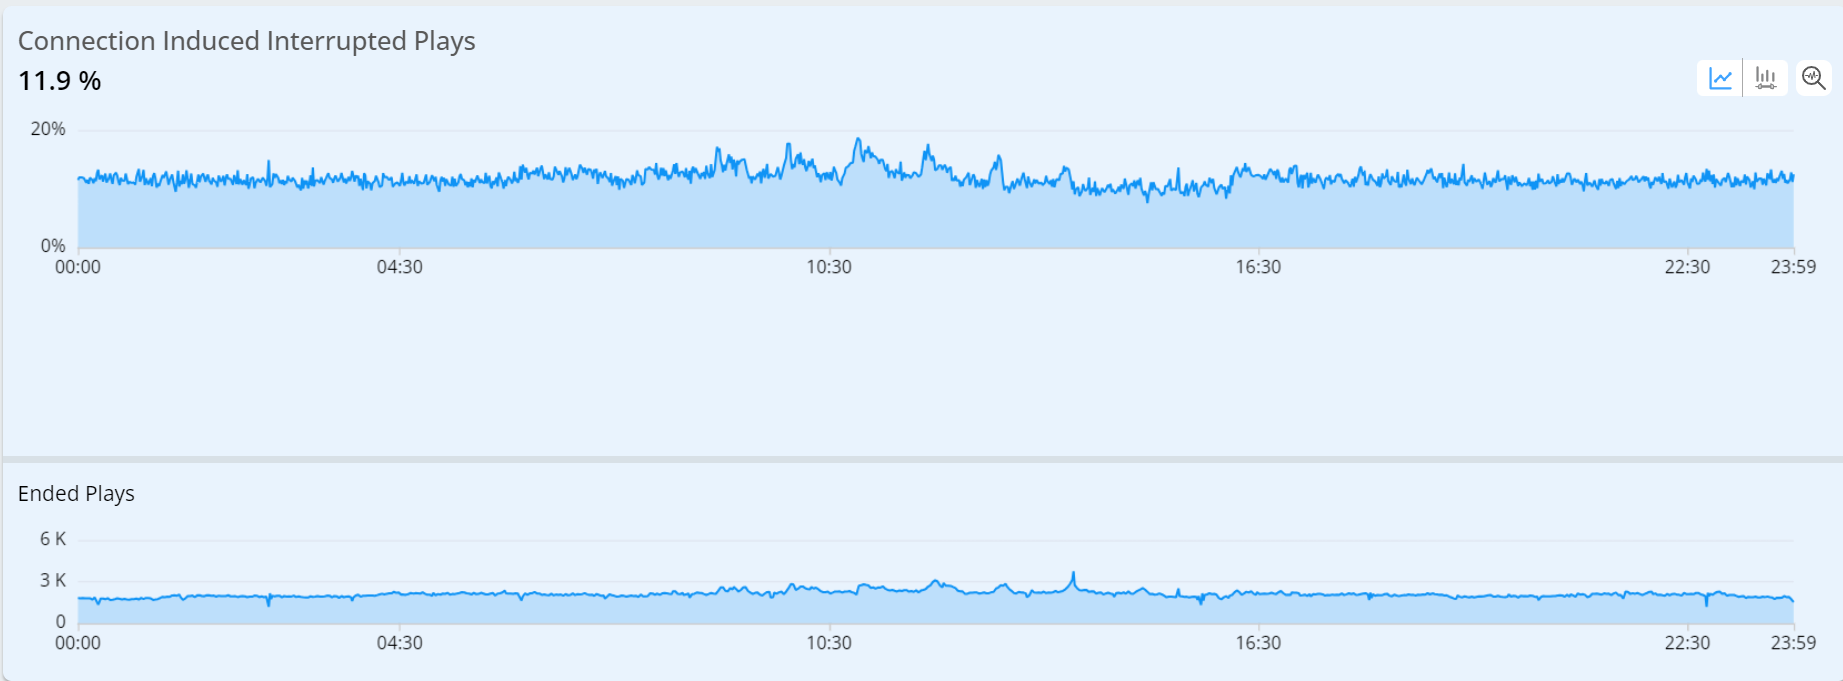
  • Click the Focus icon in a metric time series to display an expanded view of the time series above the trend data.

  • The focused view of the metric provides the enhanced view of the selected metric along with the secondary metric details. Clicking the distribution icon to see the distributed view of the time series.

    For more details, see Trends Diagnostics.

Real-Time Analysis

Access Pulse: Trends.


Access Pulse Real-Time(NOC).

Real-Time in Trends

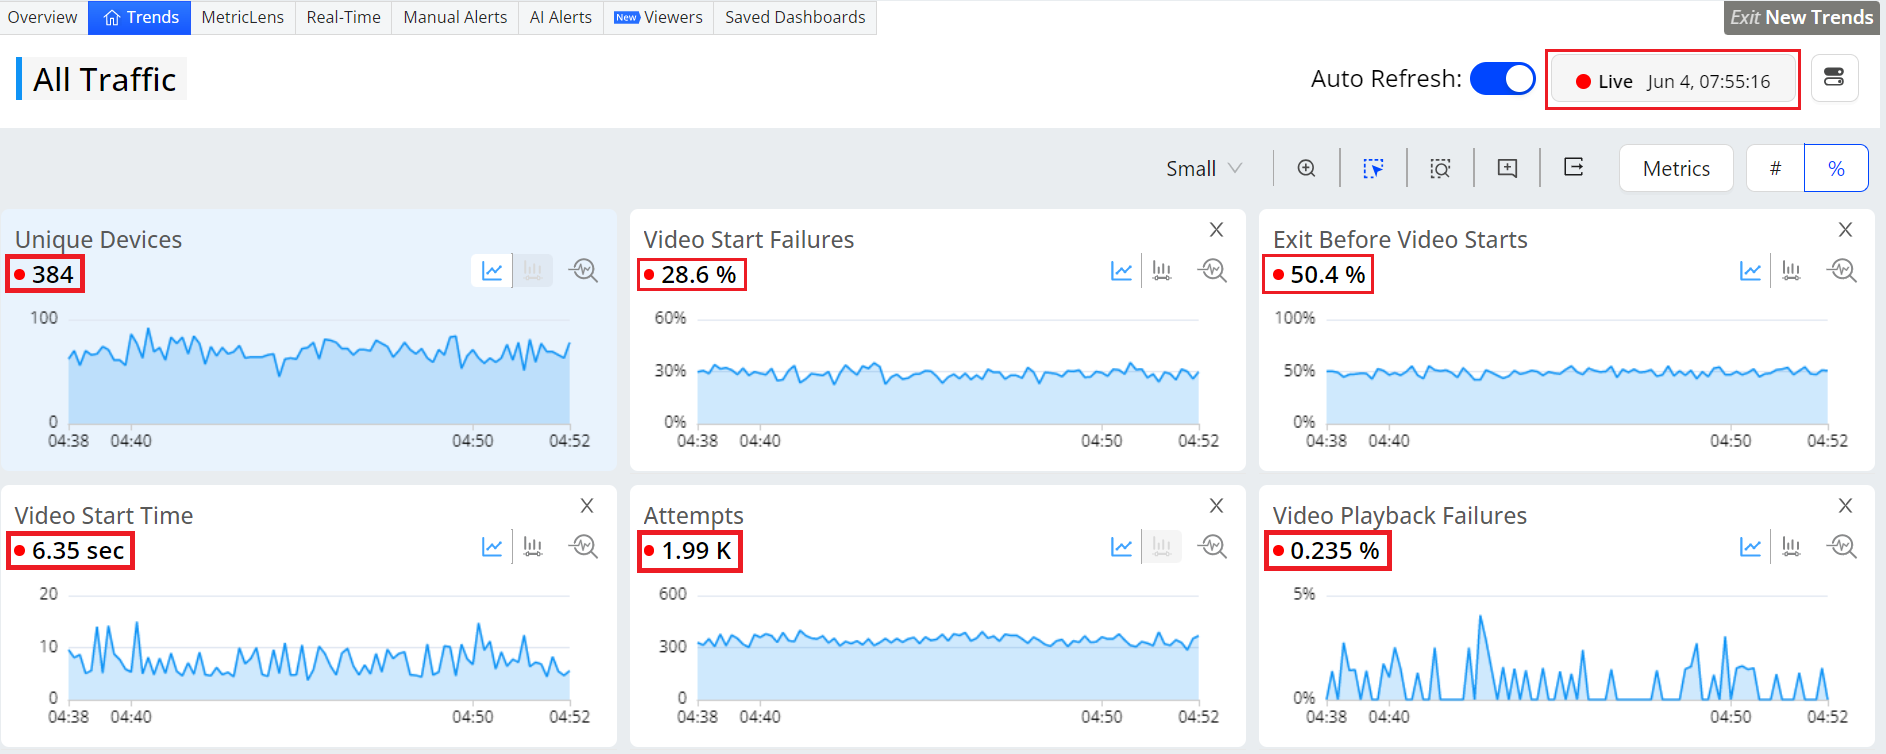
  • Use the updated date picker to select the live mode. The Live mode shows the time series along with the aggregated metric numbers and percentages on the metric widget aligning the aggregate values with the metric values in the dimension table.

  • Real-time live mode supports 10 second data refresh with less than 30 seconds latency, based on a 10-second tumbling window.

    For more details, see Trends Dashboard.


Real-Time Dashboard

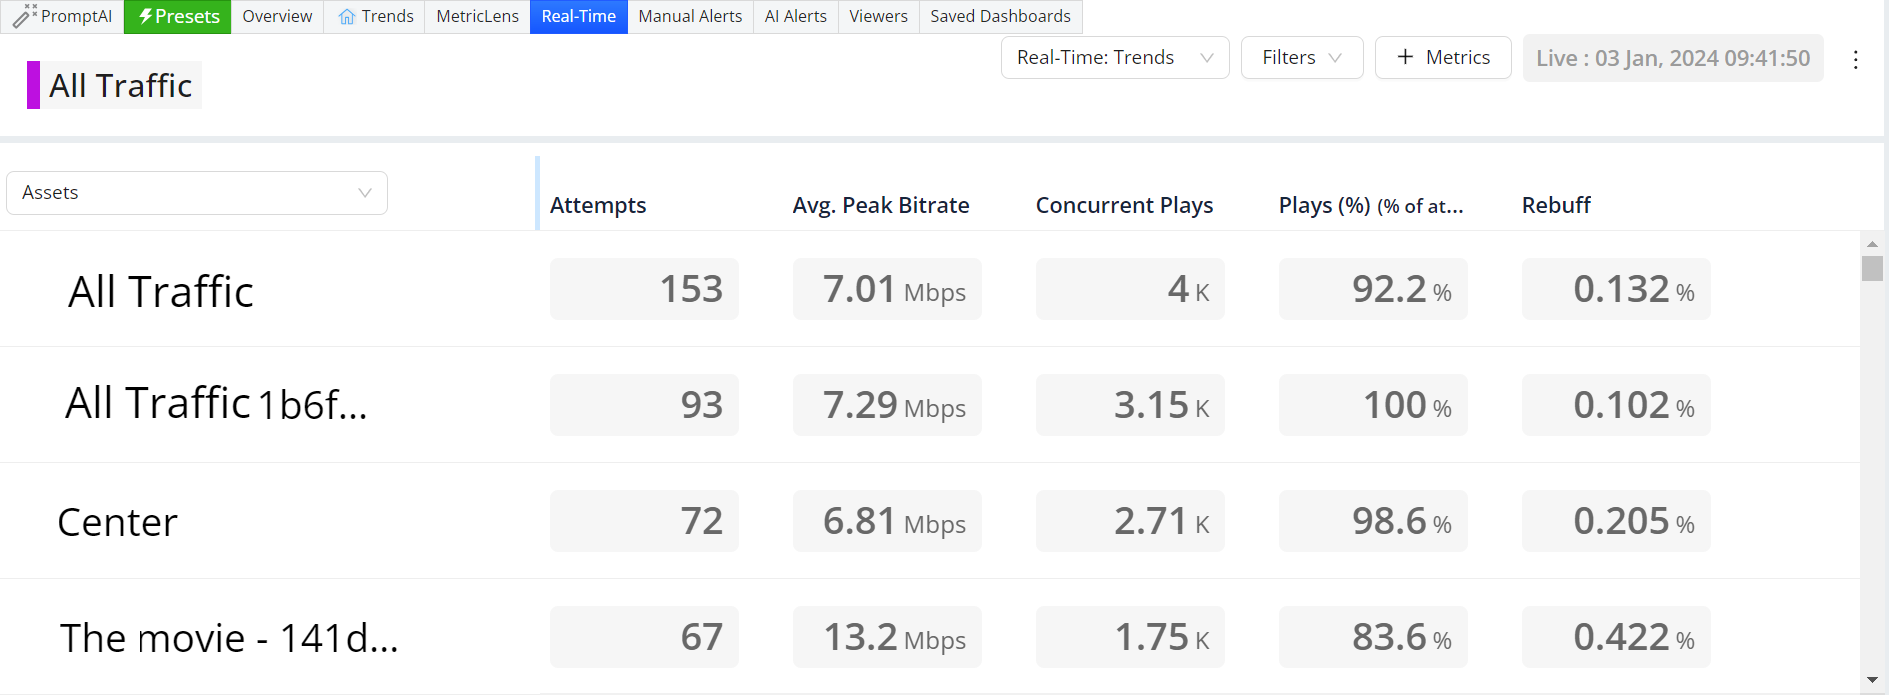
  • Conviva's Real-Time dashboard provides a visual presentation of QoE metrics for actionable streaming intelligence in real time. Enhanced by selected filters and dimensions, you can monitor the performance of your most critical streaming KPIs with visual threshold crossing indicators to quickly identify and correlate changes in QoE metrics.

  • With up to 20 filters and 200 monitored dimension values per Real-Time dashboard, you can customize the dashboard settings to focus on the most critical performance, such as Live traffic across channels for tent pole events or All Traffic across assets for on-going operations. The Real-Time has two modes - Trends mode supports monitoring video streaming performance based on selected filters across dimensions, while the Real-Time Filters mode supports monitoring video streams based on selected filters. Save dashboards for quick access to recurring diagnostics and monitoring.

    For more details, see Real-Time Dashboard.

MetricLens

Access Pulse: MetricLens.

Use MetricLens for dimensional analysis of quality and audience metrics in a unified visual presentation of metric comparison bars and time series with 1-hour granularity.

For more details, see MetricLens.


Benchmarks

Access Pulse: Overview.


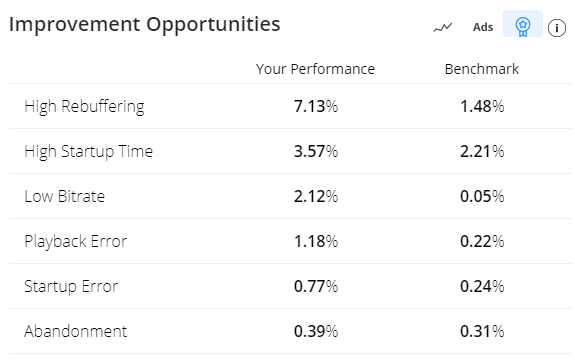
Compare your performance with industry cohort benchmarks based on the 95th percentile of cohort performance, highlighting performance areas where you excel and where to improve.

For information on the basic/advance benchmarks, and benchmark calculations, see Experience Overview.


Product Leads Presets Overview Product Leads Presets Benchmarks