Automatic Insights highlight areas with the most meaningful impacts throughout the video ecosystem, such as recurring AI alert root cause groups, broken assets, and new application versions to help streamline root cause analysis and uncover underlying performance issues.
Automatic Insights continuously monitors performance against configured thresholds, and compiles updated insights daily. In addition, Automatic Insights updates broken assets at the end of every hour and sends an hourly email that includes all broken asset notifications from the past 48 hours. The system displays identified insights for two days and provides an option to export them.
Clicking an insight opens a related page for more analysis. For example, clicking an AI alert root cause group opens the AI alert summary page to focus on the AI alerts that contributed to the root cause.
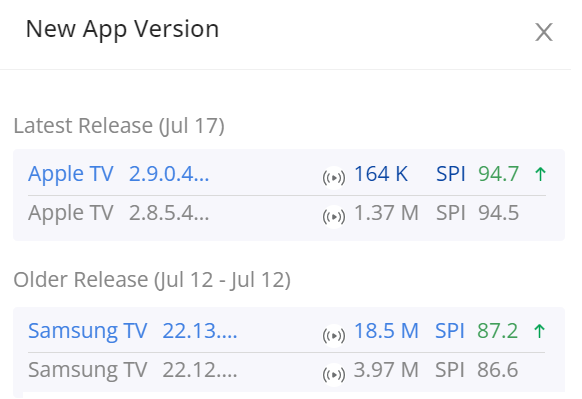
New App Version Insights
These insights compare the performance of the new app version release with the previous release on each device.
The list, by default, is sorted by release date with the latest release on top. This insight has two configurable settings: Impacted Unique Devices and Traffic on App Version. The Traffic on App Version percentage is based on the new app traffic compared to the total traffic on that device.
Note: The release analysis is limited to the last two weeks of releases. “No data” is also displayed if there were no new releases in the previous 15 days.
Image: New App Version
Note: Once traffic on the released app version is greater than the Traffic on App Version, set value, the entry is displayed in the New app version details.
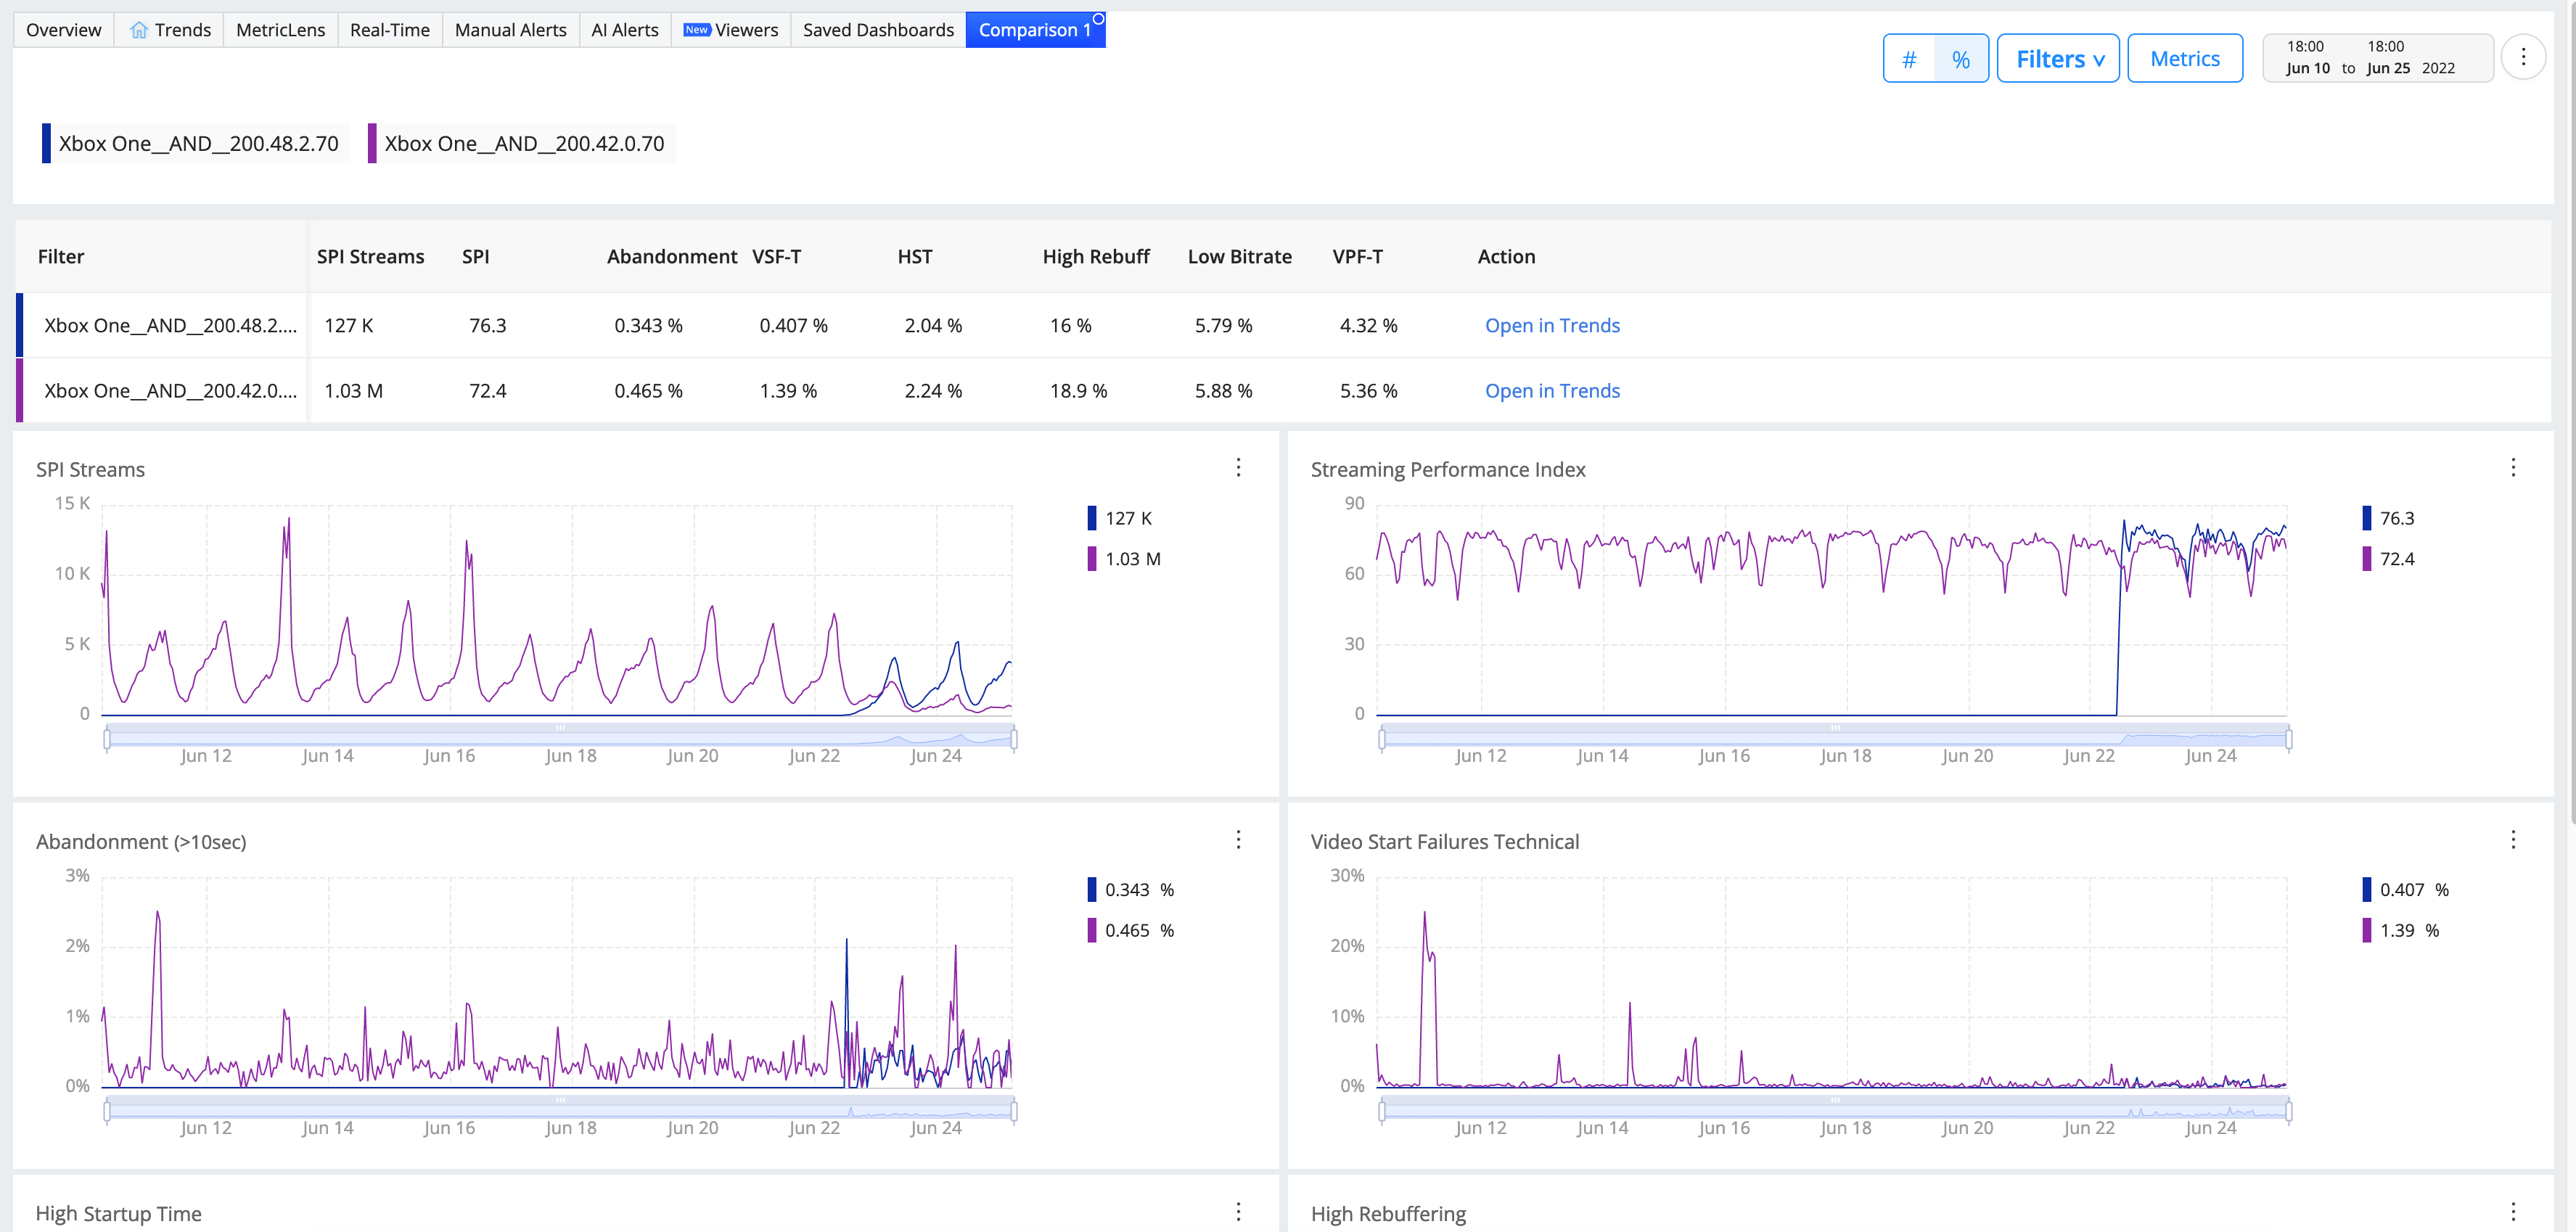
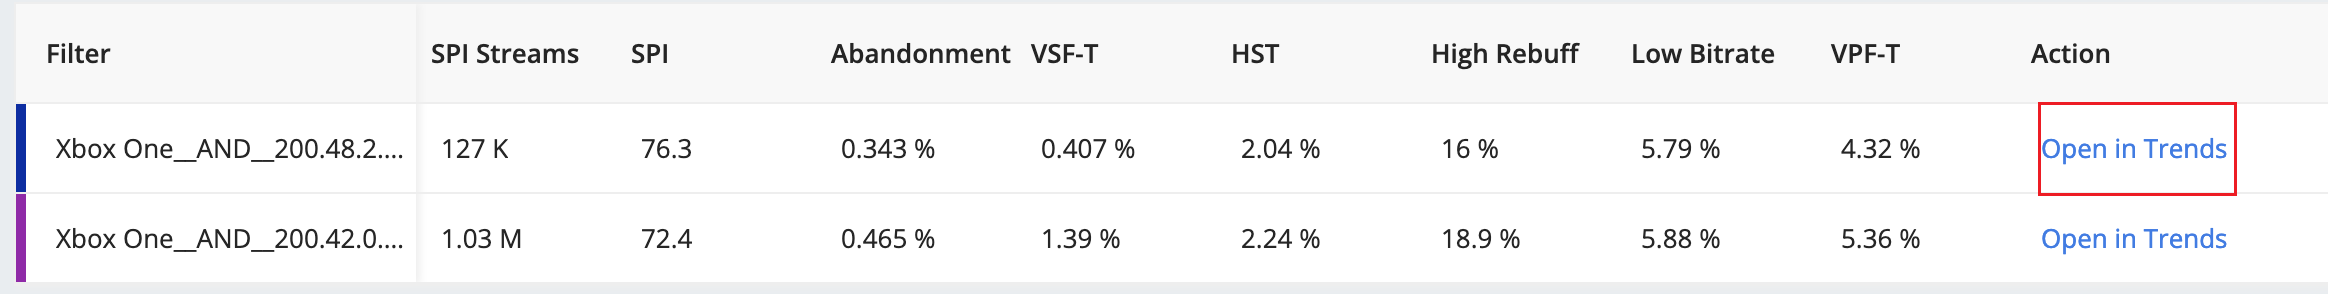
This example shows PC 7.0.0 with a slightly higher SPI than the previous app version. This indicates that the new release is performing well, equivalent to the previous release. The older releases indicate that the other recent applications have been performing at slightly lower SPI levels. Clicking an app version opens the Compare page for further analysis.
Note: Detecting New App Version requires the dimensions Device Name and App Version to be enabled in the account. If these dimensions are not available, “No data” is displayed. Please reach out to Conviva Support to enable them.
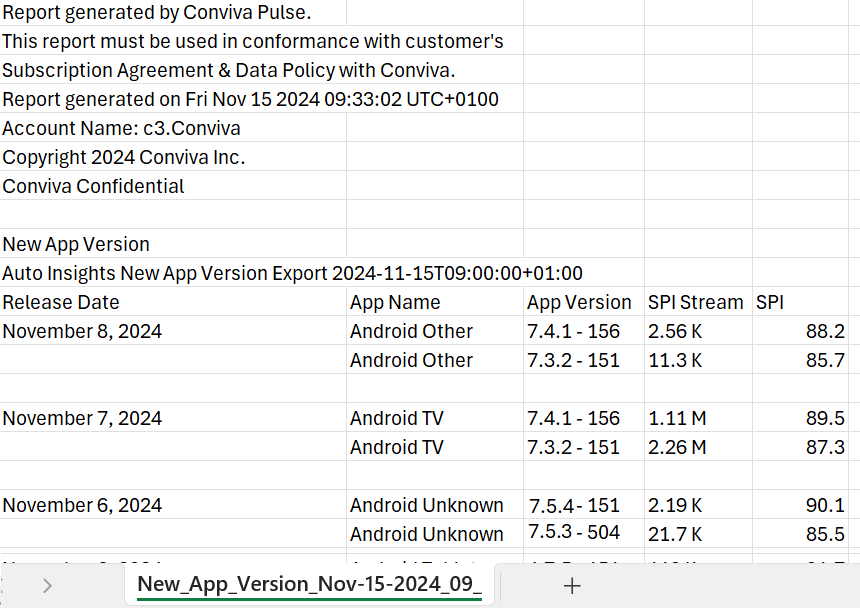
The export button downloads all listed app version(s) in a .csv file.
Image: New App Version .csv file
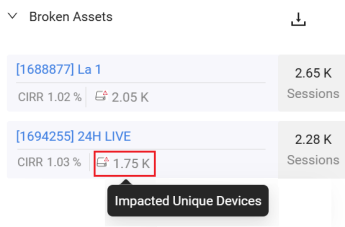
Broken Assets Insights
These insights provide a list of the Broken Assets that failed to meet the configured threshold values. This insight also displays the affected number of impacted unique devices and sessions. Click the asset name for a one-click drill down to the Trends page for further analysis. Automatic Insights updates the broken assets at the end of every hour.
Note: Broken Assets Insights works only with VoD traffic. Also, performance issues may exceed multiple threshold settings for a given broken asset. Only the setting with the highest impact on the asset is displayed.
Image: Broken Assets
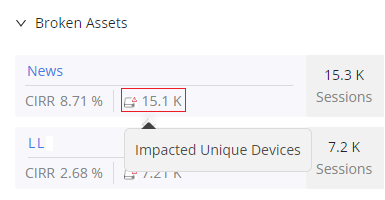
This example shows two broken assets. Both the assets had CIRR above the configured threshold.
The export button downloads all listed broken asset(s) in a .csv file.
Image: Broken Assets .csv file

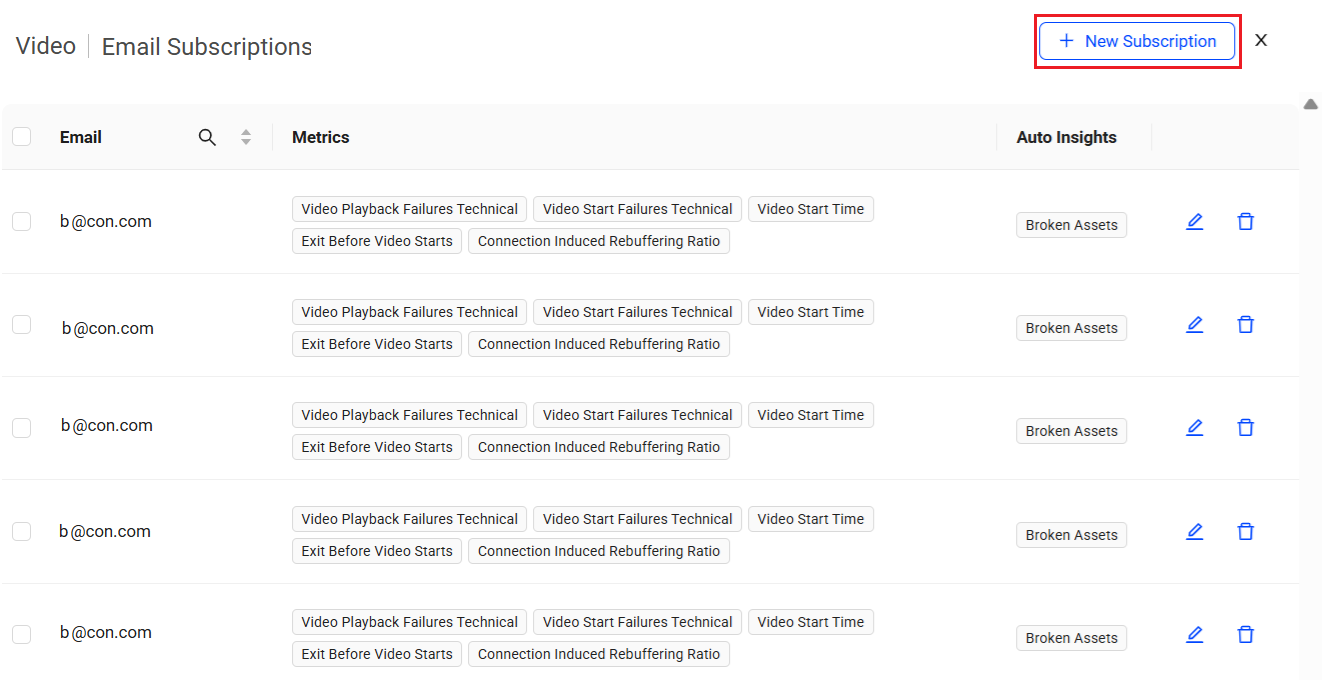
Email Subscription
Email Subscription provides an option to subscribe to email notifications about broken assets. When the system detects a broken asset, it sends an email to the configured email IDs.
To configure the email for the broken asset,
-
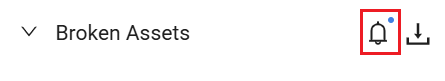
Click the Bell Icon on the top right section of the Broken Asset, to see Email Subscriptions screen.
Image: Broken Assets
-
On the Email Subscription screen, click +New Subscription to configure the email subscriptions.
Image: Email Subscriptions
-
On the New Subscription screen, provide the email ID and select All or New,
-
All: All Broken assets detected in the last 48 hours.
Note: An email is sent every hour, including all notifications of broken assets reported within the last 48 hours.
-
New: New Broken Assets detected in the last hourly run.
Note: An email notification is sent only when the system detects a new broken asset in the latest hourly report.
Image: New Subscription

-
-
Click Save to create the new subscription.
For information on email subscription, see Executive Email.
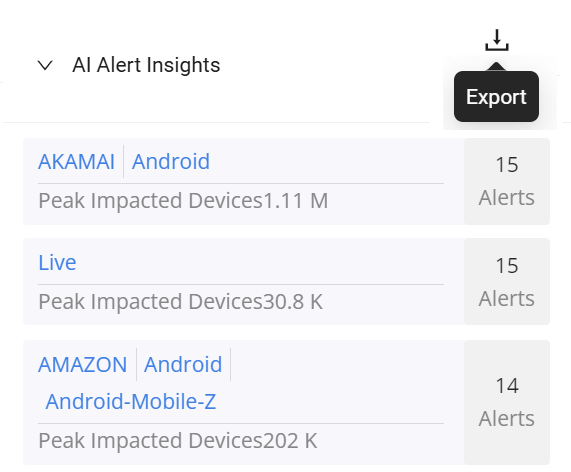
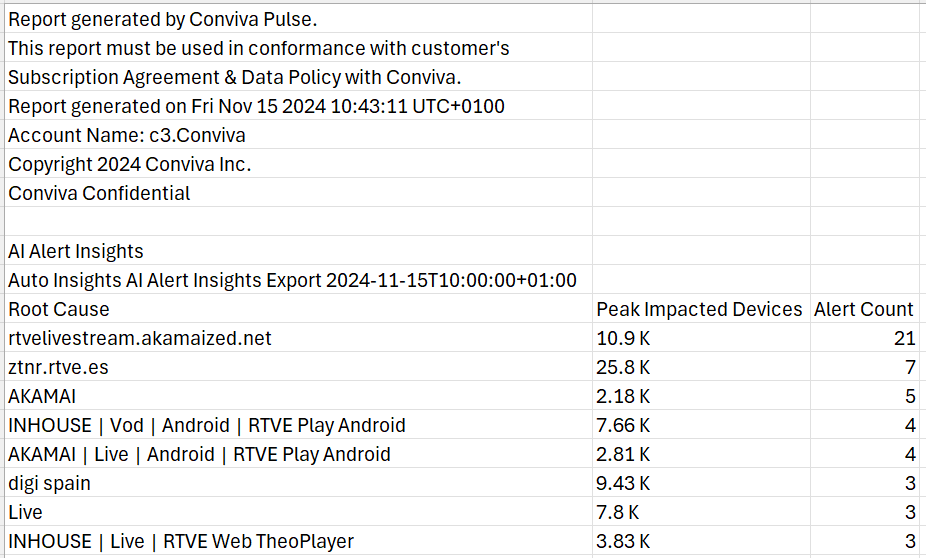
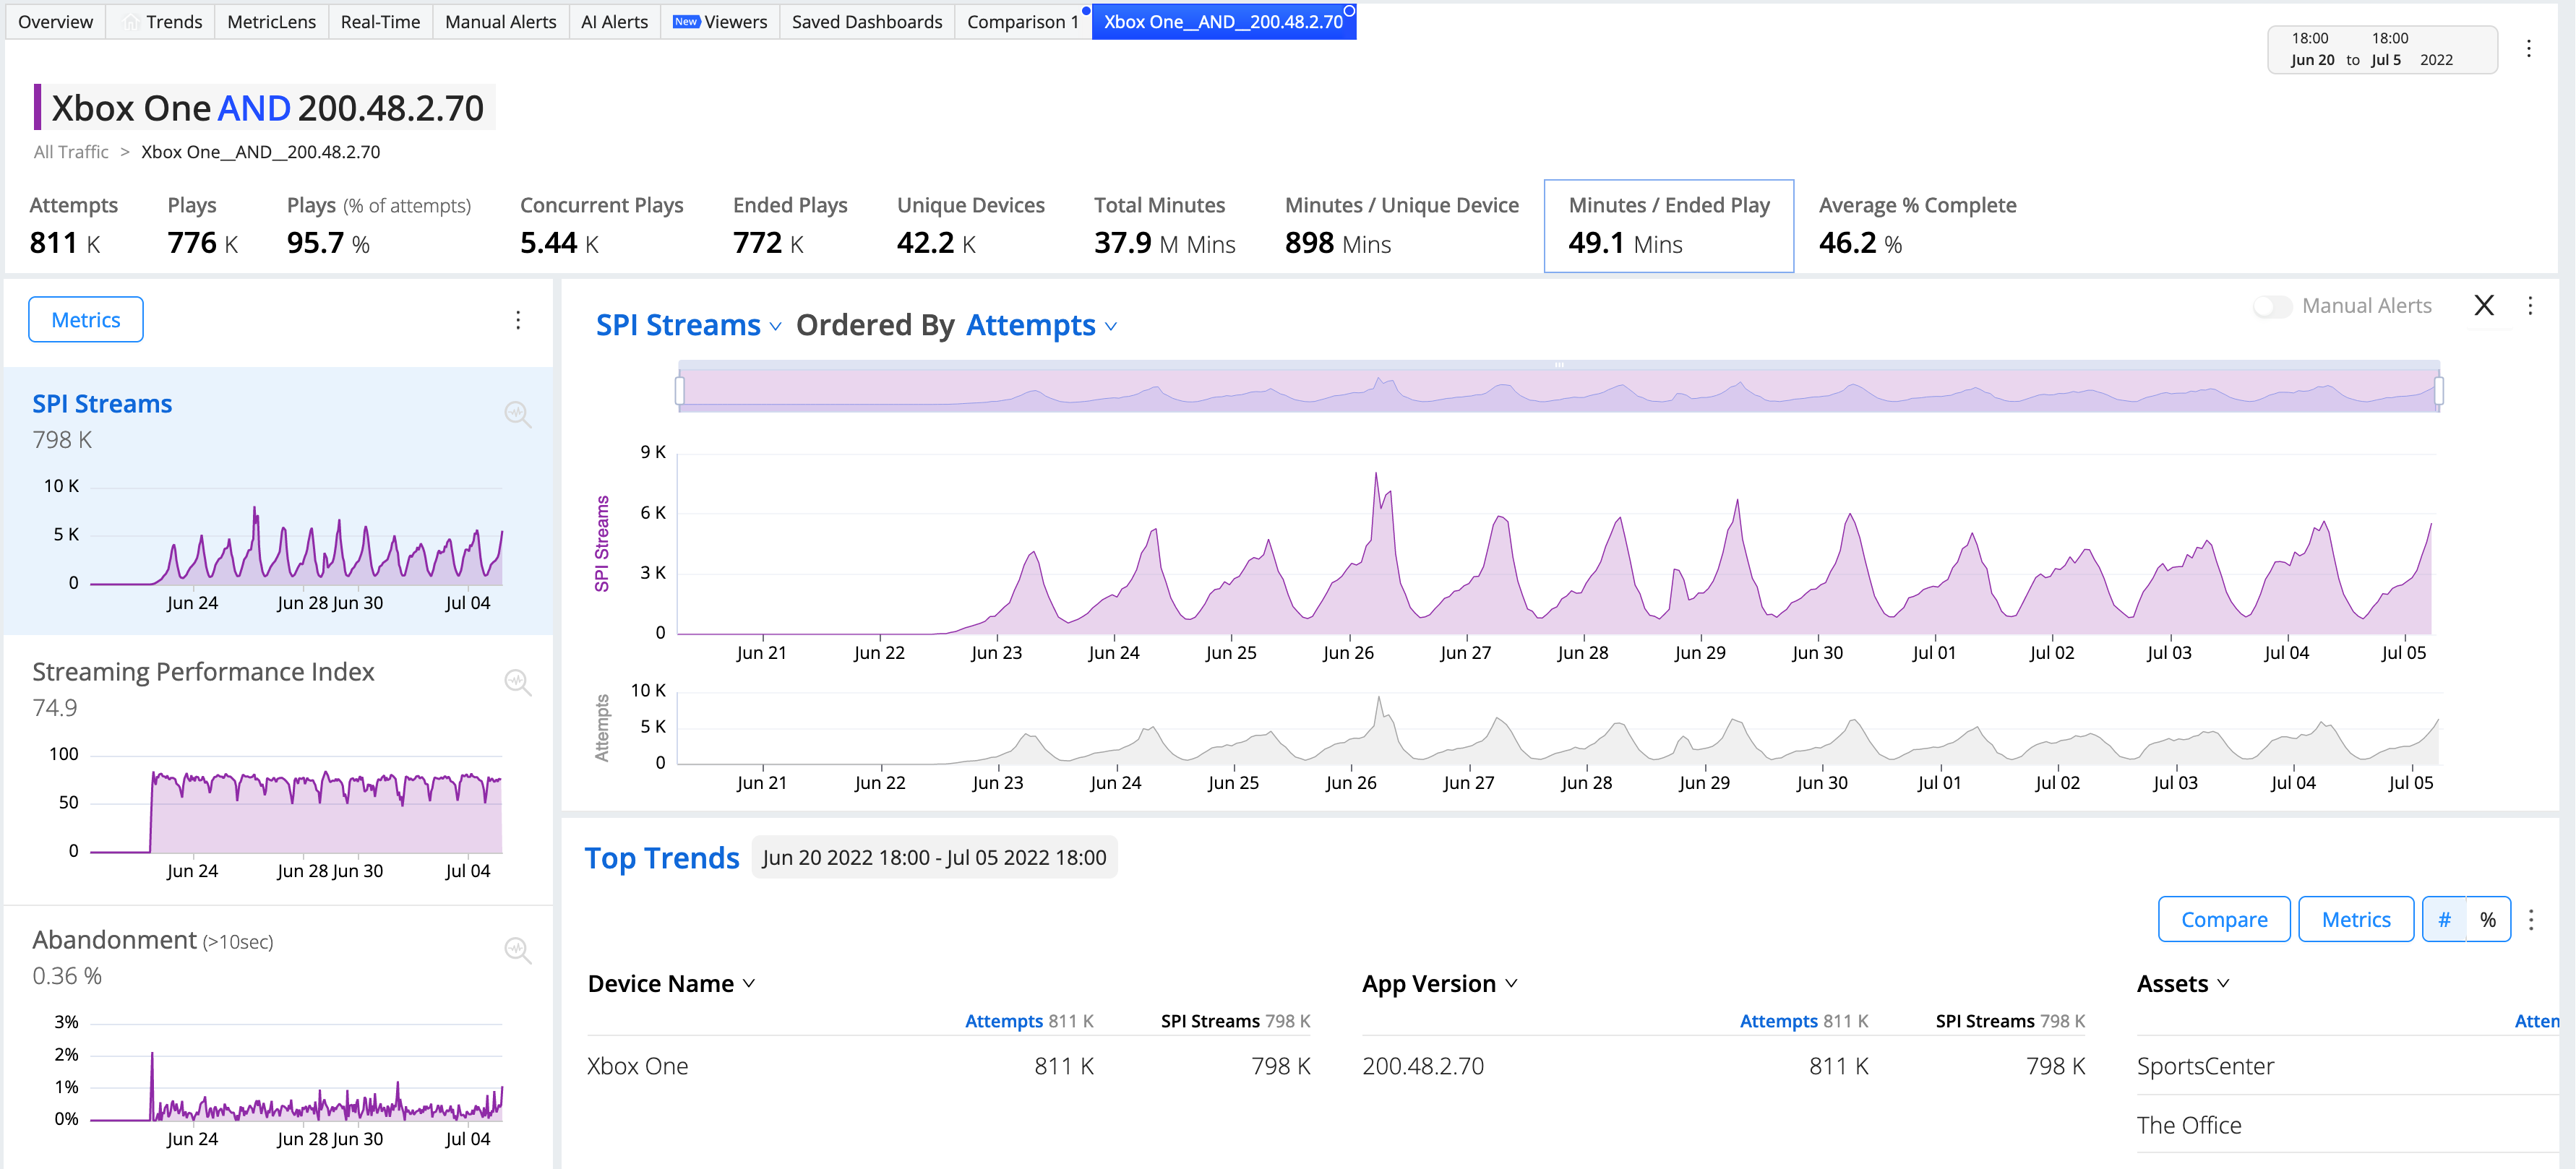
AI Alert Insights
This insight displays the AI alerts that exceeded the configured Impacted Unique Devices and Duration threshold values. By default, at the end of each day, Automatic Insights checks for AI alerts with a duration of at least 30 days, and 50 impacted unique devices.
Note: After updating the Alert Insights settings, the AI Alert Insight list refreshes according to the new settings within one hour. The list generated from the previous settings remains visible for two days.
Based on the requirement, change the default values in the Alert Insights settings as needed. Clicking an AI alert opens the AI Alert page with alert details.
Image: AI Alert Insights
The export button downloads all listed AI alert insight(s) in a .csv file.
Image: Export details
Accessing Automatic Insights
To access automatic insights:
Note: Only Admin can access Automatic Insights settings.
-
To set up automatic insights, click the Automatic Insights icon in the main toolbar or the Insights button on the AI Alerts page.
Image: Insights in AI Alerts

Image: Insights in main toolbar

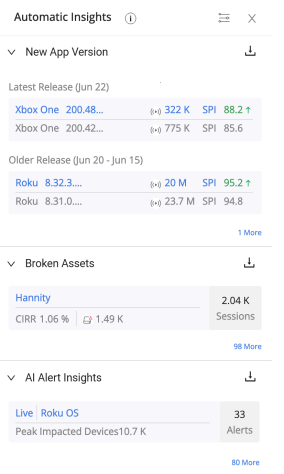
The Automatic Insights drop-down appears with any of the flagged insights, such as New App Version, Broken Assets, and AI Alert root cause groups.
In this example, Hannity and Life Below Zero: First Alaskans are flagged as broken assets. Click a broken asset to link to the Trends page for that asset dimension. Live Roku OS, Amazon Live Tizen, and DASH are flagged as alert insights. Click on the AI Alert Insights entry, and the AI Alert Summary page is displayed.
Image: Automatic Insights
-
Hover over the New App Version entry to see the release date of the application. The Automatic Insights displays the latest release and older releases for comparison.
Image: Automatic Insights

-
The Broken assets result list displays the unique, impacted devices and the number of impacted sessions. Click the asset name links to the Trends page for more analysis.
Image: Broken Assets
-
-
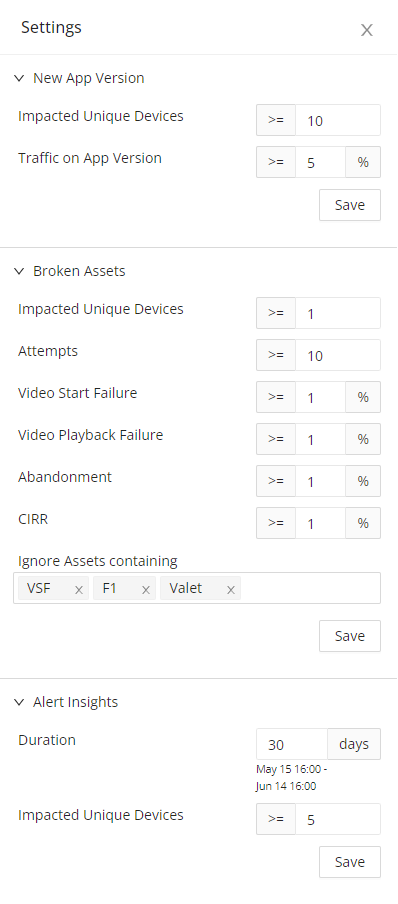
To get started, click the settings icon to customize the thresholds to trigger an automated insight, such as duration, number of impacted unique devices, attempts, technical start and playback failures, Abandonment, and CIRR. Also, specify the asset details in the Ignore Asset containing field to remove assets that should not be tracked, for example, trailers and assets with known issues.
Note: The Ignore assets list supports up to 50 entries.
Image: Settings
After clicking Save, automatic insights for the broken assets identified based on the updated settings appear within one hour. Any automatic insights for the AI alert root cause groups identified based on the new settings appear instantly. Any automatic insights for the New App versions identified based on the new settings appear within one day.
-
From the Automatic Insights drop-down, click an insight to link to the related information or diagnostics page.
-
New App Version Performance links to Compare with SPI metrics
Note: The displayed App Version depends on the dimension passed to Conviva. Unknown appears when a dimension is not available.
Image: Compare App Version
The Compare page provides the toggle between number and percentage.
Image: Toggle number and percentage

The Compare page displays the data in Trends. Click Drill-in icon for the selected compare setting.
Image: Drill-in Icon
The Trends page appears with the metrics and data for the compare setting for further data analysis.
Image: Android dashboard
For more details about drill-down analysis,
-
Broken Assets to Trends
-
Alert Summary to AI Alert Summary
see Trends Dashboard.
-
-
Example Use Case
Clicking an insight links to the relevant page for additional diagnostics and information. For example, an alert insight link to the AI Alert page for that alert. Broken Asset insights link to Trends, filtered by that asset. App Version links to the Compare dashboard with metrics for the current and previous versions.
This example insight shows Vod as a highlighted root cause group in the Automatic Insights display.
Image: Automatic Insights
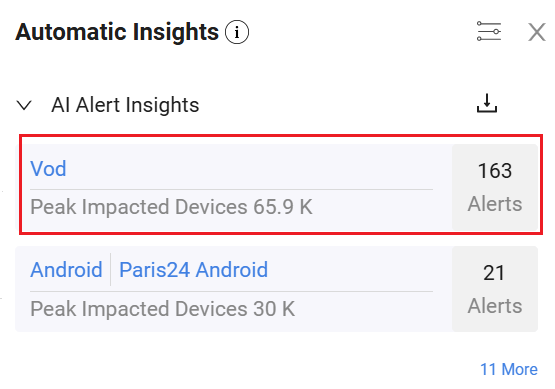
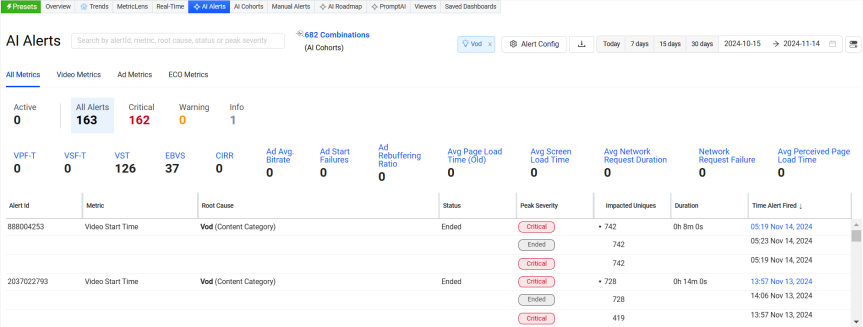
Click Vod to launch the AI Alerts page with alerts filtered to show only the recent Vod-related AI alerts.
Image: Vod Dashboard
Automatic Insights Automatic Insights Automatic Insights Broken Asset Broken Asset Broken Asset New App Version New App Version New App Version AI Alerts AI Alerts export AI Alerts Insights