AI Alerts is an advanced feature that eliminates the need to determine the thresholds, identify the relevant dimensions that you need to monitor, and set alerts to notify related individuals and groups.
The Conviva AI Alerting system continuously checks for anomalies and computes a baseline along with a range of variation for the metric(s) based on the mean and standard deviation derived from historical data. This range of variation is then used to evaluate the traffic in the past few minutes. If the upper boundary range or threshold is exceeded, an anomaly is detected, which then triggers the diagnosis process to determine if an alert should be fired based on the sensitivity control settings and the root cause of the event. To avoid duplication of alerts, the AI alert system suppresses the same alert from firing for up to 1 hour.
Note: Each AI alert cohort requires an on-going minimum of 25 attempts, concurrent plays, or ended plays during each 1-minute interval to qualify for alerting based on the AI alert sensitivity settings.
For each generated alert, the system provides the sessions that attributed to the dimension (or set of dimensions) associated with the root cause of the alerts and the viewers that were impacted due to the alert.
Each AI alert is assigned an alert severity (Info, Warning, Critical) that can help you determine the impact of the alert condition. By default, all alerts fire with the Info severity until the thresholds for Warning and Critical are set. As alerts fire, the AI Alerts page displays the alerts totals for each severity level and related metric, and continuously updates the totals as the alert conditions change. When an alert condition returns to the accepted range of variation and sensitivity control limits, the AI alert ends and is listed in the Alert Ended totals to indicate that the alert condition cleared. The specific threshold for each severity level is configured in the sensitivity controls. For more details on setting the sensitivity controls, see AI Alert Sensitivity .
The alert totals show the alerts for the last 30 days.
This topic includes the following sections:
- Viewing AI Alerts List
- Searching AI Alerts
- Viewing AI Alerts Diagnostics
- Impacted Sessions Due To Alert
- AI Alert Email Subscription
- Webhook Integrations
- AI Alert Forwarding
- Providing Feedback
This feature offers automatic anomaly detection and fault isolation across the following key metrics and key dimensions:
| Metrics |
|
|---|---|
|
Dimensions (Root-cause) |
Video
Ads
|
Note: AI Alerts with a root cause of "Assets" display 0 as the baseline and threshold in the UI, using a static backend threshold. These settings reflect the static aspect across asset viewer levels. Contact Conviva Support to modify these settings for specific AI Alert conditions.
AI alerts also support the use of customized dimension cohort combinations selected from a list of all scanned dimension values. For More information on AI alert custom dimensions, see AI Alerts Custom Dimensions.
AI Alerts fired for the regional ISP and city dimensions improve your ability to diagnose root cause analysis, for example tracing the root cause to a specific regional ISP and city rather than only the DMA group. As a result, you can see alerts associated with root causes from city only; regional ISP only; regional ISP and city; CDN and regional ISP; and CDN, regional ISP, and city. The DMA group dimension is no longer supported.
The Channel and Streaming Protocol dimensions support the following root-cause combinations:
- CDN: Channel: Protocol
- CDN: Channel
- CDN: Protocol
- Channel: Protocol
- Channel
- Protocol
PCP Alerts works with the following (dimensions) root-cause combinations:
-
VoD
-
VoD+CDN
-
VoD+OSFamily
For More information on AI alert custom dimensions, see AI Alerts Custom Dimensions.
For a detailed definition of these metrics, see the Metric Dictionary.
Viewing AI Alerts List
-
To view the AI Alerts summary page:
-
Click a severity level or metric total to filter the alert display for that combination of severity and metric. For example, filter alerts for specific severity level(s) (warning) and metric (CIRR).
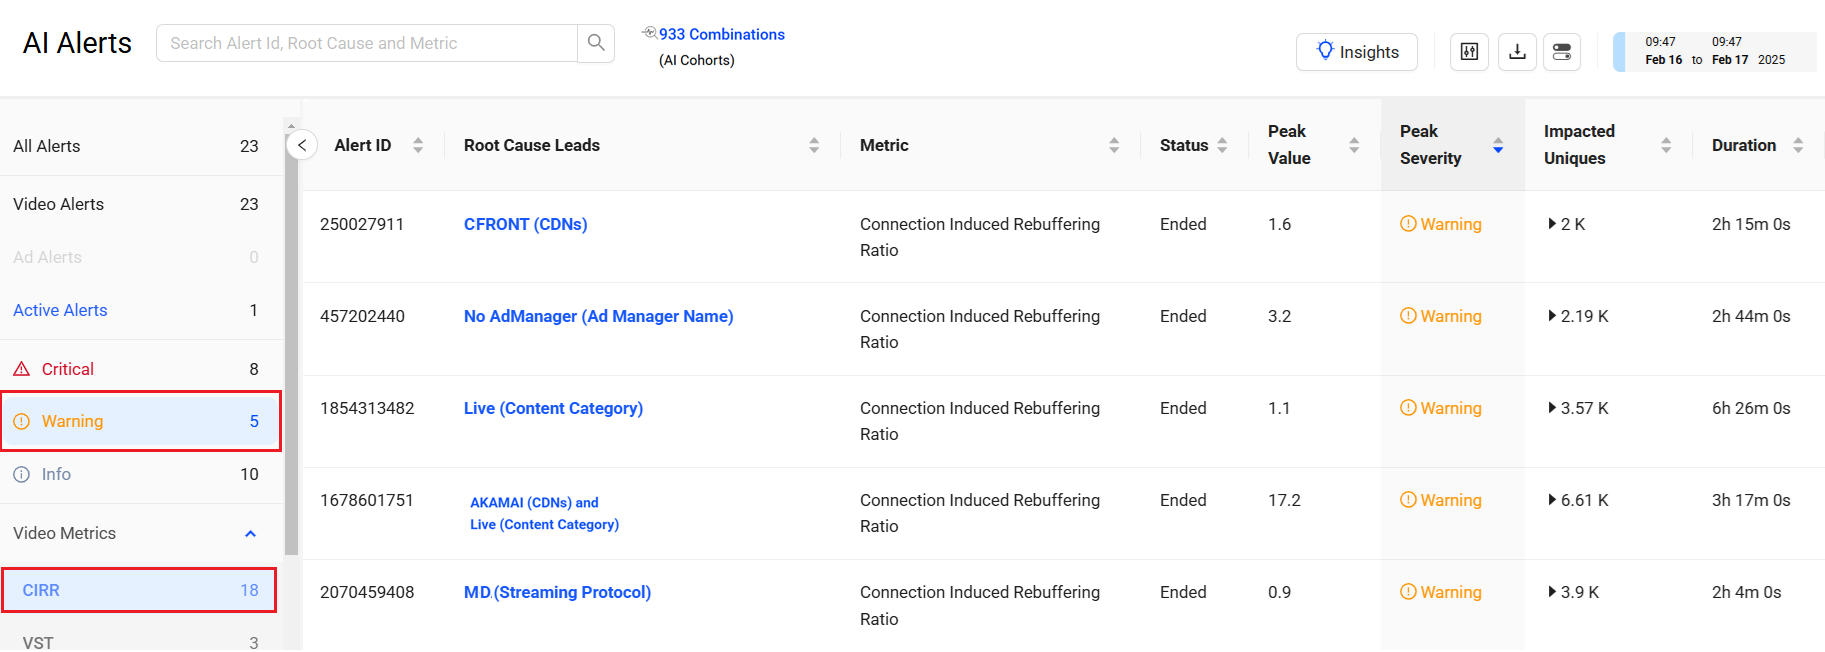
The AI Alerts page shows the total number of fired alerts along with the alert totals by severity level and metric for up to the last 30 days.
Each alert instance provides following AI alert information:
- Customer: For CDN Partners, displays the customer impacted by the alert.
- Account: Name of the account impacted by the alert.
- Metrics: Name of the metric for which the AI alert fired.
- Metric value: Metric value that caused the AI alert to fire.
- Root cause: Dimension(s) that caused the AI alert to fire.
- Severity: Critical, Warning, Info
- Cumulative Impacted Unique Devices: The cumulative total of devices impacted by the issue at the time the AI alert fired.
- Time alert fired: Date and time that the AI alert fired, linked to the detailed Diagnostics page for the alert.
By default, the alert instances are sorted by time the alert fired, with the most recent instances at the top. You can also customize the alert display by clicking on a column name, severity level summary or metric summary.
As the AI alert conditions change, the alert severity updates to show the latest severity level. When an alert condition returns to the accepted range of variation and sensitivity control limits, the AI alert ends and is listed with Status Ended to indicate that the alert condition cleared.
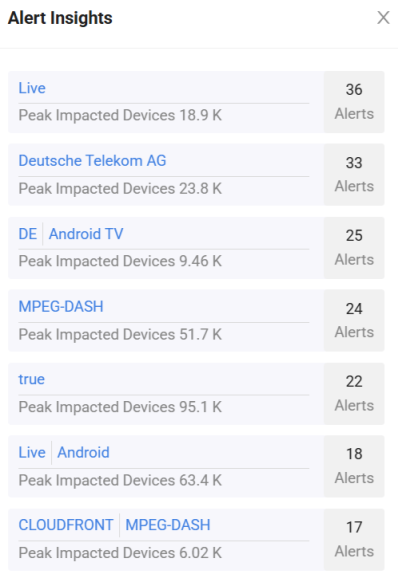
Click Insights to access the AutoInsights data.
Alerts Mapping
The alerts mapped to BigPanda are as follows
| Severity | Status |
| P1 | Critical |
| P2 | Warning |
| P3 | Warning |
| Not Set | Warning |
Root Cause Analysis
Diagnosing an AI alert starts with examining the information in the initial AI alert message and interpreting the dimensions in the alert title, and then, if necessary, inspecting the diagnostic details of the alert to determine if the root cause of the alert can be further isolated to a specific player, operating system, or browser. In the case of alerts with only a CDN or Asset as the root cause, no further diagnosis is required to determine this type of root cause. However in other cases, further diagnosis, such as narrowing OS, browser, and player levels, or analyzing the time series, can often help to narrow the root cause and troubleshoot the progression of the alert condition.
For each generated AI alert, the system displays the dimensions attributed to the root cause, and for further analysis provides a diagnostic time series of the metric variations leading up to the alert firing and continuing past the end of the alert. The AI alert system also displays a list of sessions that were impacted due to the alert and the device metadata associated with sessions to help you further isolate the root cause levels.
Issue Convergence
AI alerts that fire within several minutes of each other for the same metric are possibly related to the same root cause. As an alert condition progresses, the AI alert system performs continuous fault isolation and root cause analysis to detect if the initial dimensions have converged to further isolate the source of the alert. In the example below, after the initial Video Startup Time AI alert fired on August 1st at 02:57 with the root cause dimensions of Roku and Live, another Video Startup Time AI alert fired two minutes later at 02:59 with more impacted unique devices, as the root cause dimension converged to only Live traffic. This convergence indicates that within several minutes the AI alert system determined that the initial Video Startup Time alert that was not limited to Roku players and Live traffic, but was isolated to all players with Live traffic.
Initial AI Alert: Roku Live
Converged AI Alert: Live

AI alert convergence may take up to several minutes depending on the complexity of the AI alert condition and scope of the impact across OTT system levels. When initially interpreting an AI alert, check for neighboring alerts to determine if alerts have converged. If convergence occurred, use the latest alert and root cause for further diagnosis.
Searching AI Alerts
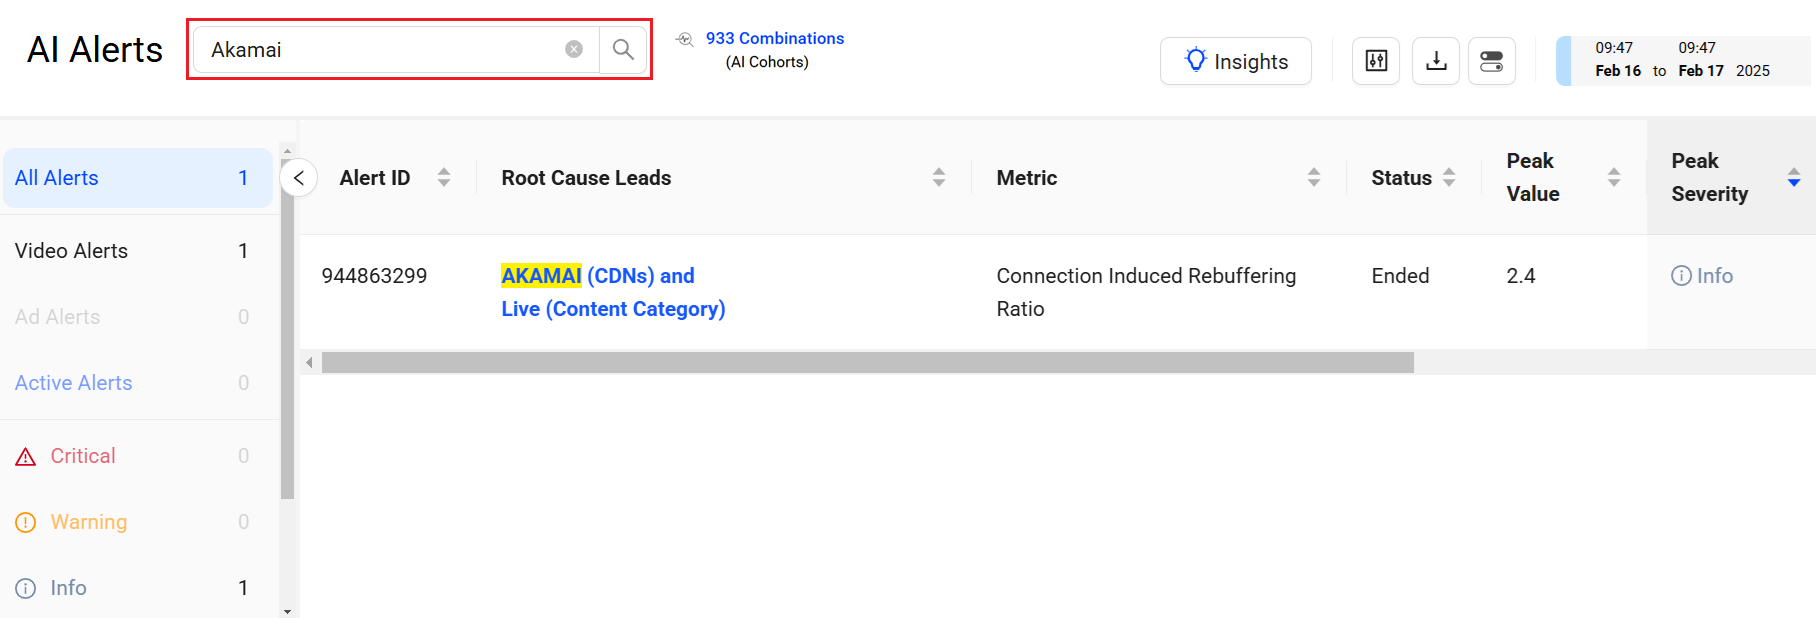
The AI Alerts page allows you to perform searches by the Root Cause, Metrics and Time Alert Fired fields.
-
To search the alerts:
- Select the desired date range.
- Type a search term such as iPhone or AKAMAI in the search box, and press Enter.
- To clear your search and see all alerts diagnostics again, click the cross clear the search box and press Enter.
Note: If your search yields no results, click the search box and press the Enter. This will re-populate the list with all alerts.
AI Alerts Custom Dimension
Custom dimensions enhance AI Alerts to display the list of scanned dimension values and dimension combinations analyzed by the AI alert system, and allow the addition of new dimensions and dimension value combinations. You can configure custom dimensions as single dimensions or in groups of two or three dimensions to focus AI alerting on specific performance areas, such as an underperforming channel OS family combination.
To clarify the AI alert process, the AI Combinations page shows the available dimension groups and dimension value combinations in groups of single and combined values so you can better understand the AI alert scanning process and the valid dimension/value combinations actively monitored for AI alert conditions.
For more information on AI Alerts custom dimension, see AI Alerts Custom Dimension.
Viewing AI Alerts Diagnostics
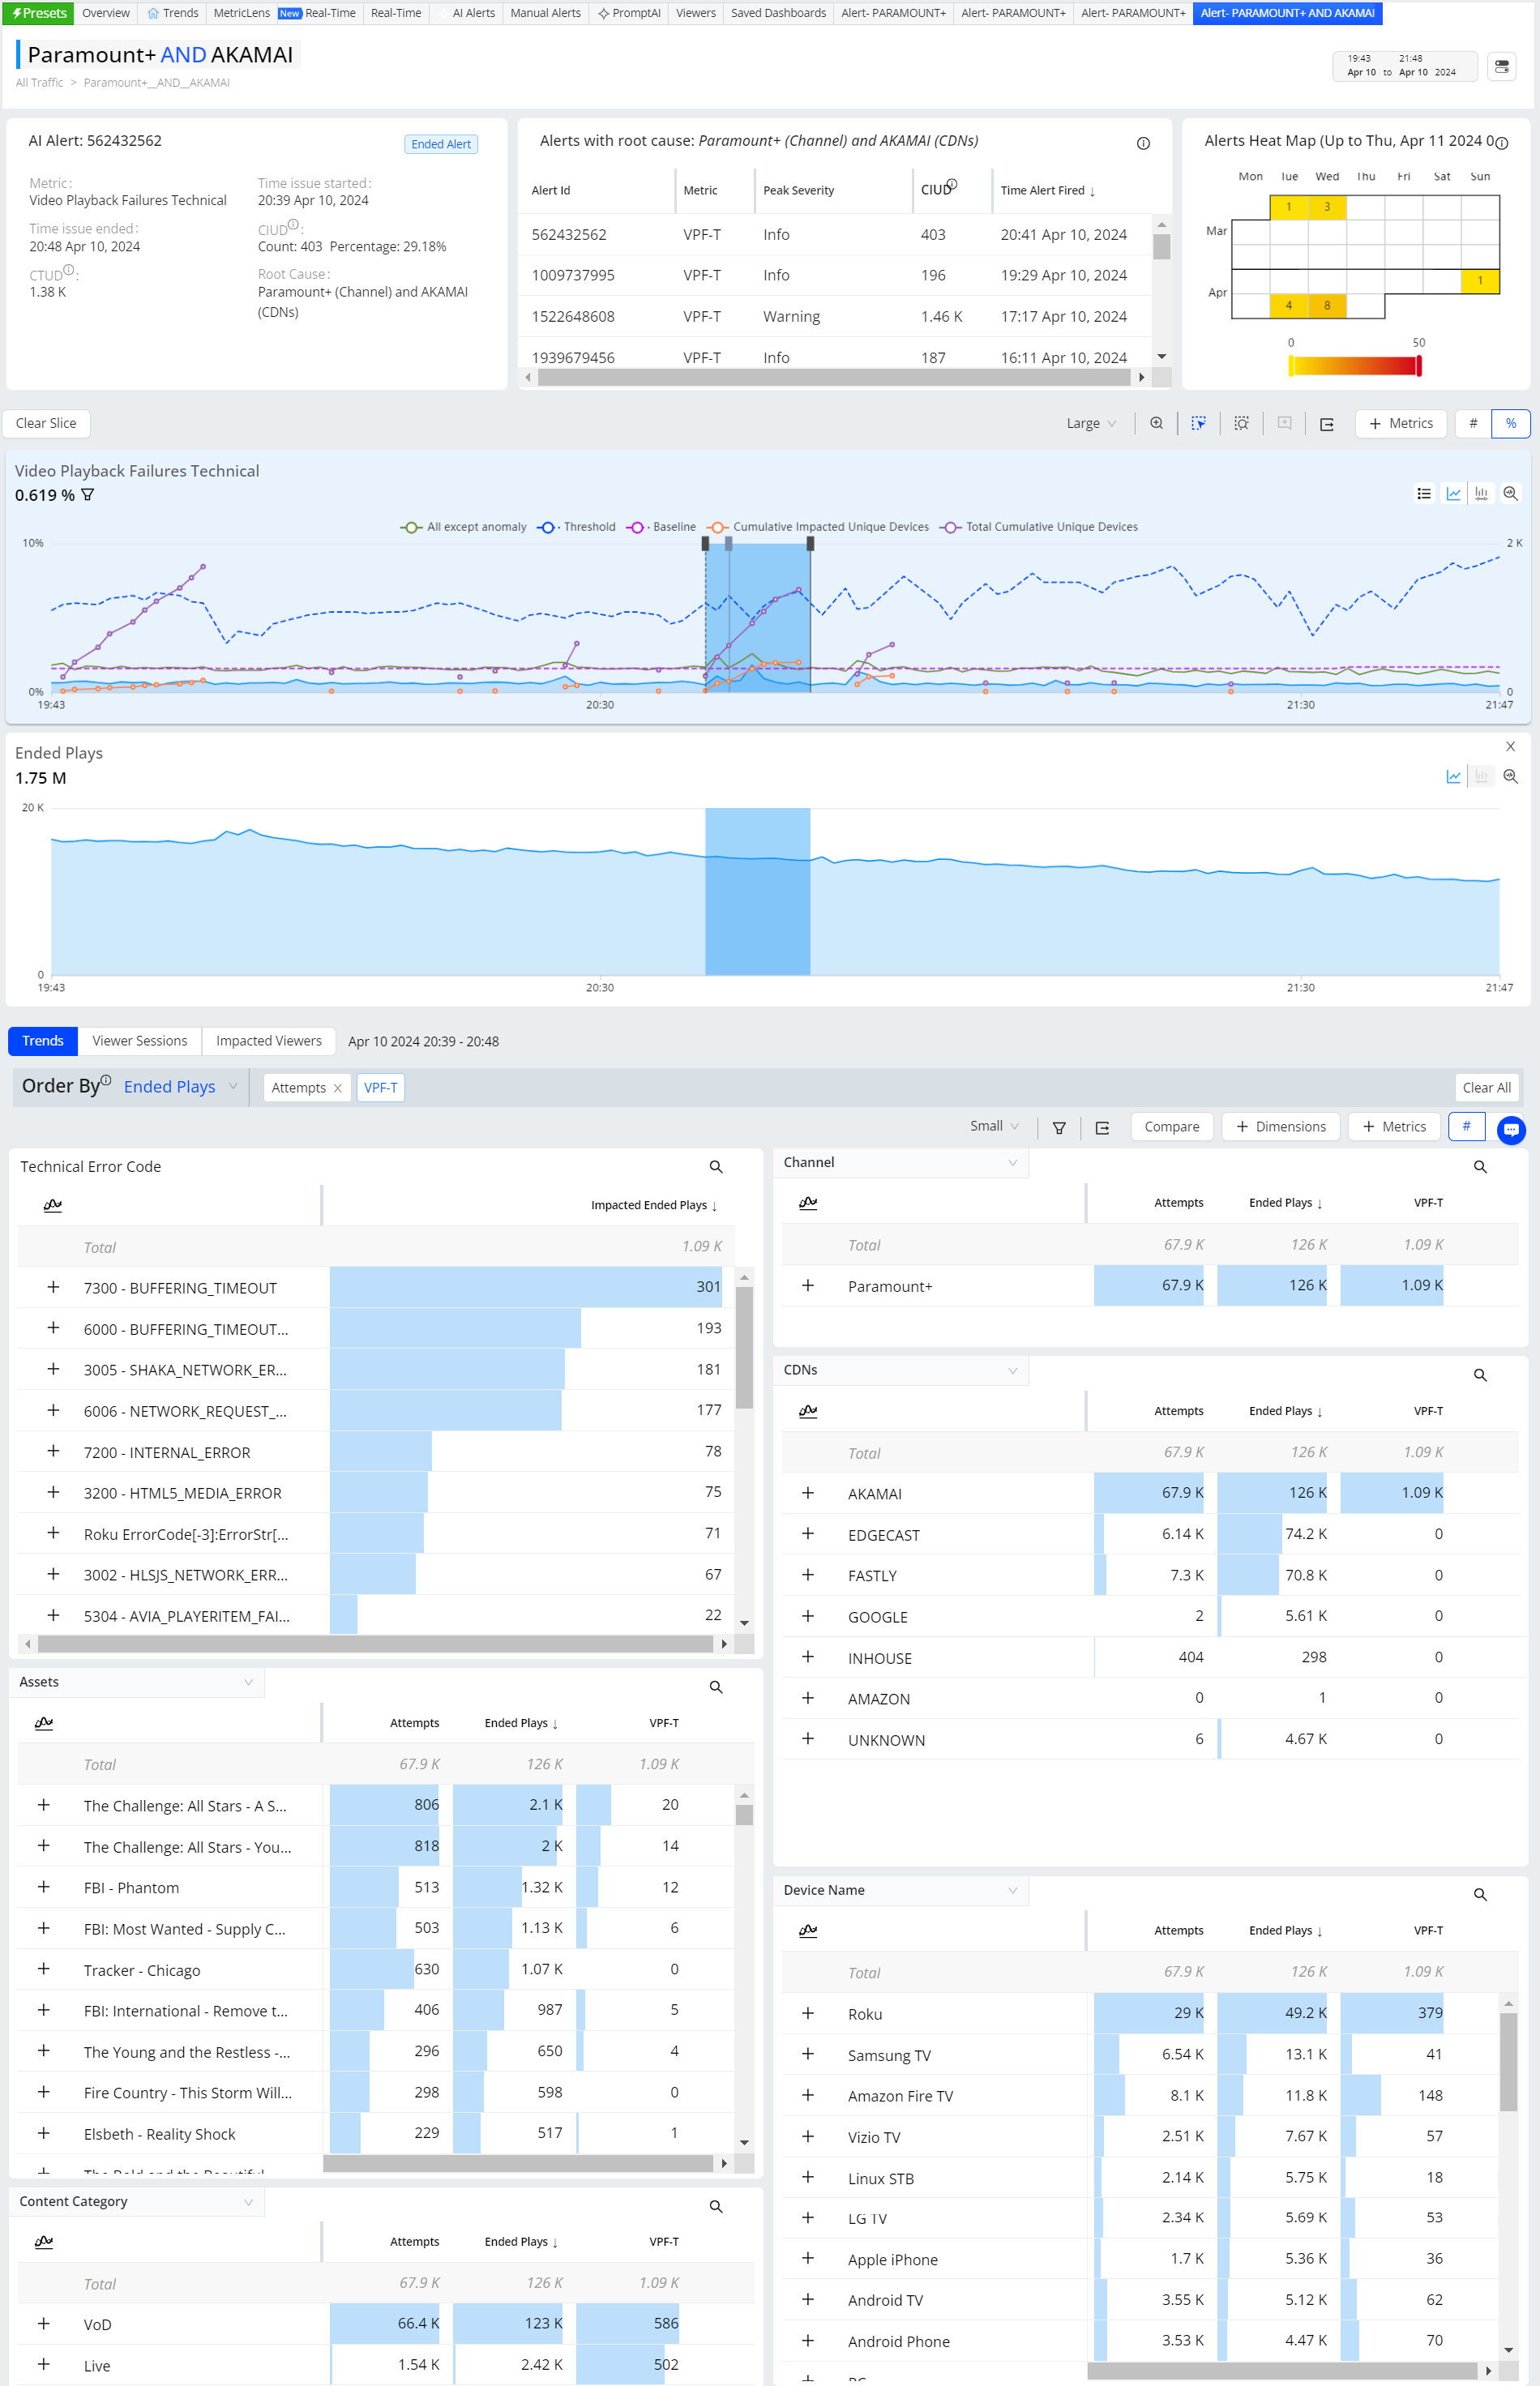
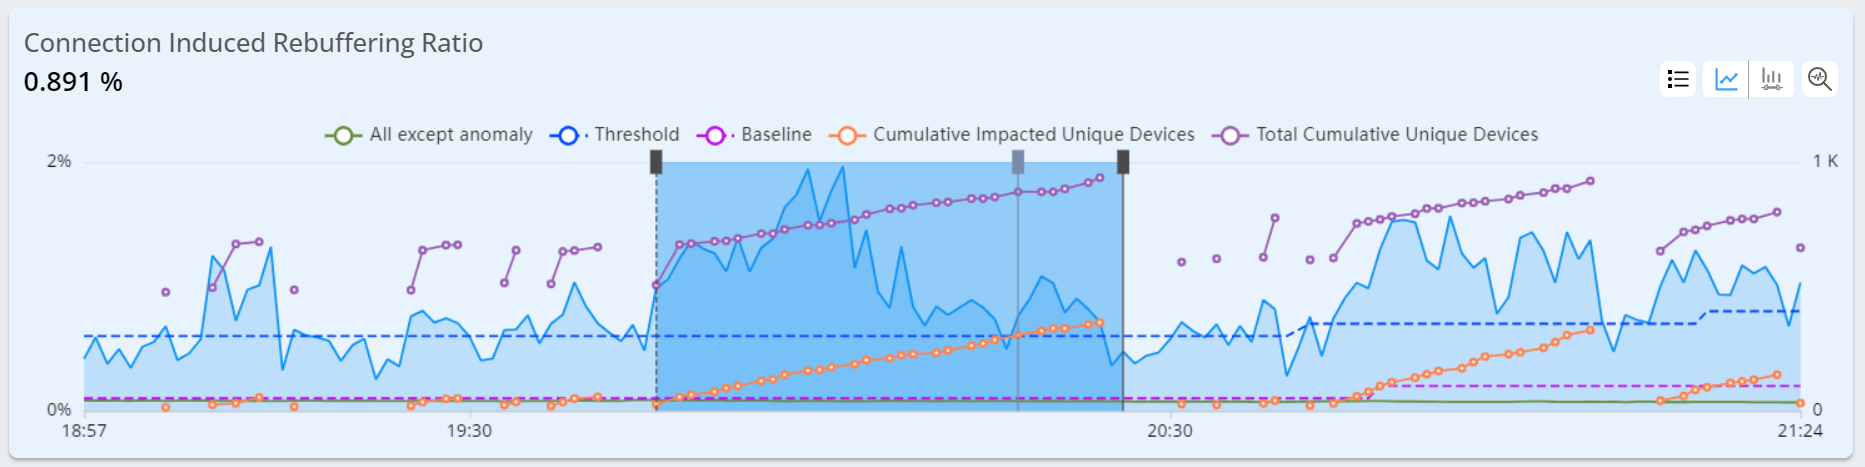
The AI alerts diagnostic page enables you to drill into the alert details with a data snapshot at the time the alert fired, a times series chart depicting the alert firing sequence expanded to one-minute intervals, and data illustrating the alert conditions, such as metric baseline and range of metric variance. When available, a second time series is shown for a related metric.
-
To diagnose an AI alert from the Diagnostics page, click the Time Alert Fired column for one of the alerts. The Diagnostics page appears and displays the alert details.
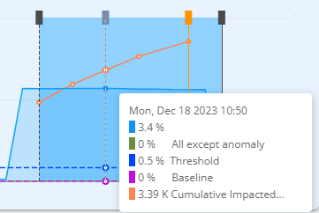
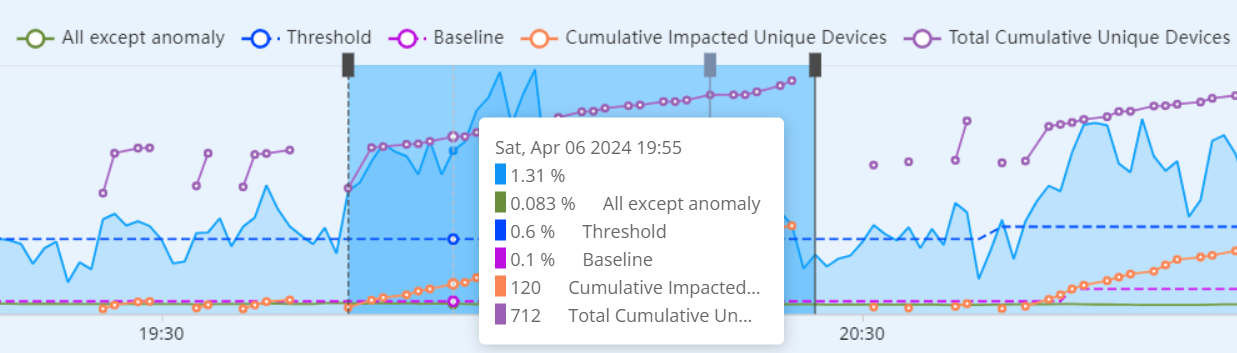
Hover over points in the time line to display detailed data.
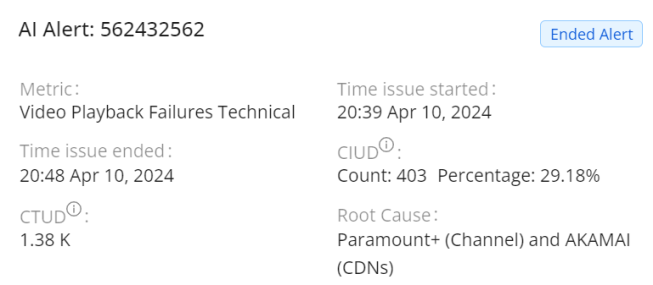
The AI alert data is a snapshot at the time the alert fired, the metric value, severity, and data do not reflect any subsequently impacted sessions. The AI alert percentage is the percentage of sessions within the root cause group that were impacted by the alert. For example, in the sample data snapshot, a Video Playback Failures percentage of 28.74% indicates that 28.74% of all the sessions using this channel and DASH (the root cause group) were impacted.
Time series of the metric that caused the alert to fire, with one minute data intervals for a two hour window, and severity-colored vertical bars showing the time when the alert reached each severity level. Drag the timestamps at the ends of the time series to zoom in on a more granular time period.
The AI alerts diagnostics page, displays the standard dimensions, root cause dimensions and created custom dimensions. You can use the dimension button in the drill-down section to specify the dimensions you want to see.
Cumulative Impacted Unique Devices (CIUD)
Cumulative Impacted Unique Devices (CIUD) refers to the cumulative total of devices impacted by the issue at the time the AI alert fired.
Cumulative Total Unique Devices (CTUD)
Cumulative Total Unique Devices (CTUD) refers to the total number of unique devices active under the filter group during the specified period that were relevant to the alert activity.
For example, consider a page load AI alert; the relevant unique devices are active devices with page loads.
Concurrent Plays Al Alert Diagnostics
For Concurrent Plays, the alerting is based on the seasonality traffic pattern, which depends on the projected concurrency based on a smoothed estimate of the previous 7-day plays and the most recent concurrency. Concurrent Play AI alerts are triggered based on the percentage of concurrency decline vs the projected concurrency. Time line bars indicate the amount of decline in each interval.
Note: Concurrent Plays AI alerts require at least 2,000 continuous concurrent plays in the 60-second intervals during which concurrent plays are calculated for alert activation.
Conviva uses machine learning to compile a concurrency baseline (T-7 dashed blue line), which is determined using weighted comparisons with the previous 7-day concurrency and the most recent concurrency. Projected concurrency (dashed purple line) is a proprietary algorithm based on a combination of derivatives and multipliers of multiple historical time series to calculate an estimated predicted concurrency. This is used to calculate the difference from the actual, for which the percentage drop (PCP Drop) fires an alert when the percentage crosses the threshold while maintaining persistence.
Concurrency for VoD traffic is compared separately to optimize concurrency alerting for different video types. For example, an AI alert for Concurrent Plays on a Sunday is compared with the concurrency from the previous Sunday along with the most recent concurrency.
In this example, the upper dashed-line for projected concurrency shows a dramatic drop with the actual concurrency, which generated the AI alert.
The hover data snapshot displays concurrent plays data at the time the alert fired along with the percentage drop.
Impacted Sessions Due To Alert
The Diagnostics page also shows a list of up to 500 sessions that were impacted by the detected issue.
The system starts to compute impacted sessions for an alert as early as several minutes before the alert is fired. At each minute, the system computes all the sessions that are considered impacted within that minute and appends those sessions to the list of impacted sessions. This process repeats each minute until the total number of impacted sessions exceeds 500 or the detected anomaly ends.
The criteria for a session being impacted are defined per metric. For VSF alerts, all the VSF sessions are considered impacted. Similarly, all the EBVS sessions are considered impacted for EBVS alerts. For CIRR and VST alerts, only the sessions whose corresponding metrics are higher than the expected variances are considered impacted, and only the most impacted ones are picked if there are more than 500 impacted sessions within a minute.
For all AI alert metrics, the Subset of Impacted Sessions due to Alert table provides the following information:
- IP address: This is the IP address of the device streaming this session. If IP address is not made available by publisher then this field is blank
- ViewerID: This is the viewer/customer id passed to Conviva from publishers. If the viewer id has not been passed during device integration then this field is blank
- CDN: This is the CDN used for playback.
- ISP: This is the ISP that the end user device is connected to.
- ASN: This is the ASN that the end user device is connected to.
- City: This is the city location of the end user device.
- State: This is the state location of the end user device.
- Country: This is the country location of the end user device.
- Device: The device used to view this video session.
- Asset: The name of the impacted video asset.
- Stream URL: The URL of the video stream.
- Error Code: The error codes related to the alert.
- Error Message: The error messages related to the alert.
- Session Start Time: Time the session started.
- Time Session Impacted: The timestamp for when the session was impacted.
- Severity: Severity level of the alert.
- Device Marketing Name: The marketing name of the device.
- Player Framework: The name of the media player framework.
- Browser Name and Version: The name of the browser on the device with the browser version number.
- App Name and Version: The name of the player application on the device with the application version number.
- OS Name and Version: The name of the operating system on the device with the OS version number.
For Connection Induced Rebuffering Ratio and Video Startup Time metric based alerts, this table sorts the sessions with the highest metric values at the top and provides the following additional information:
- Metric value
- StreamURL: The URL of the video asset. It represents the manifest URL for adaptive streaming protocols, such as HLS and Dash.
For Video Start Failures metric based alerts, this table sorts the sessions by CDN (unsorted for single CDN) and provides the failure error code. This is the error code that resulted in video start failure for this session. Note that this information is shown only when the AI alert is related to a video start failure.
For Exits Before Video Start, this table sorts the sessions by CDN (unsorted for single CDN).
Viewing AI Alerts List
To view the AI Alerts summary page
- Log in to Conviva VSIand select Alerts > AI Alerts OR
- Click the Insights. The number next to the bell indicates the total number of AI alerts fired today.
Each alert instance provides following information for each AI alert fired for a metric:
- Metric value: Metric values that caused the AI alert to fire.
- Root cause: Dimension(s) that caused the AI alert to fire.
- Cumulative Impacted Unique Devices: The cumulative total of devices impacted by the issue at the time the AI alert fired.
- Time alert fired: Date and time that the AI alert fired, linked to the detailed Diagnostics page for the alert.
By default, the instances are sorted by time the alerts fired, with the most recent instances at the top. You can also toggle the display order by clicking on a column name.
Searching AI Alerts
The AI Alerts page allows you to perform searches by the Root Cause, Metrics and Time Alert Fired fields.
- Type a search term such as Dash in the search box, followed by the Enter key.
- To clear your search and see all alerts diagnostics again, clear the search box and press the Enter key.
Note: If your search yields no results, click the search box and press the Enter key. This will re-populate the list with all alerts.
AI Alert Email Subscription
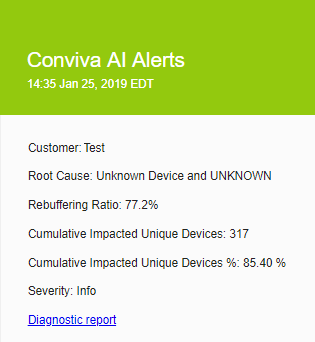
Once an alert is fired, an email is immediately sent to the subscribed users. Individual users can subscribe to AI alert emails by selecting specific metrics or all available metrics. The system guarantees that an email is sent to each recipient within 10 seconds after an issue is detected. Within the alert email, an alert summary is provided, which includes the metric, the root cause of the issue, and the number of impacted sessions.
Note: The AI alert email subscription settings do not impact the manual alert settings. For manual alert settings, see Alerts.
-
To manage user AI alert email subscriptions, in the Settings menu click Email Subscription.
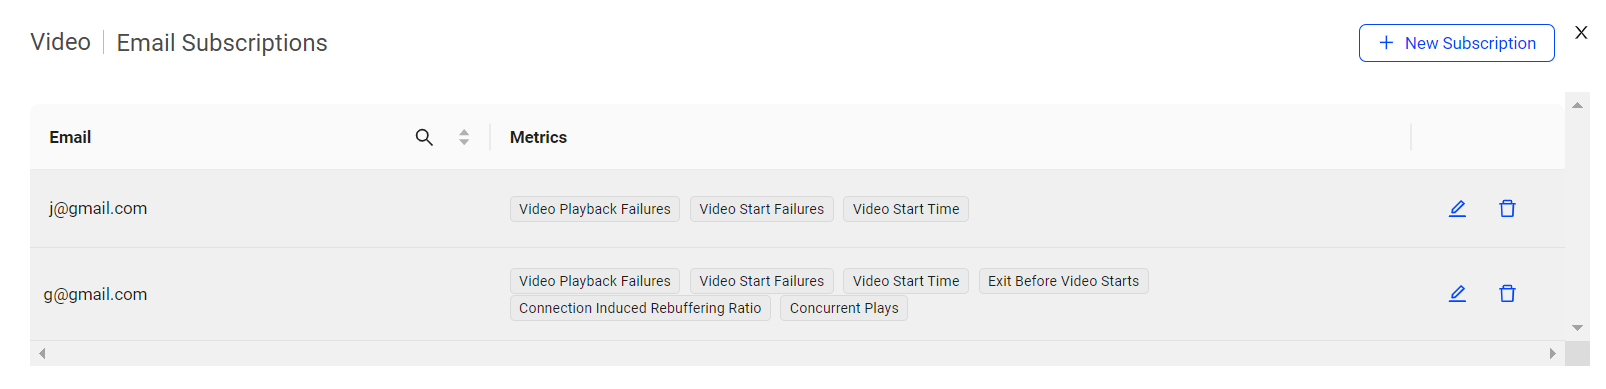
The AI Alerts Email Subscription page appears with a list of the configured email subscriptions along with the configured metrics.
-
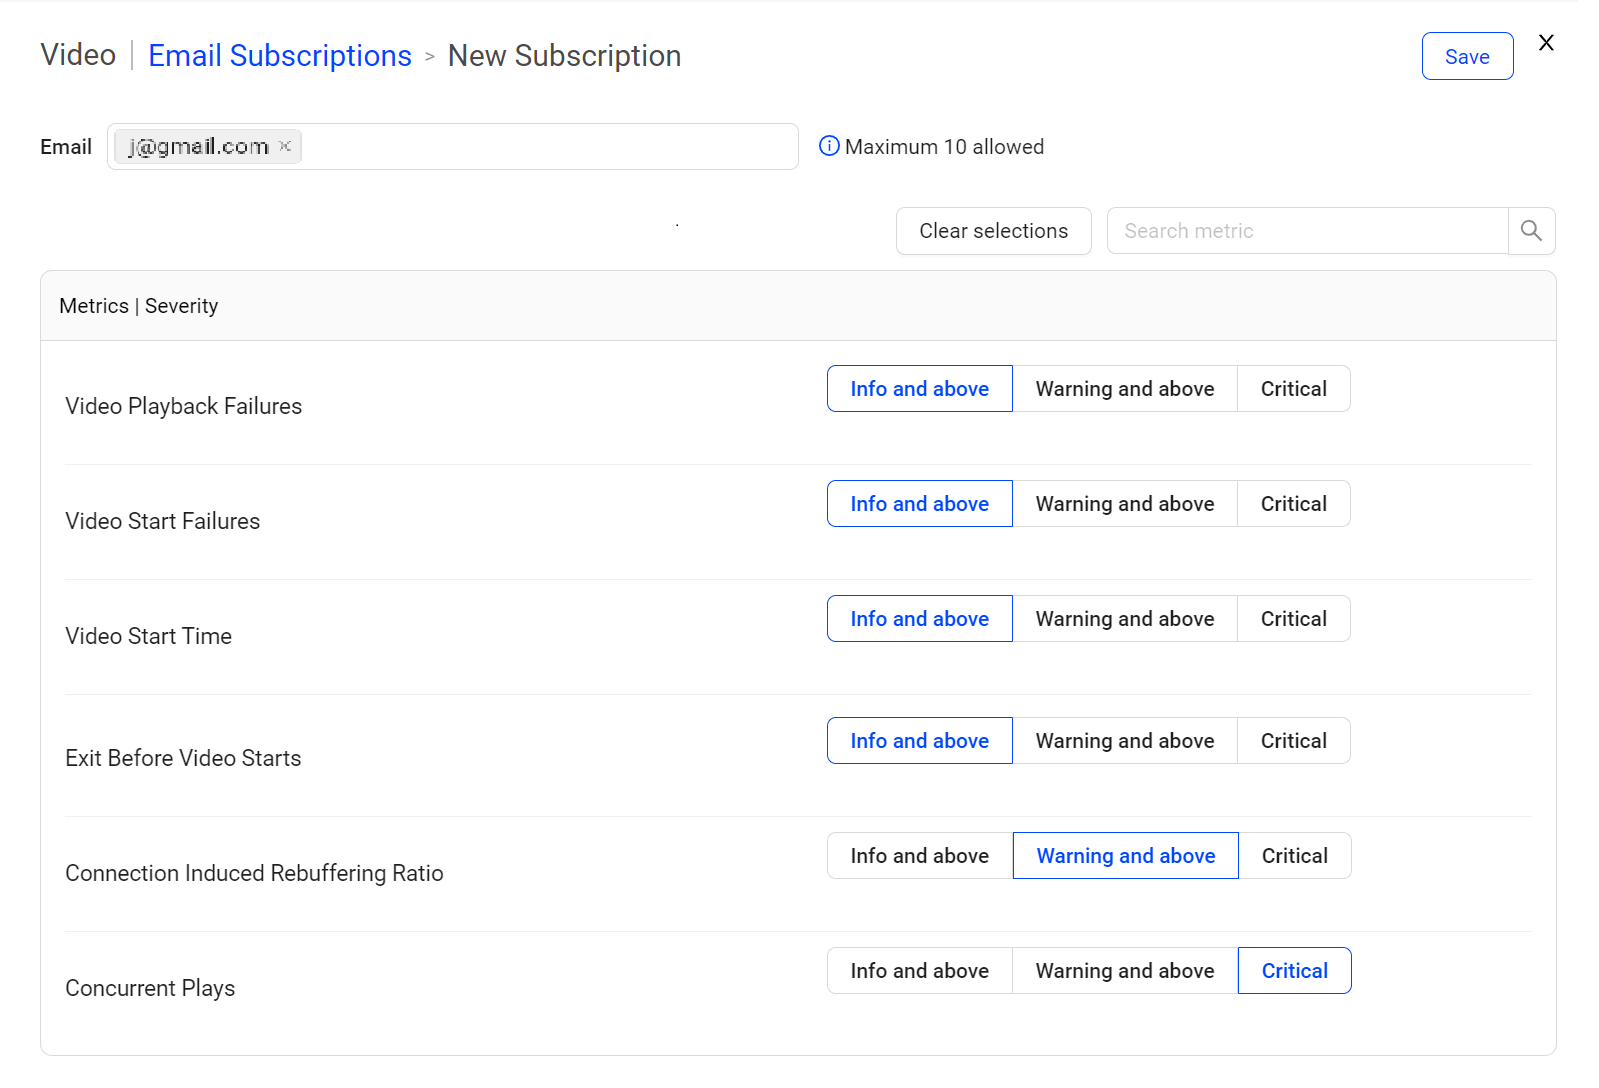
To add new email subscriptions, click New Subscription, to see the New Subscription page.
Note: Admins can add up to 10 email addresses simultaneously.
Note: The availability of AI alerts for Concurrent Plays is limited. To enable this feature, please contact Conviva.
-
Enter the email addresses in the Email field.
-
Select the desired metric severity levels. All severity levels are set to Info and above as default and apply to any existing AI alert subscriptions.
-
Click Save to set the email subscriptions.
Once you receive the AI alert email, click the Diagnostic Report link to view the root cause details and the impact of the issue.
Note: There may be a potential delay of up to 6 to 10 minutes between issue occurrence and alert notifications.
Webhook Integrations
Admin users can also set webhooks to integrate Conviva AI alerts into external applications, such as JIRA or other support ticket applications.
To setup webhooks, see Setting Webhook Notifications.
Diagnostics
AI Alerts within the metric widget time series, provides the vertical bar indication of the fired alerts. Click the bar to jump directly to the AI Alert diagnostics to analyze alert frequency and details.
Click the Dimension button to specify the dimensions to display. The dimension associated with the root cause group is automatically displayed as the first dimension. The dimension selector displays standard dimensions, root cause group dimension, and any added custom dimensions.
The standard dimensions are:
-
Assets
-
Device Name
-
Content Category
-
CDNs
-
ISPs
-
Device Operating System Family
For more information on diagnostics of the AI alerts, see AI Alert diagnostics.
AI Alerts AI Alerts AI Alerts Root Cause Analysis Webhook Integrations AI Alert Email Subscription diagnostics