With VSI, streaming executives and others optimizing overall performance can easily monitor overall operational performance metrics, content audience levels, and ad experience through customized executive-level displays and scheduled email reports.
| Executive Features | Description |
|---|---|
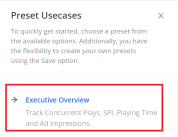
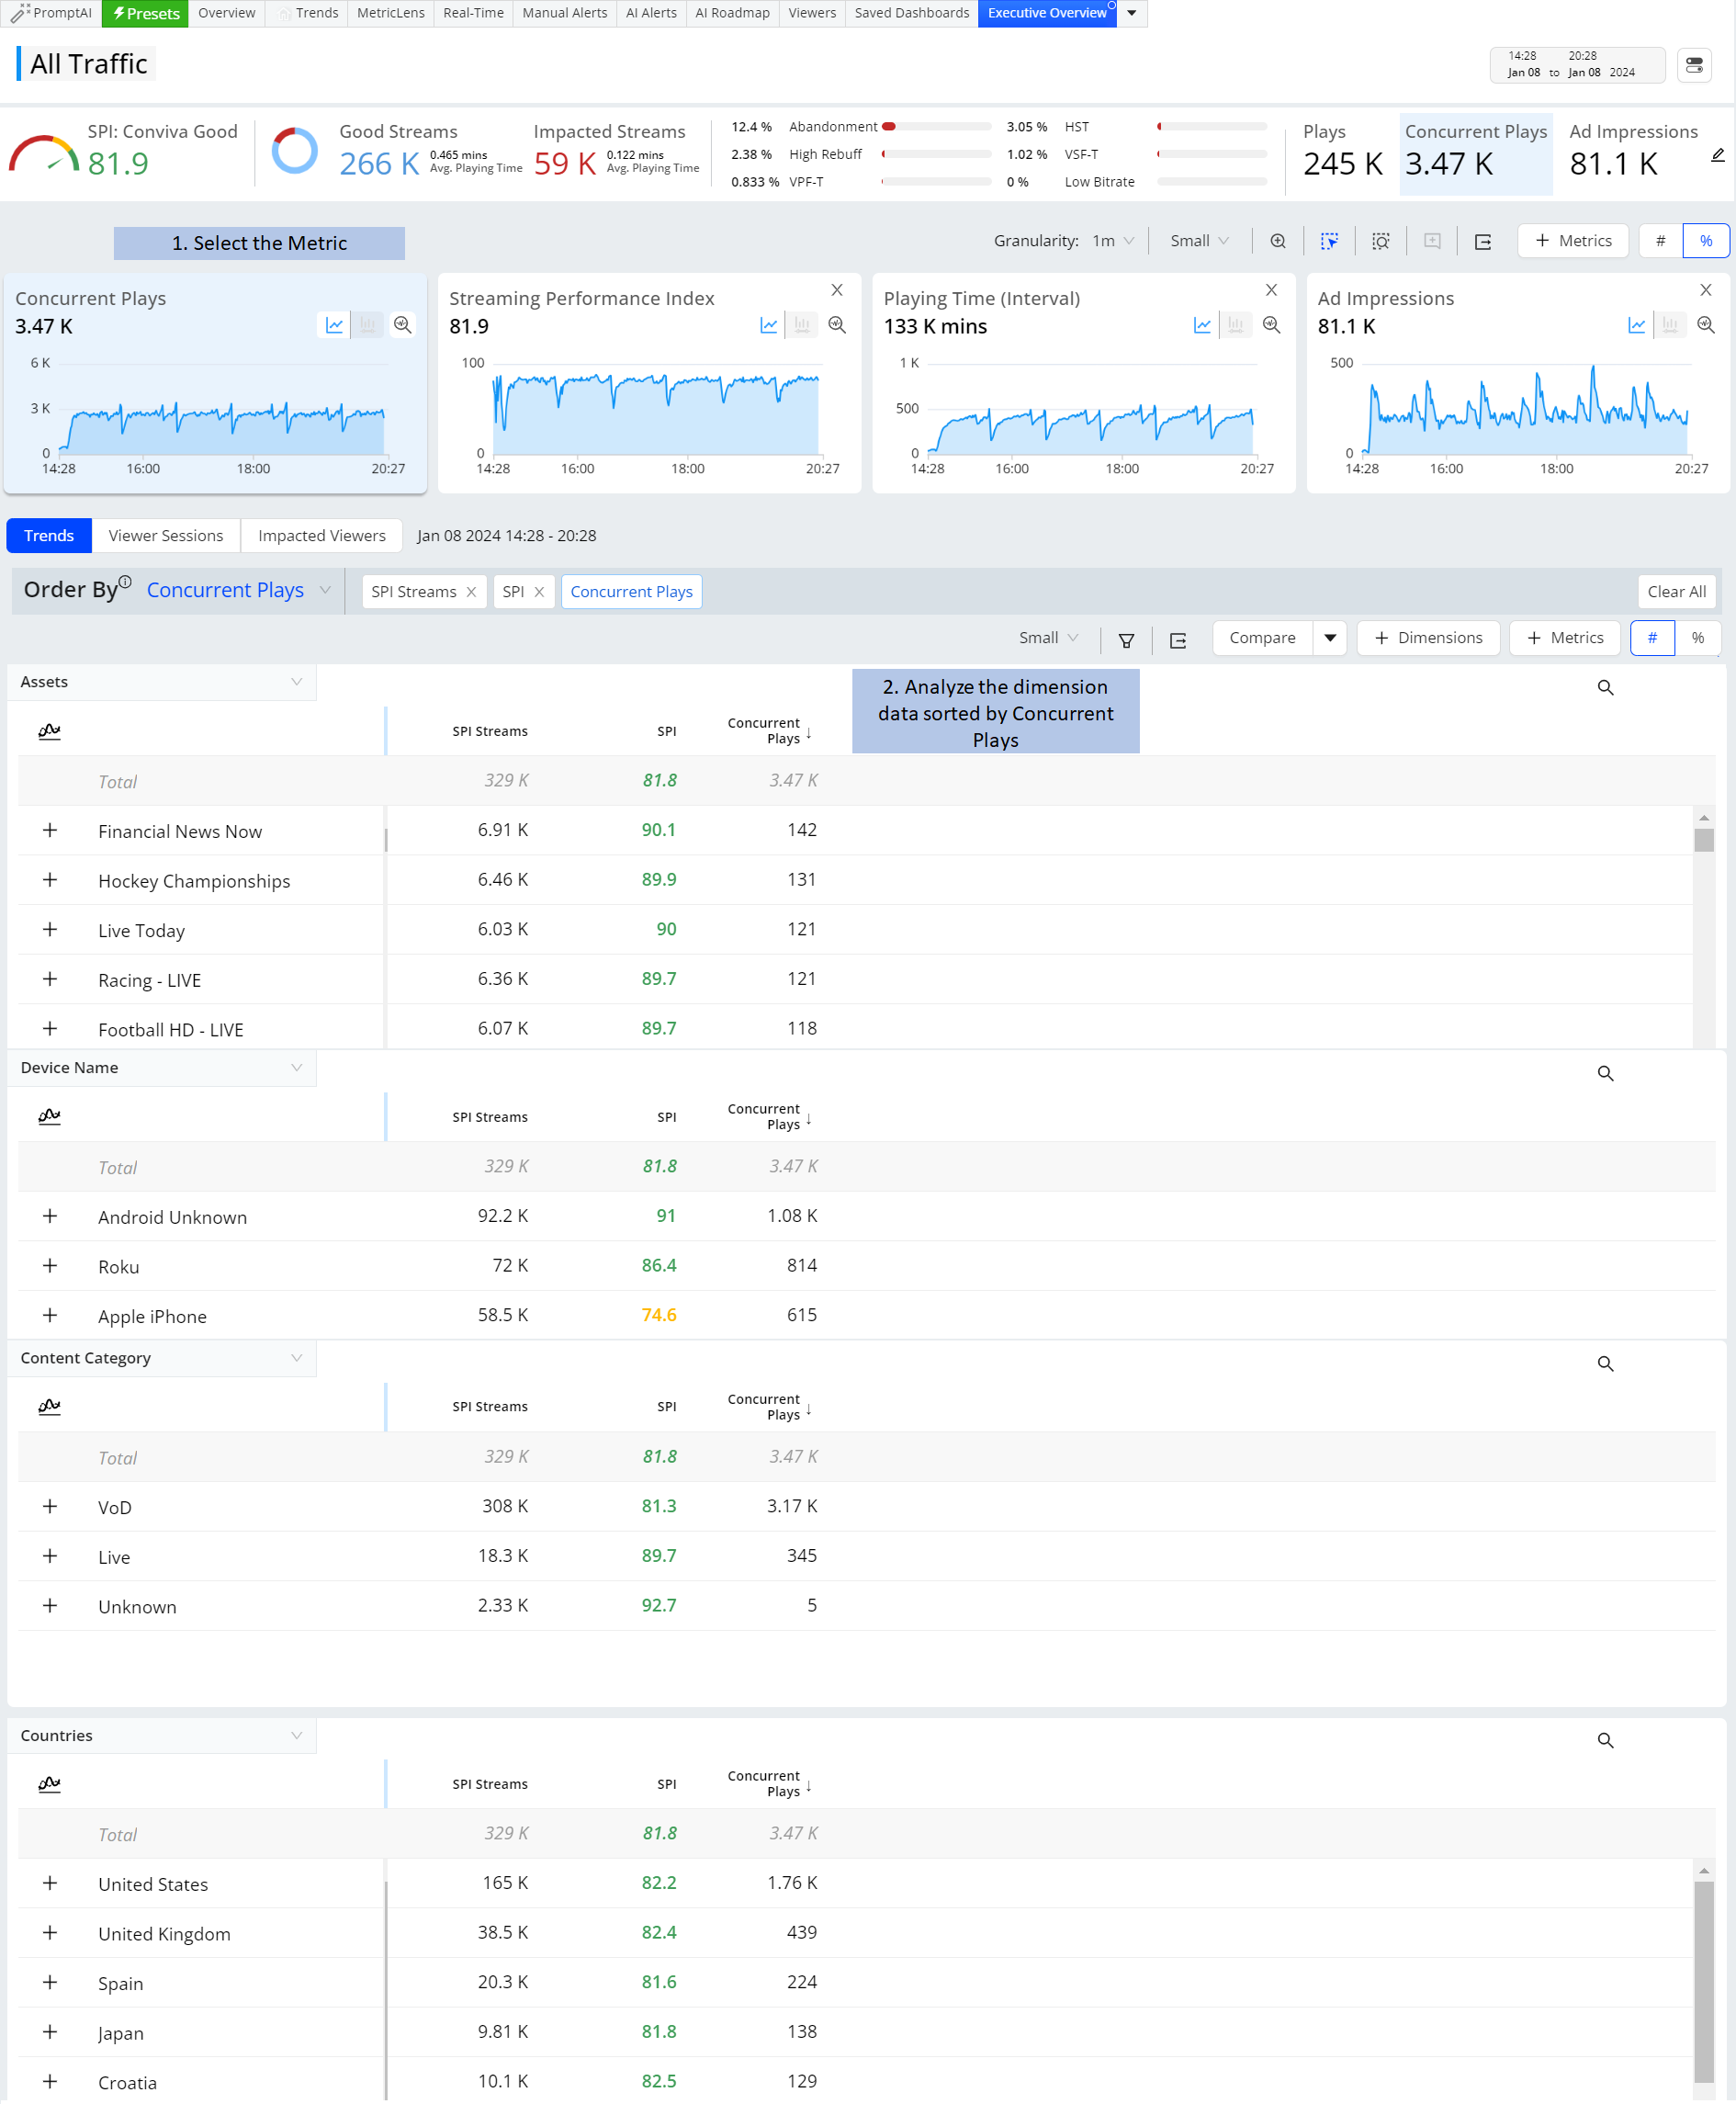
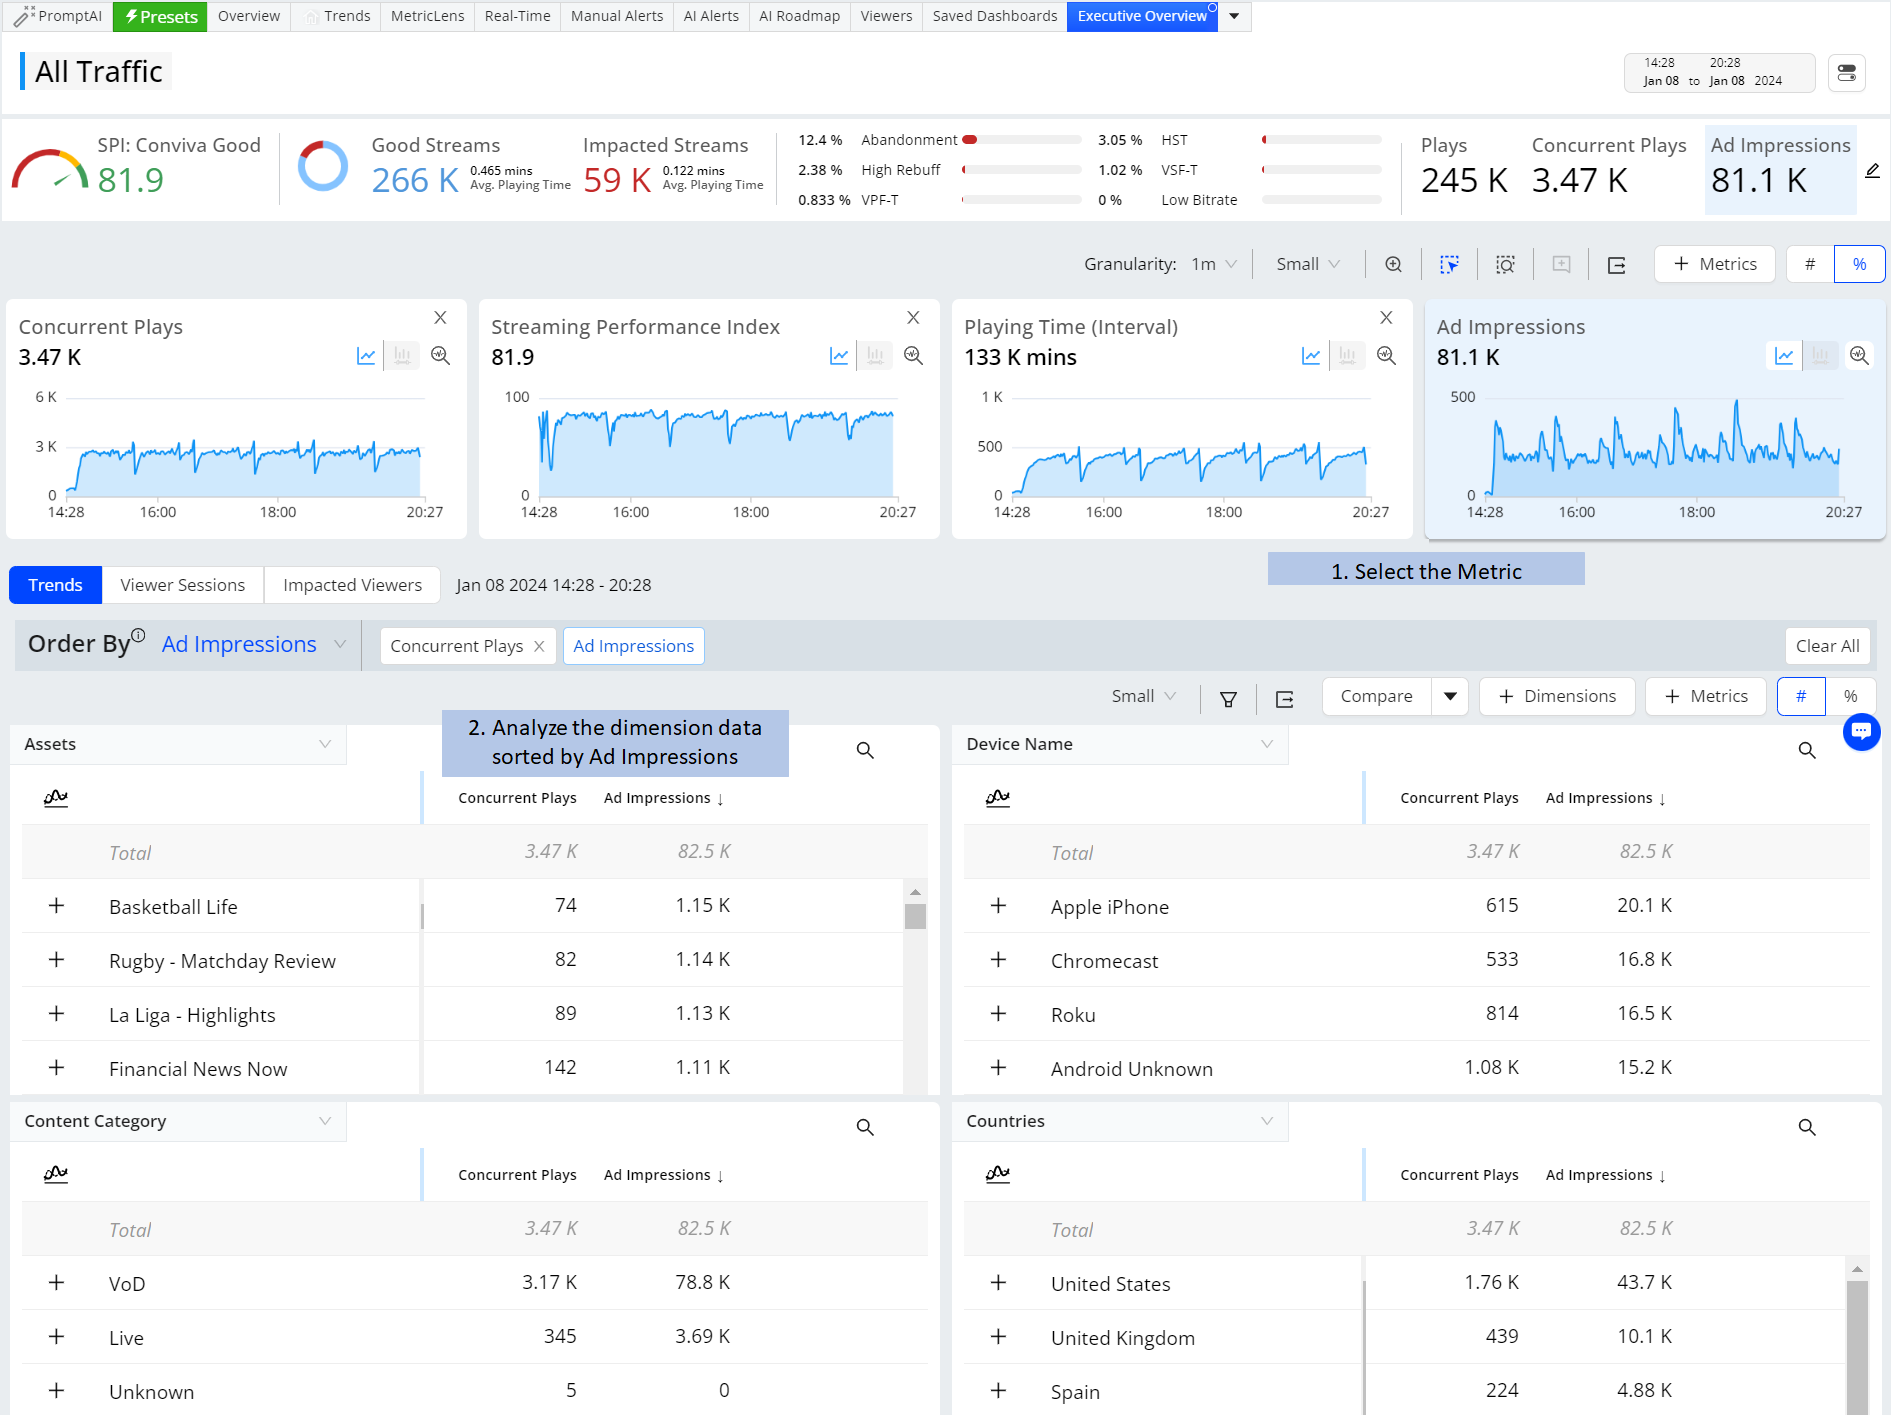
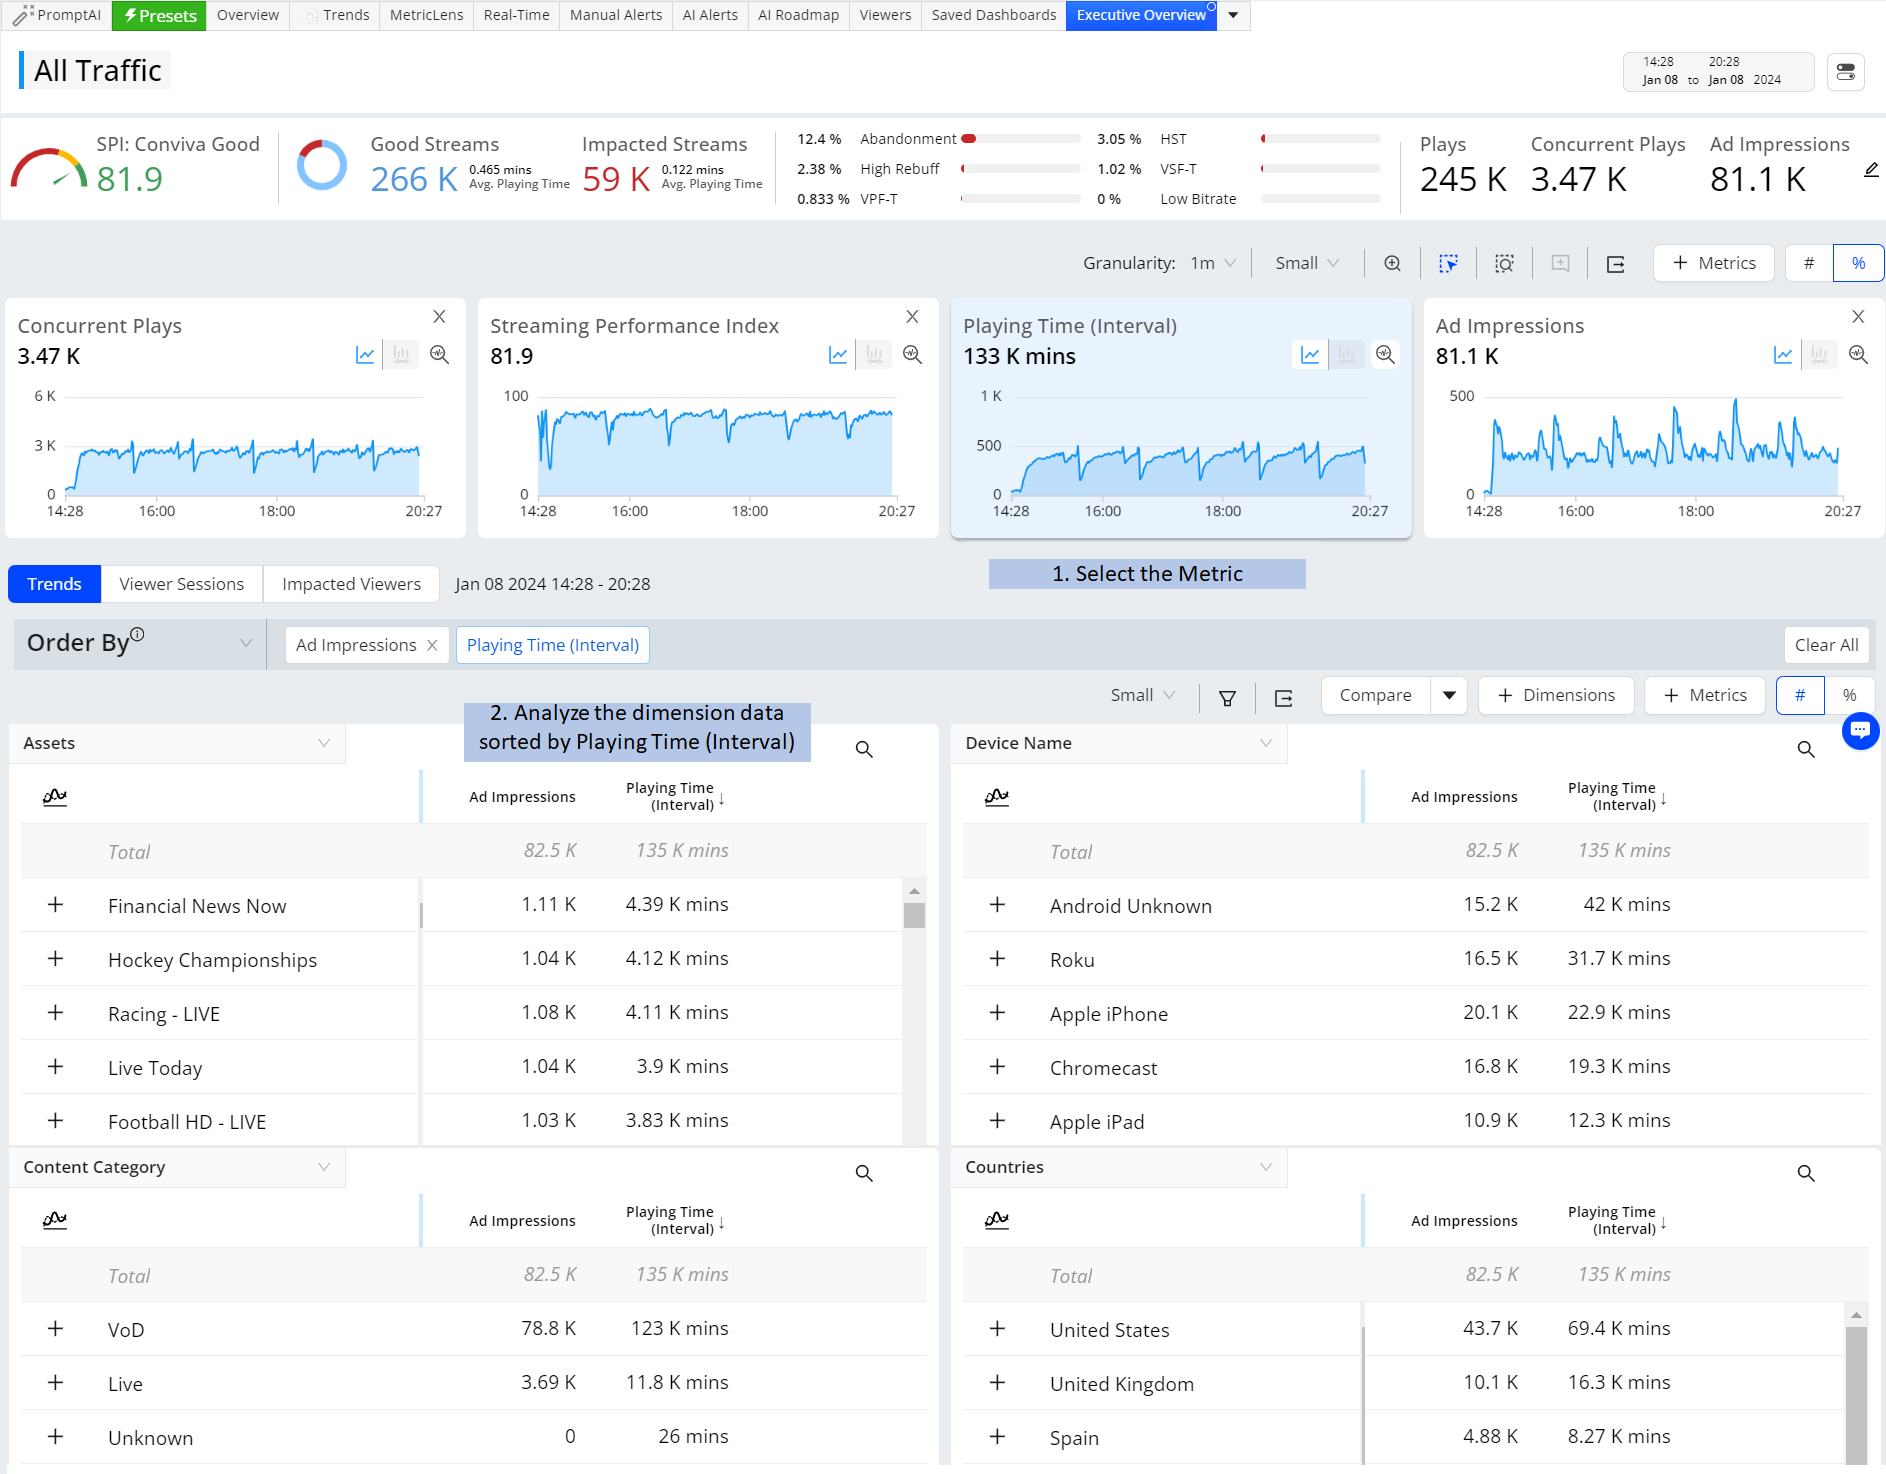
Presets for Executive Overview
Access Pulse: Trends |
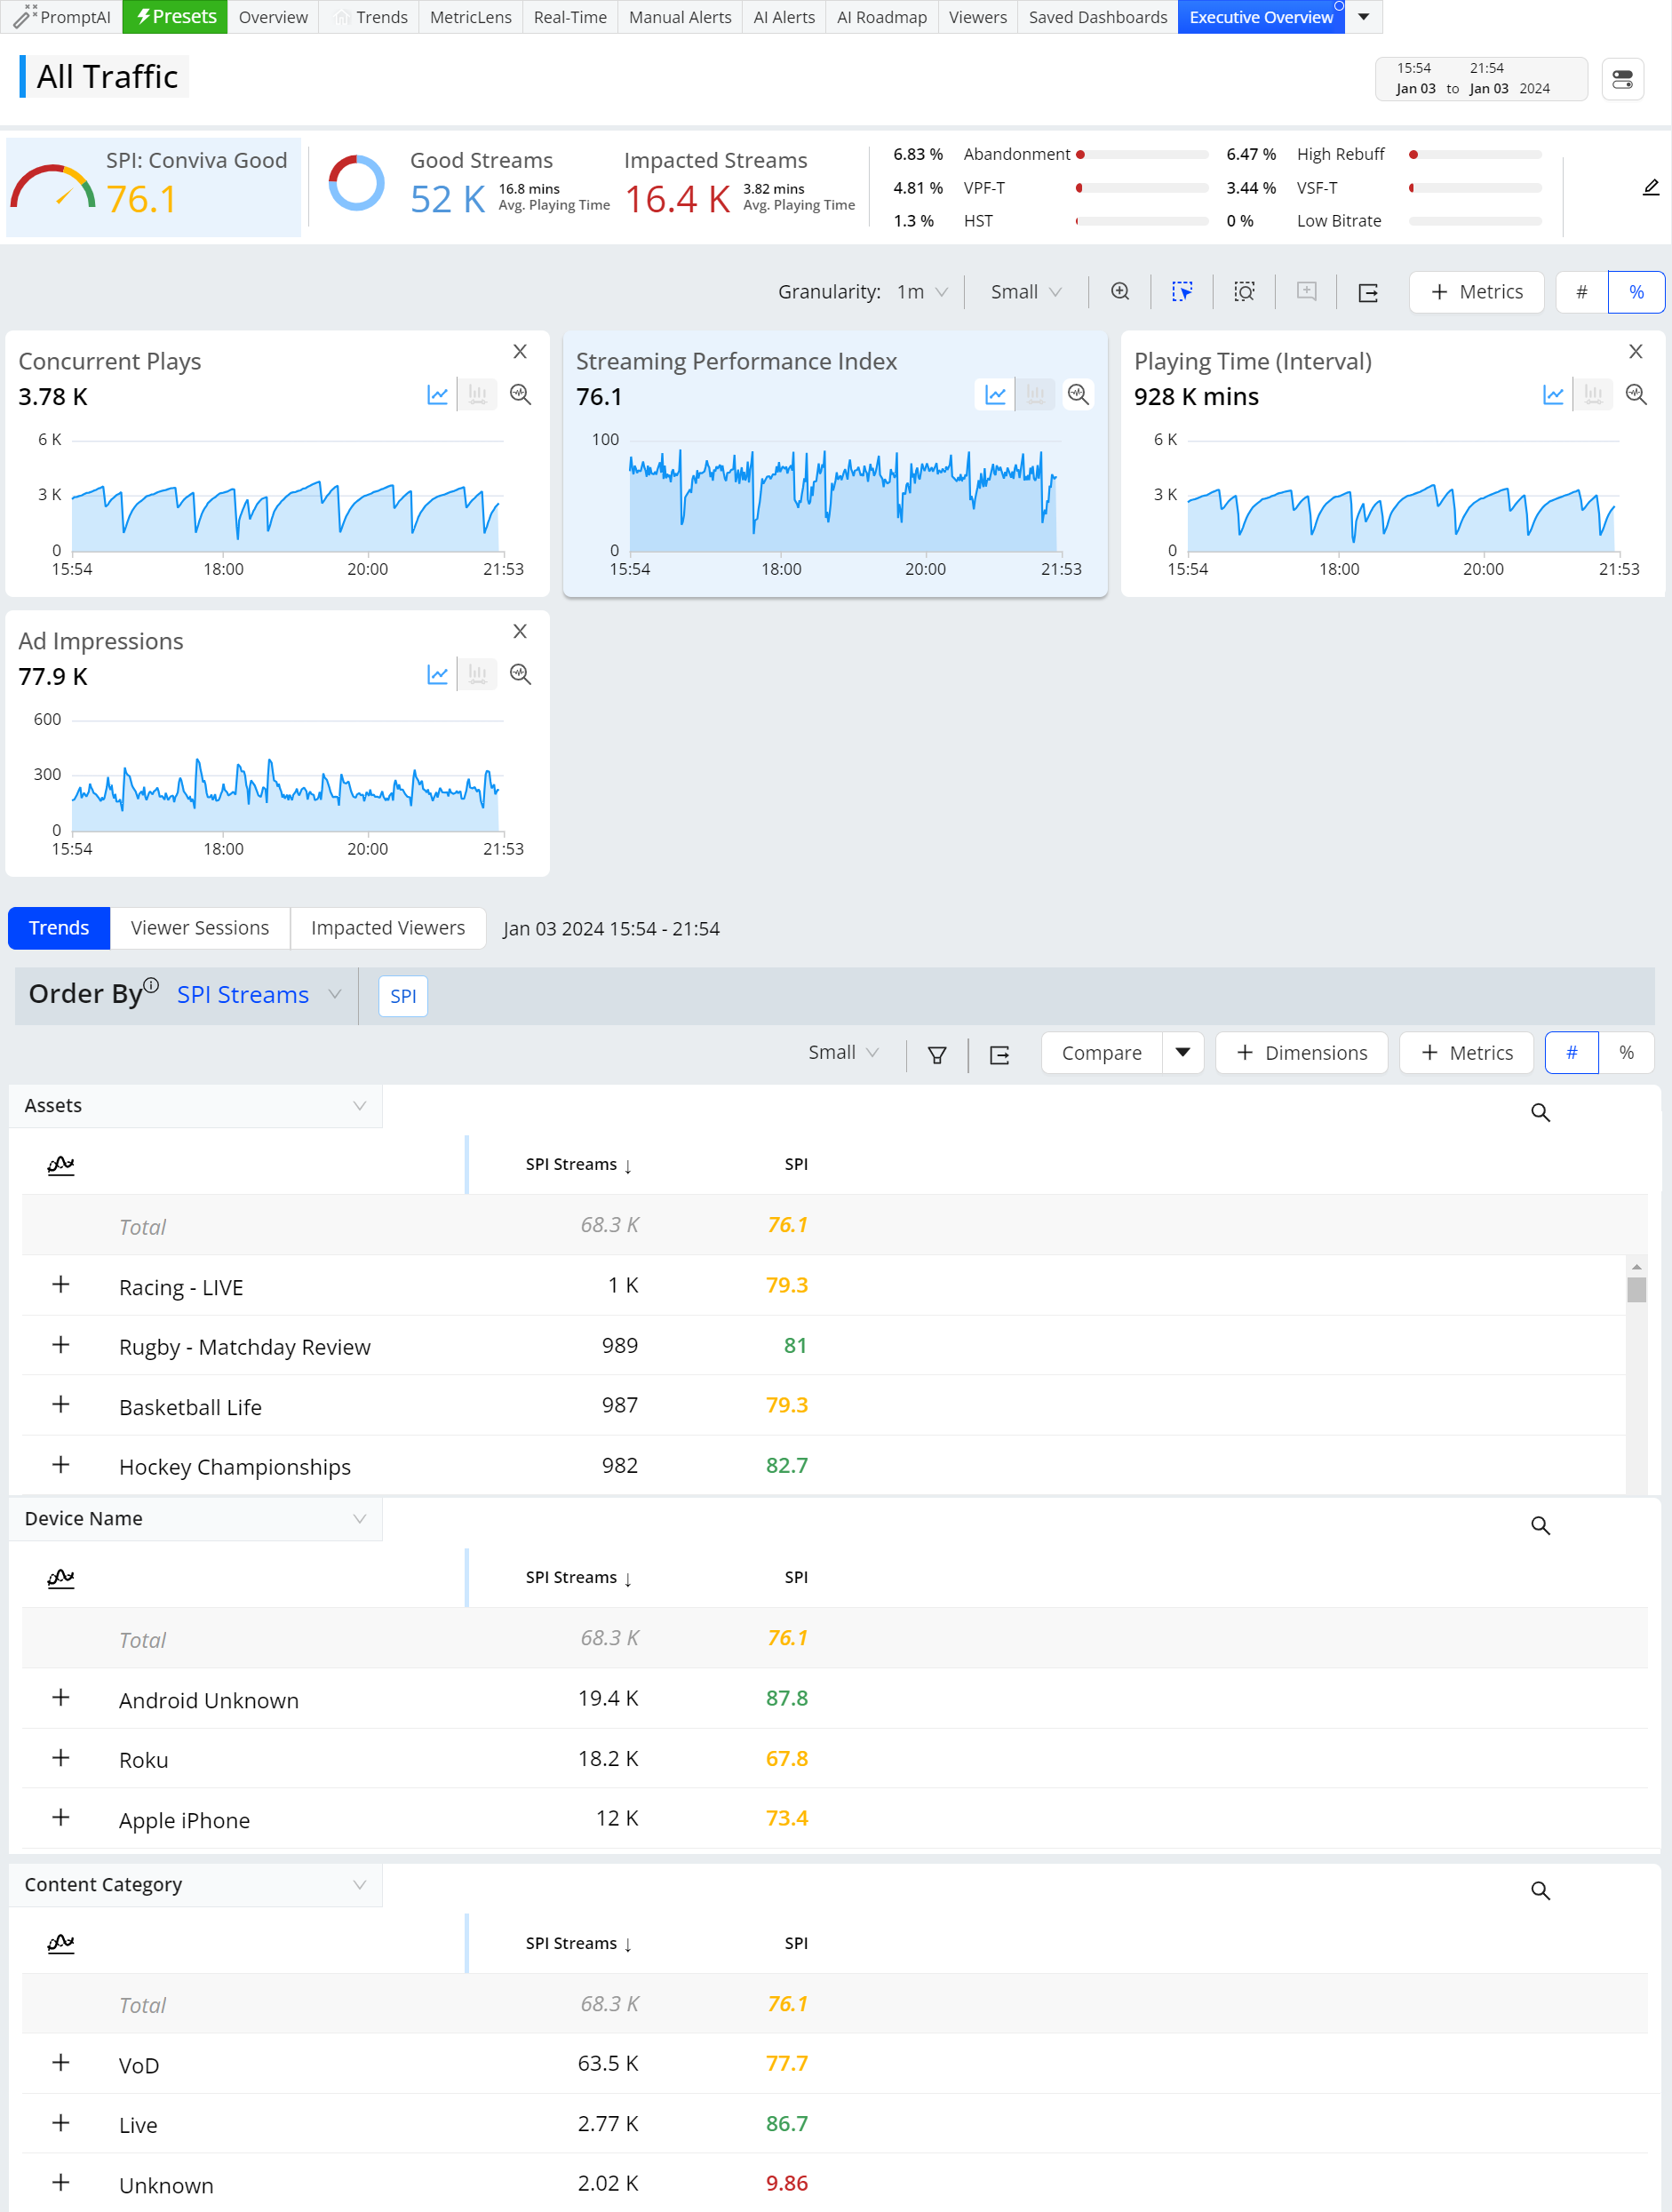
Quickly access top-level performance and metrics:
|
Trends for Executive Overview
Access Pulse: Overview |
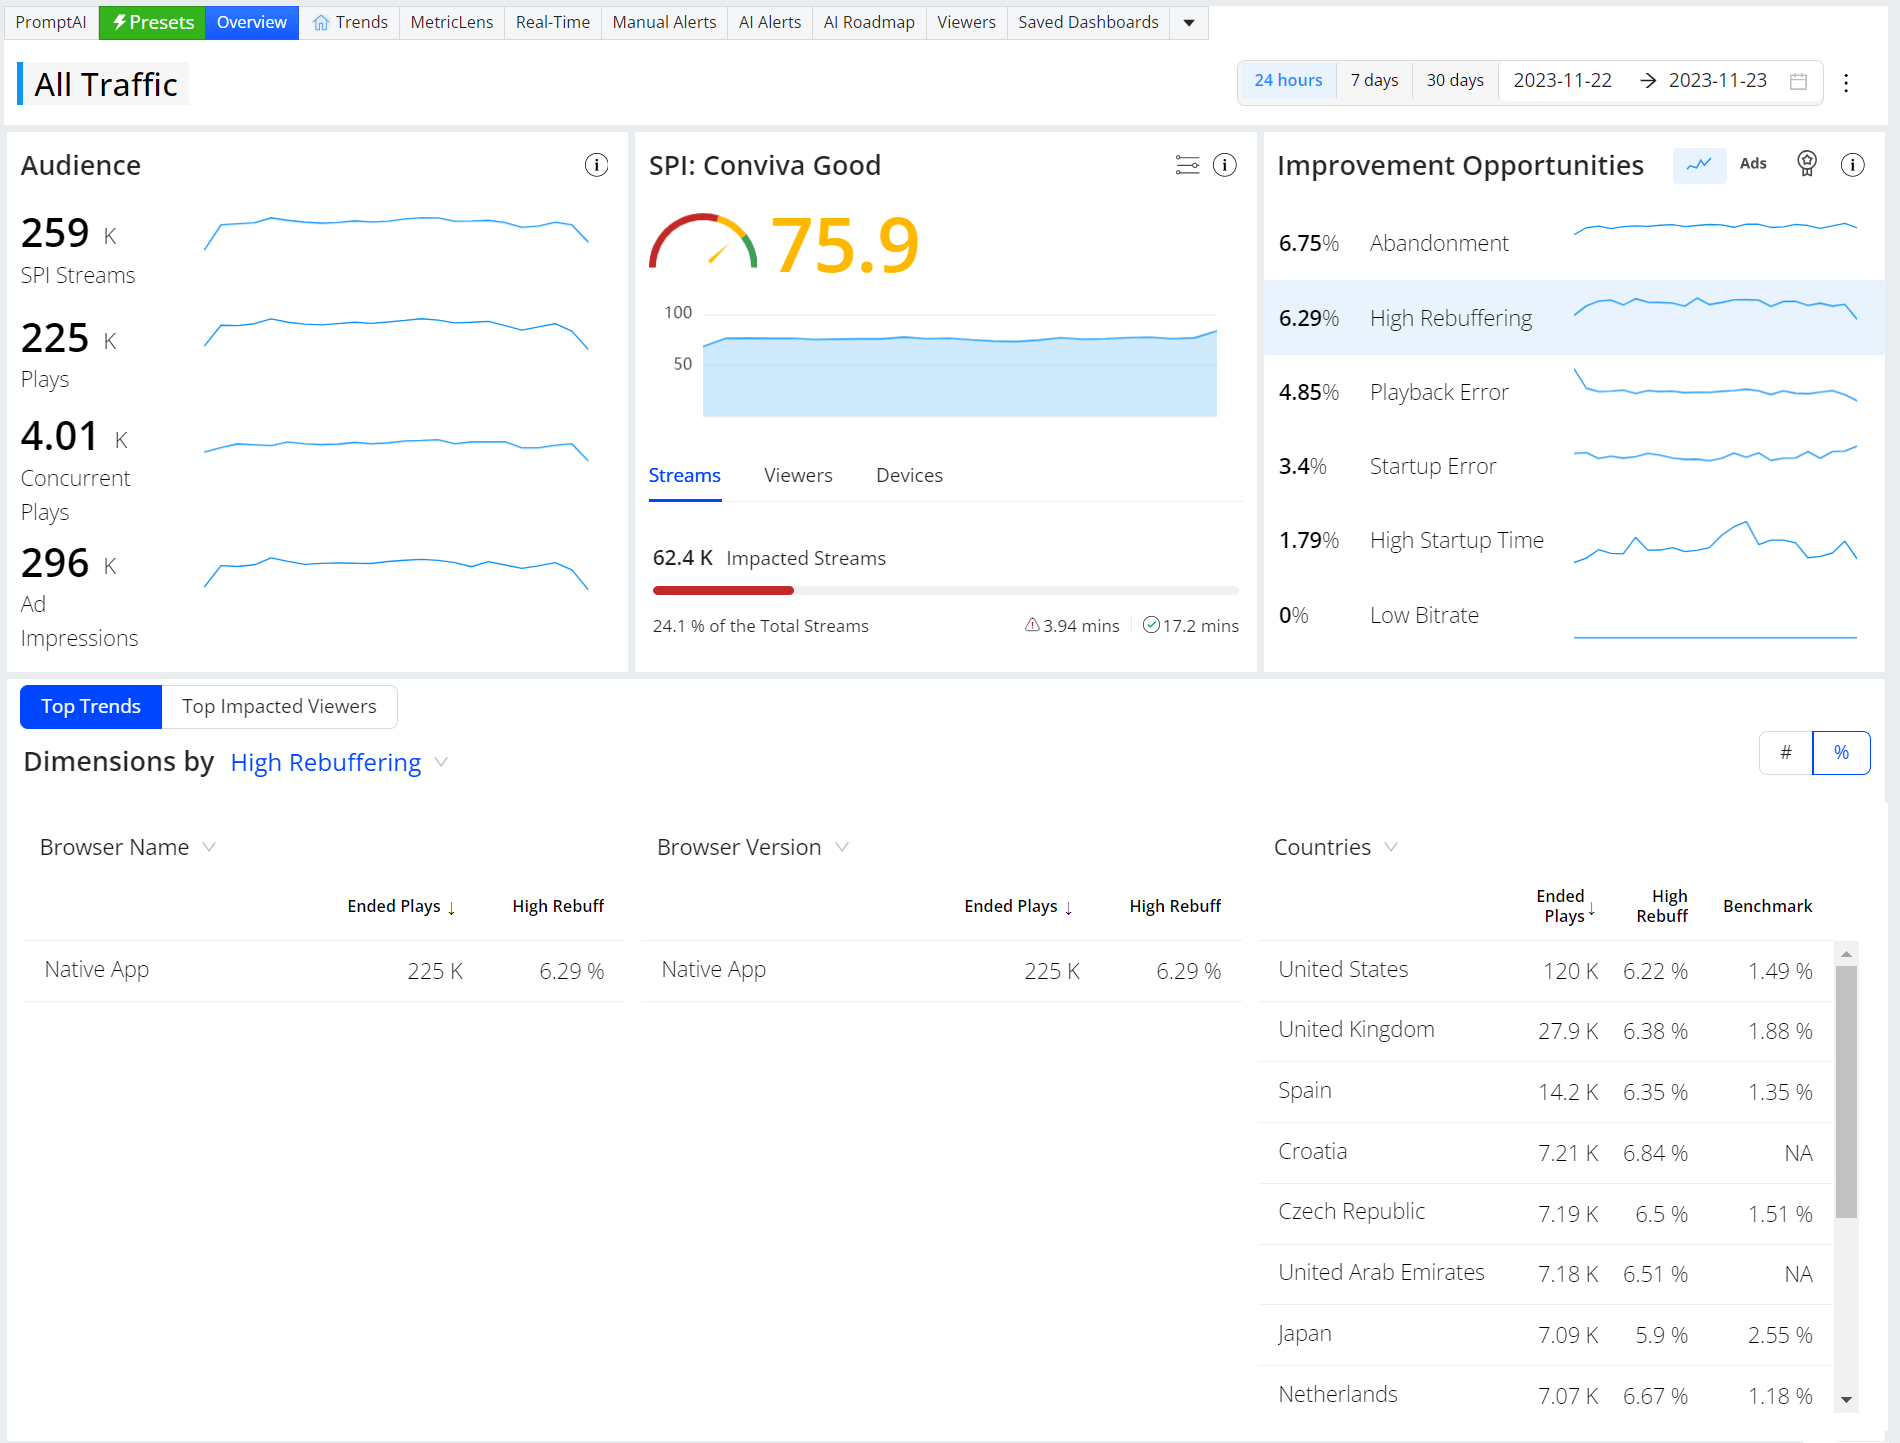
Access quick performance summaries of streaming activities and performance in the Overview dashboard, so you can quickly:
For more information on SPIs and setting KPIs, improvement opportunities , and audience metrics, see Experience Overview. |
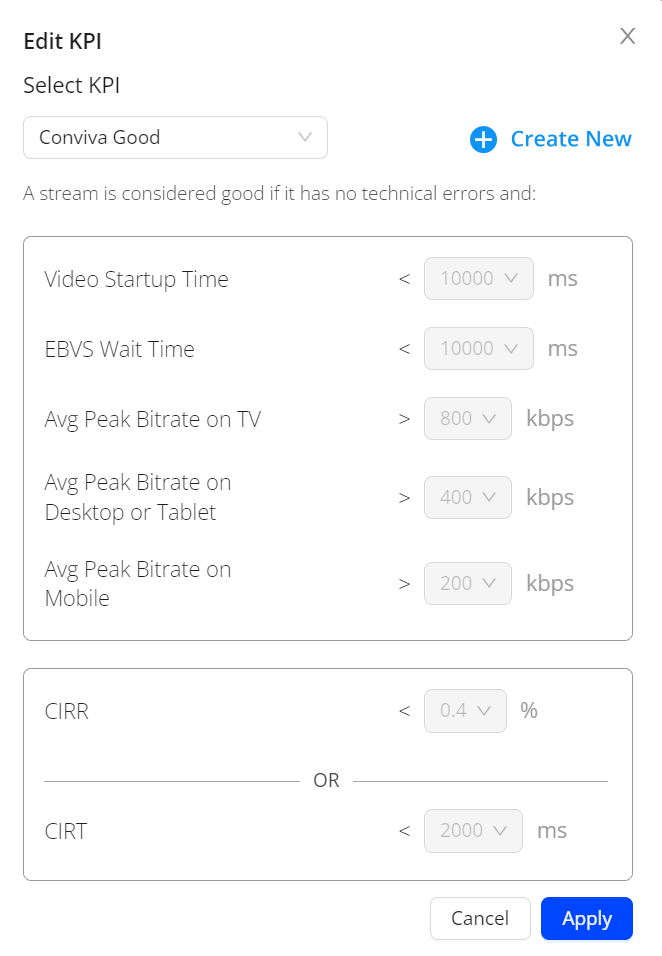
Customize Streaming Performance Index KPIs
Access Pulse: Overview |
Fine-tune streaming performance KPIs based on base on your team's experience thresholds and performance goals. These thresholds represent the Conviva Streaming Performance Index, and can use the Conviva Good/Best settings or multiple custom versions for the percentage of streams with:
For more information on SPI KPIs, see Experience Overview. |
Different Metrics |
|
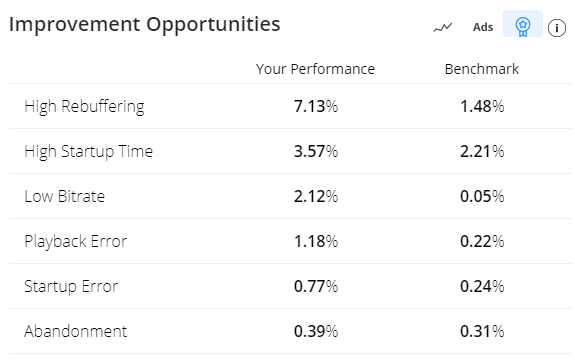
Benchmarks
Access Pulse: Overview.
|
Compare your performance with industry cohort benchmarks based on the 95th percentile of cohort performance, highlighting performance areas where you excel and where to improve. For information on the basic/advance benchmarks, and benchmark calculations, see Experience Overview. |