With VSI, product leads and others optimizing operational performance can easily monitor overall operational performance metrics, content audience levels, and ad experience through customized executive-level displays and scheduled email reports. Also, compare asset and other dimension-based performance to gain product performance and audience insights.
| Performance Features | Description |
|---|---|
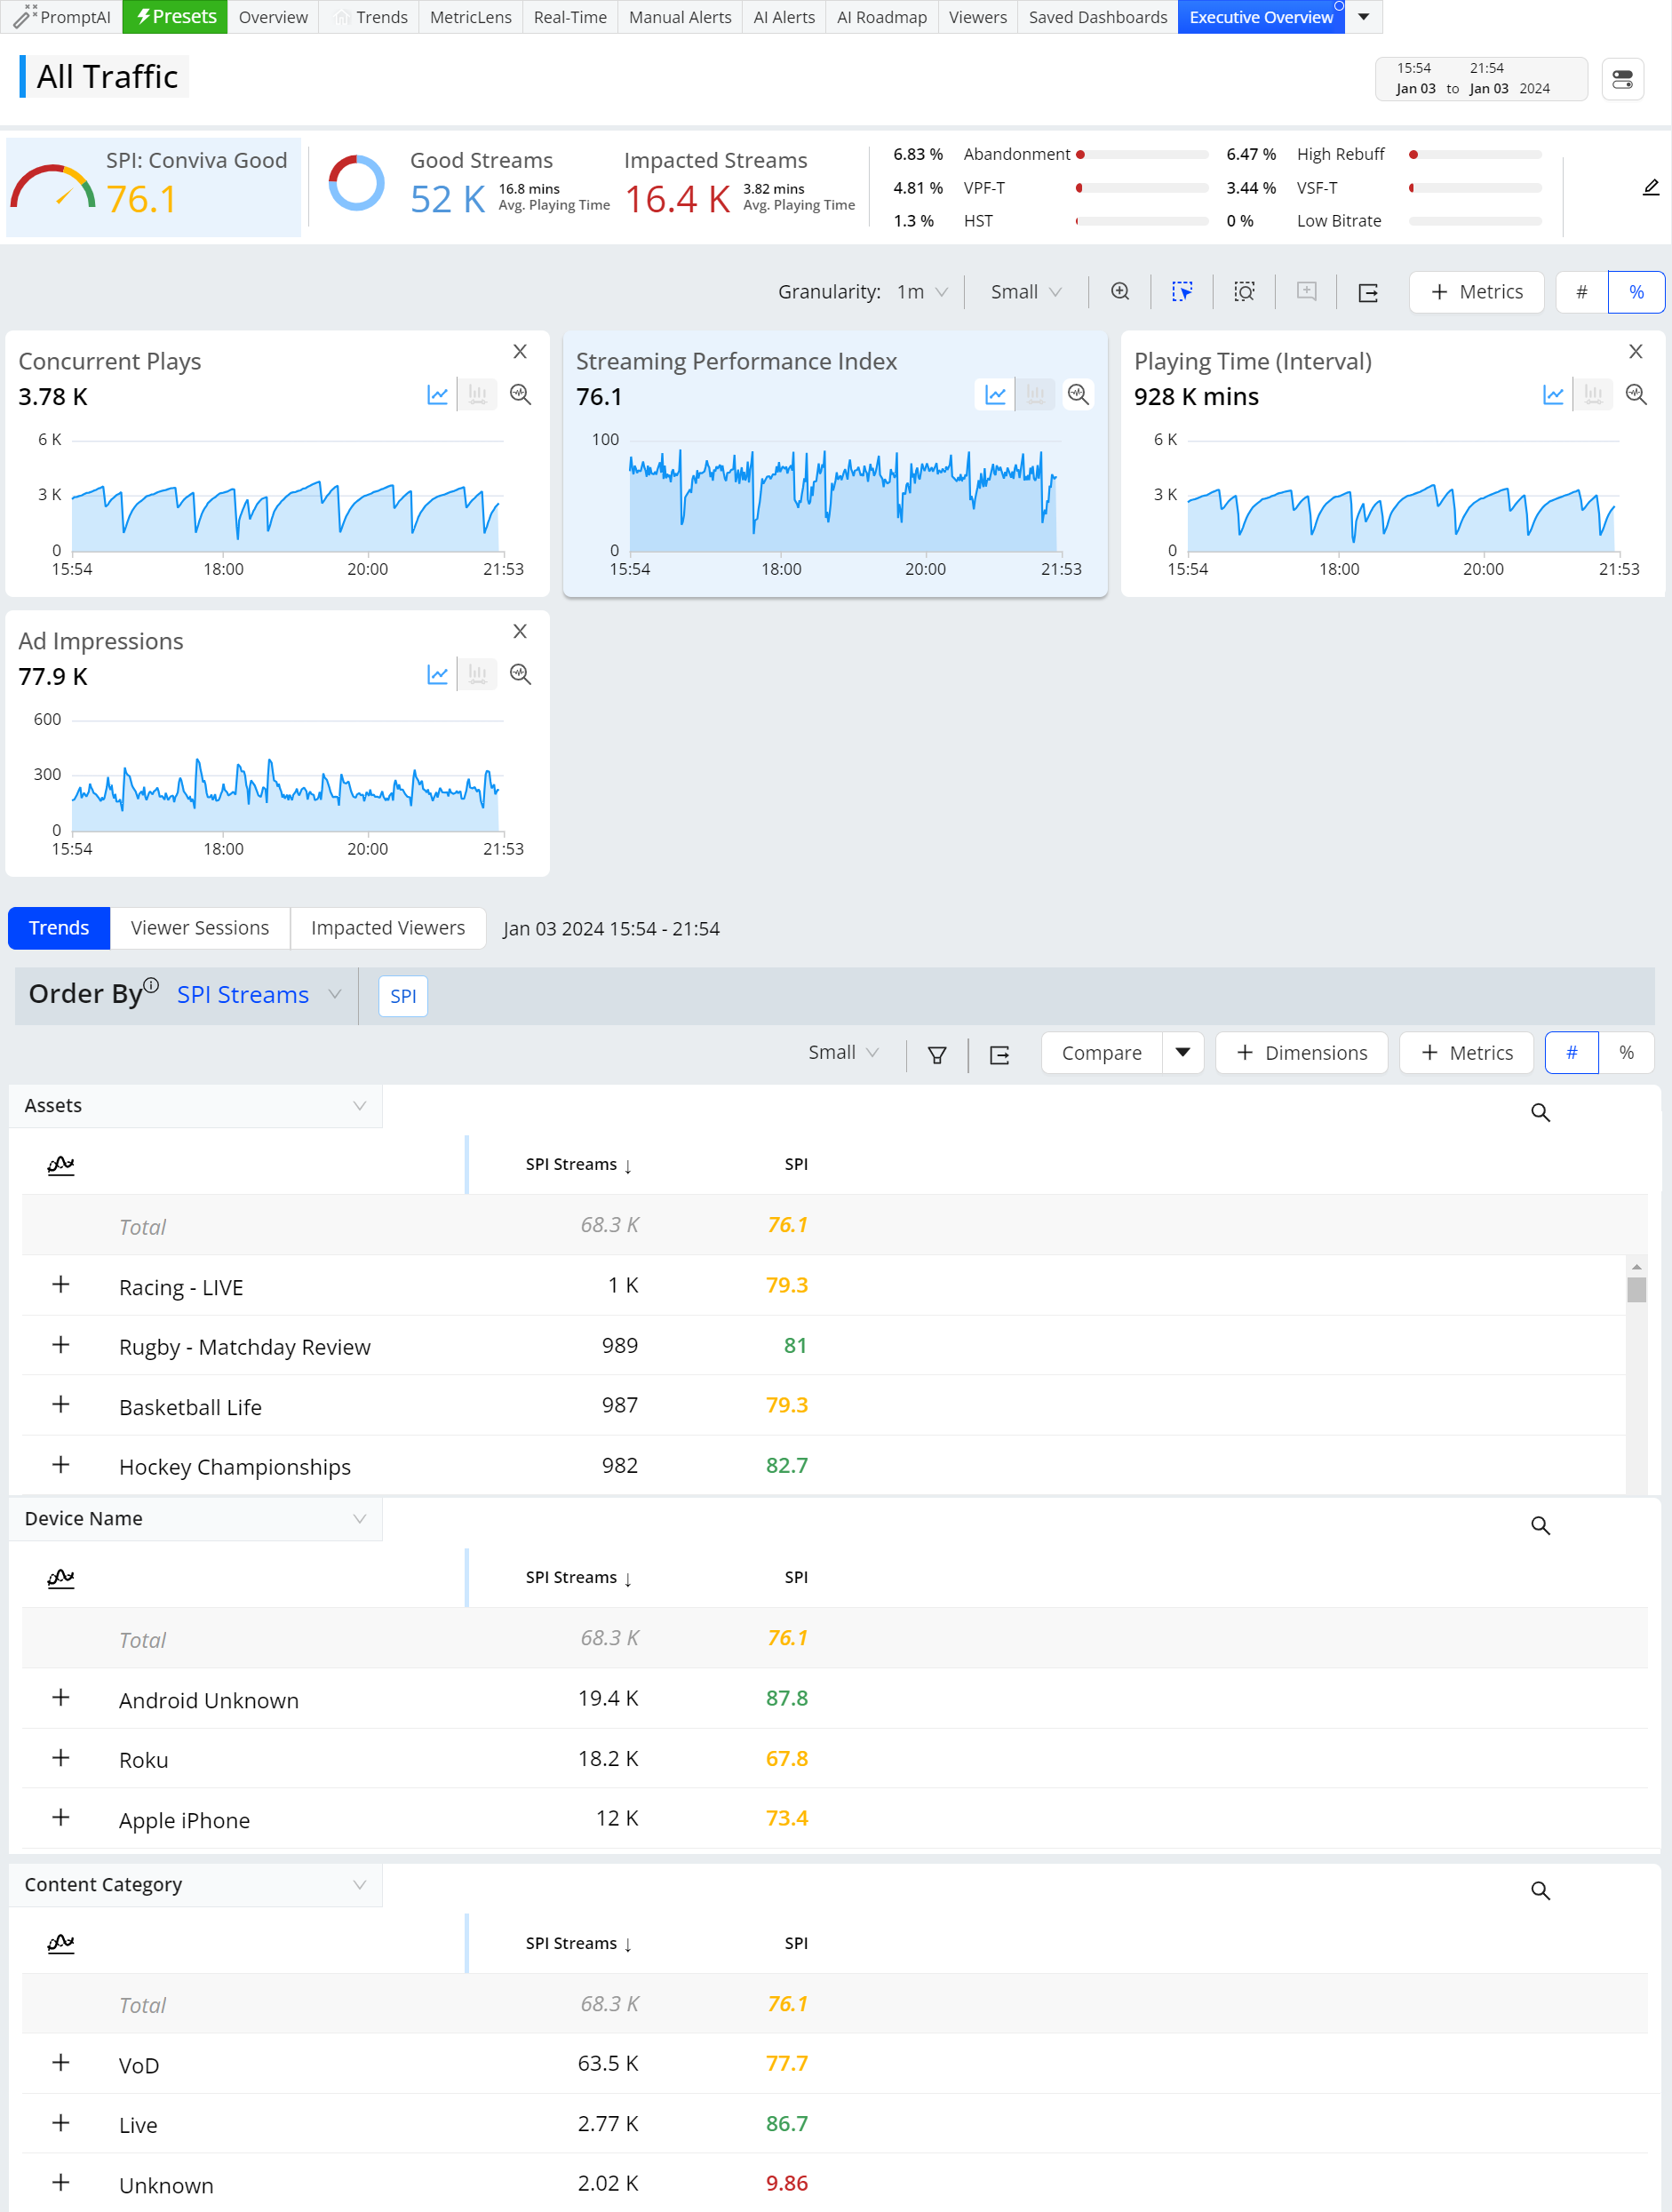
Analyze Performance
Access Pulse: Overview |
Discover overall performance insights:
|
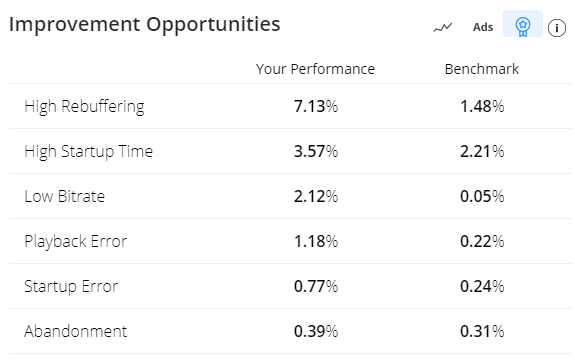
Analyze Benchmarks
Access Pulse: Overview |
|
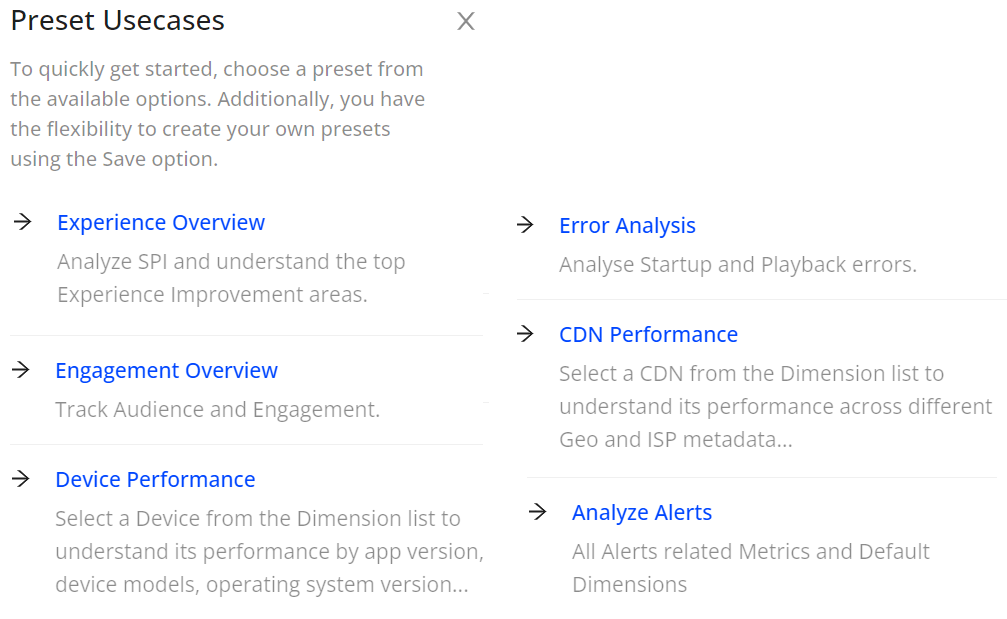
View Presets
Access Pulse: Trends |
|
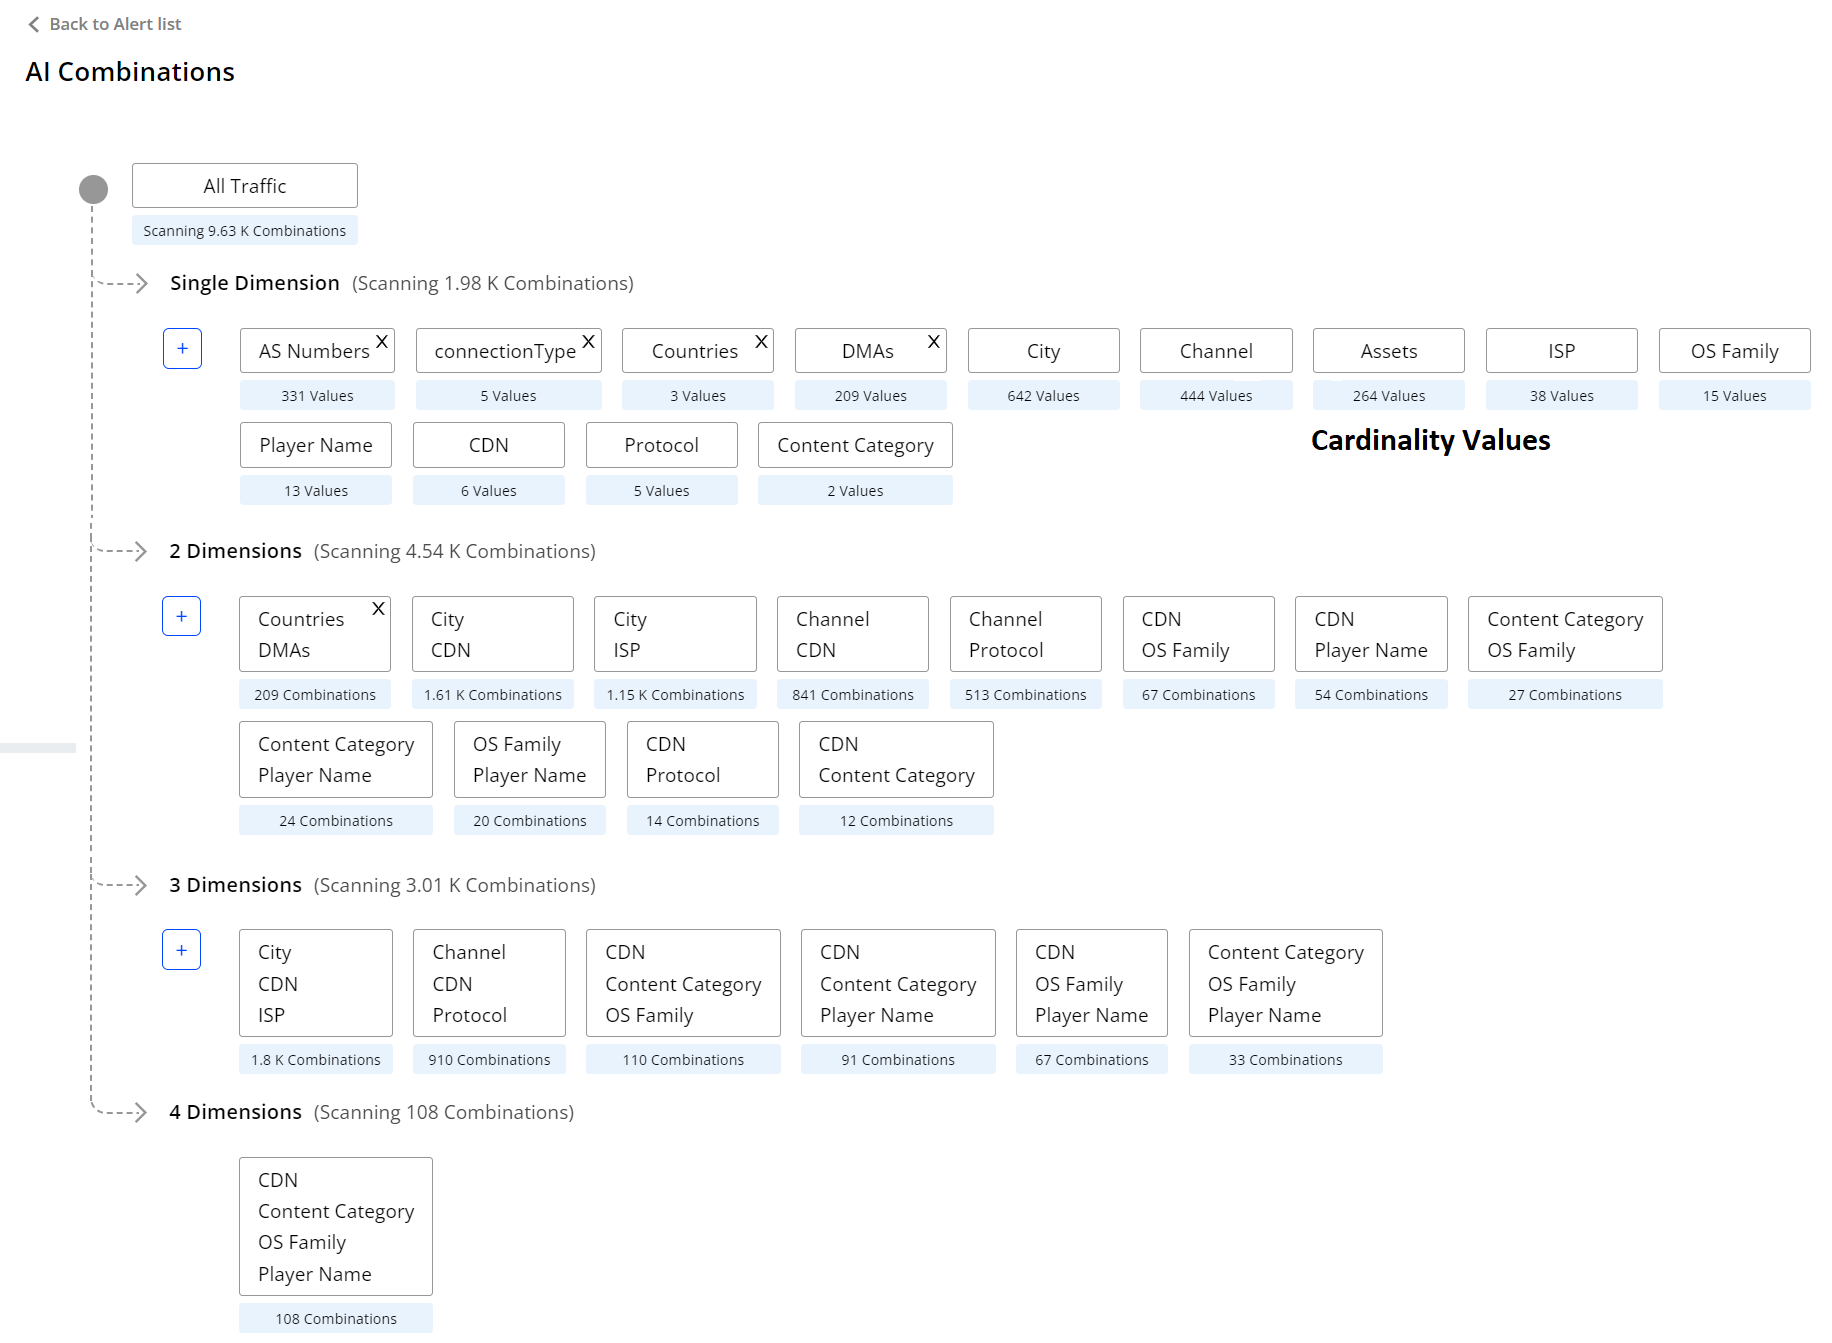
Configure Custom Dimensions
Access Pulse: Custom Dimensions |
Enhance AI Alerts to focus on specific dimension groups:
|
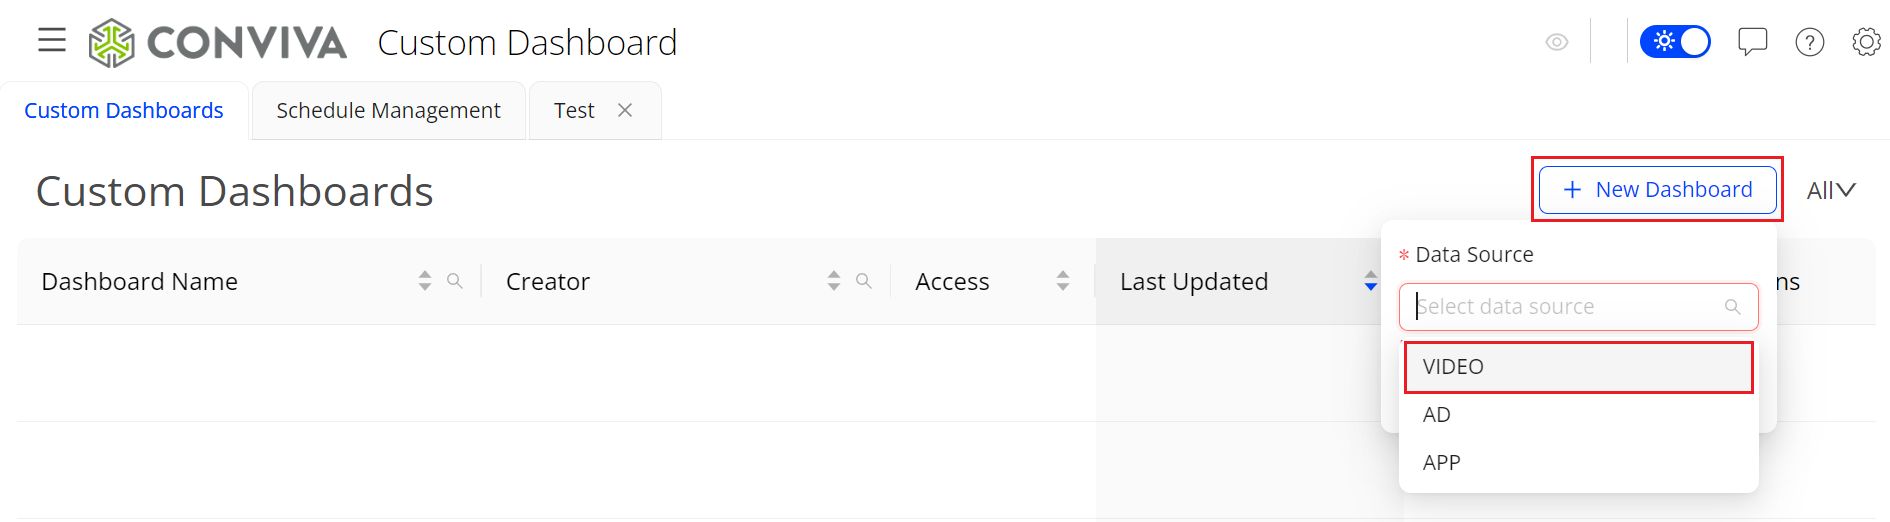
Create Custom Dashboard
Access Pulse: Custom Dashboard |
Create personalized dashboards and data insights by combining widgets and display options to emphasize key insights.
|