The Viewers dashboard enables customer care teams to quickly display the details of viewer streaming experiences across the sessions watched in a give time period. With summary, session-level data and metrics, easily determine a viewer's overall stream experience using the number of plays, total minutes watched, session SPI, startup/play failures, rebuffering and average peak bitrates, while also drilling into the specific performance measurements of each session.
Note: For intervals less than 20 days, data is displayed for up to 200 of the most recent sessions. For intervals more than 20 days, data is displayed for up to 500 of the most recent sessions.
Access the Viewers module by clicking a viewer ID in a Diagnostics page, or selecting Viewers in the menu and entering a viewer ID or the Public IP address (IPv4or IPv6) for the selected time period. The summary data and metrics appear in the top section, followed by the sessions for that viewer listed in order of session start time. In this example, the viewer successfully watched two videos on Roku and Apple iPhone devices and one EBVS event.
Note: Viewer IDs can also be obtain from the Sessions view and alert data.
Note: Click a session ID to view the session timeline for detailed session events and timeline analysis. Viewer and Session Timeline data for Live sessions may be delayed by 7-15 minutes.
To access the feature:
-
Use the Navigation pane or the Diagnostics page:
-
In the navigation pane, click Viewers and in the Find Viewer field, enter a viewer's ID. Click the find icon.
The viewer ID is passed to Conviva from the player through the `c3.viewer_id` metadata tag and is displayed in sessions page, AI alerts and Conviva Session Source Data (SSD) files.
-
In Trends, click the Diagnostics icon for a metric, select a 3-hour period in the time series, and click the Viewer Sessions tab. Click a data bucket to enable the session display and click a viewer ID.
-
- In the Viewer page, use the date picker to select the time period.
The range for viewer data can be set as 24 Hours, 7 days, 30 days, Live, or a custom date range.
The Viewers module contains several categories of information:
-
Viewing experience metrics to analyze the viewer's experience for all session in selected time period.
-
Session data for each session, such as session ID, start/end times, playing time, device name, and session status.
-
Session details with metrics and metadata for detailed analysis of a selected session.
Note: For long-running sessions that are greater than 24 hours, the timeline displays a rolling 24-hour window of session data based on sessionEndTime. For ongoing sessions, the system calculates this window using the current time minus 24 hours. For sessions that have ended, the system calculates the window using the session end time minus 24 hours.
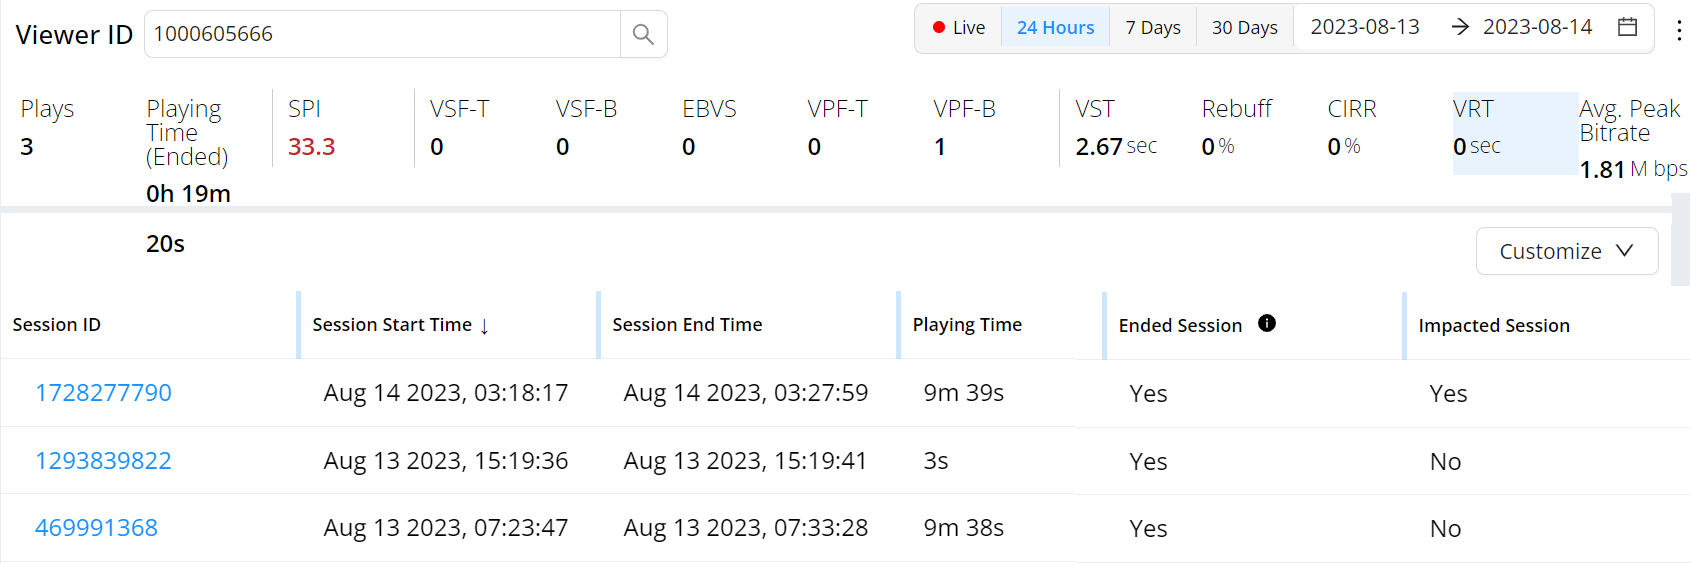
Viewer Experience Metrics
Viewer experience metrics summarize the viewer's overall experience during the selected period. In this example, the viewer had 2 plays with excellent video performance with a high SPI score along with very low startup times, low rebuffering, and high average bitrate.

Note: If VST is not captured or not available on the system, the UI shows the VST as -3, indicating that the value is not available.
Viewer Experience Metrics in Live Mode
The summary represents data from all sessions, while Live mode only shows data from active sessions, which may result in mismatched data points. Therefore, summary data is not applicable in Live mode.

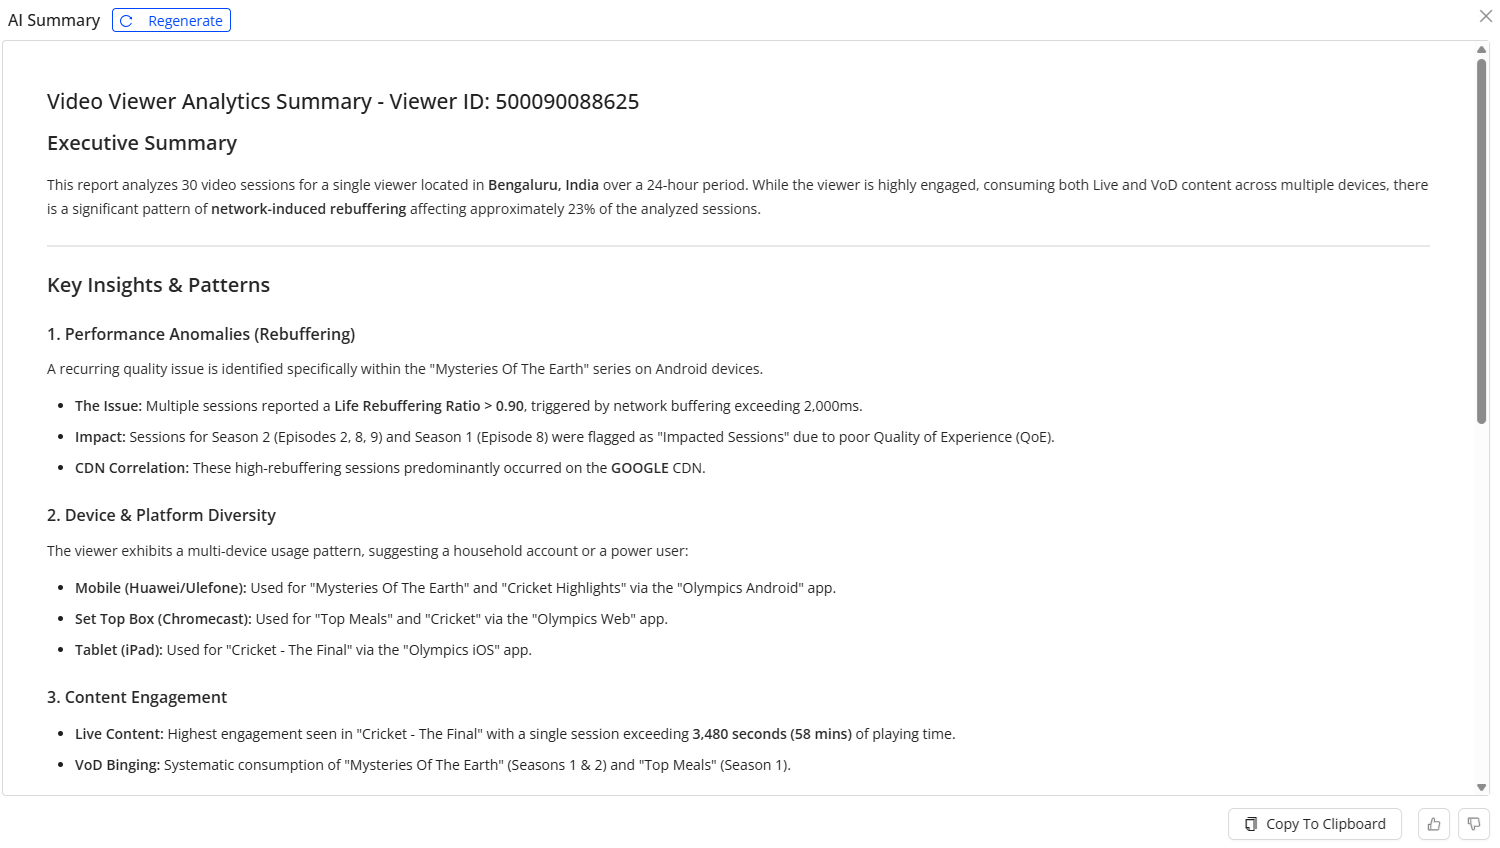
AI Summary (Beta)
The AI Summary feature generates a consolidated summary of all video sessions associated with a specified Viewer ID or Public IP address. It aggregates session-level performance and engagement data to deliver a structured, high-level overview of session behavior and performance trends. The analysis of the key metrics across sessions identifies patterns and deviations, and presents concise, actionable insights without requiring users to review individual session records. This capability accelerates troubleshooting, improves operational efficiency, and enables informed, data-driven decision-making at the viewer or IP level. The AI Summary integrates seamlessly into existing workflows, with established data access controls and reporting frameworks, ensuring secure, consistent, and governed access to summarized insights.
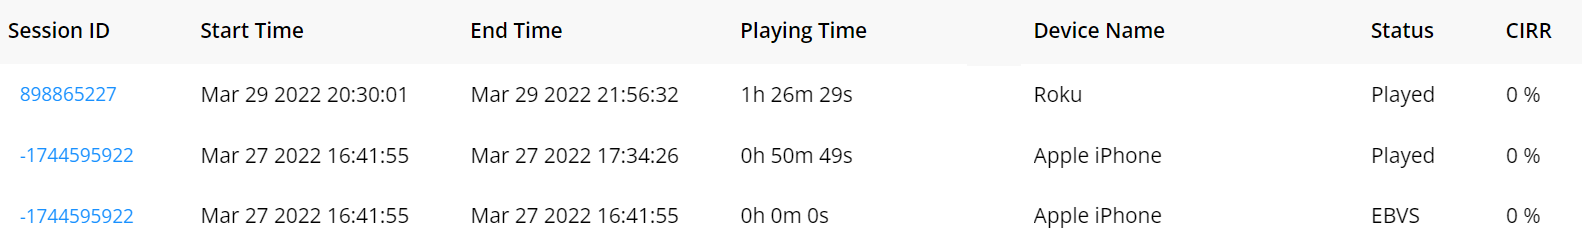
Session Data
The session data describe the basic session performance for each session. This example shows three sessions—two that played and one that ended due to a viewer exit before the video started. Up to 49 sessions are displayed in a page.
Session Details
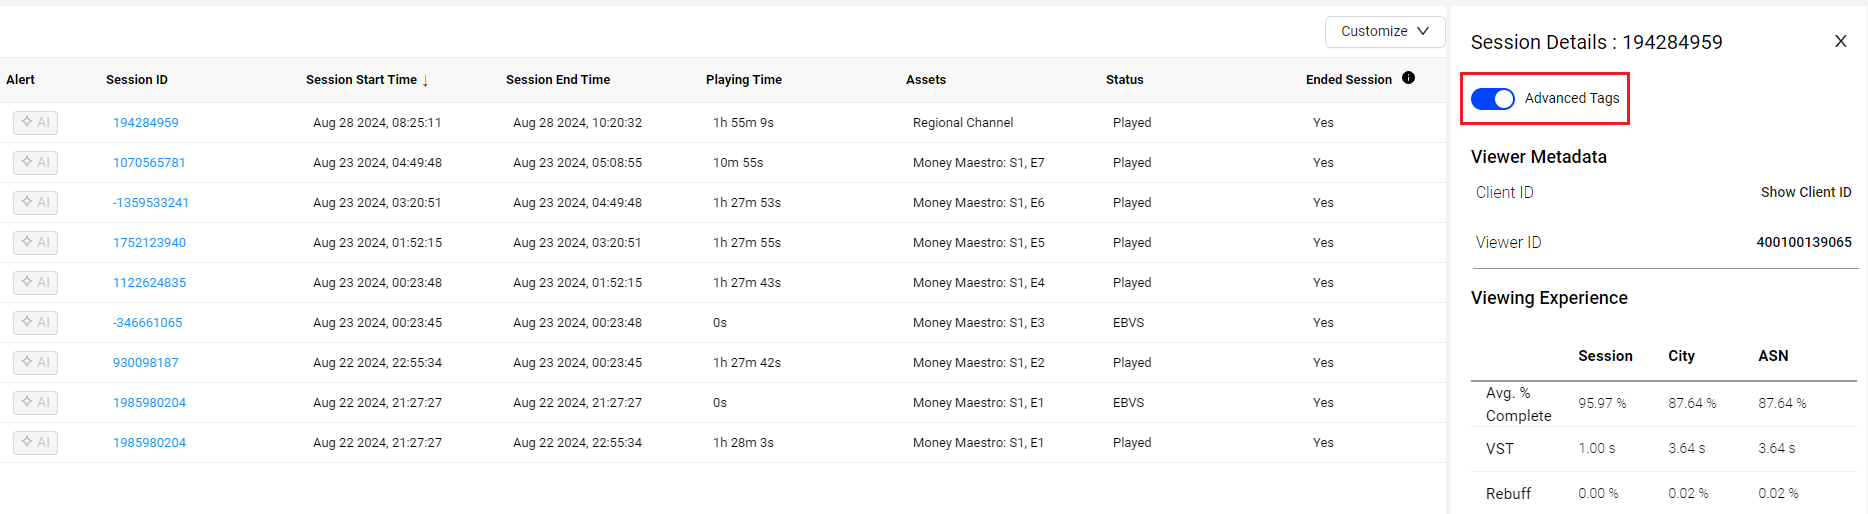
Clicking a session row toggles the display of detailed session performance data. This data enables identification of viewing issues, such as excessive rebuffering and video startup delays, and helps determine whether they are limited to the selected viewer or widespread across the viewer’s city and ISP/ASN. If the issue is widespread, alerts and dashboards facilitate the investigation and identification of the root cause of large-scale viewing issues.
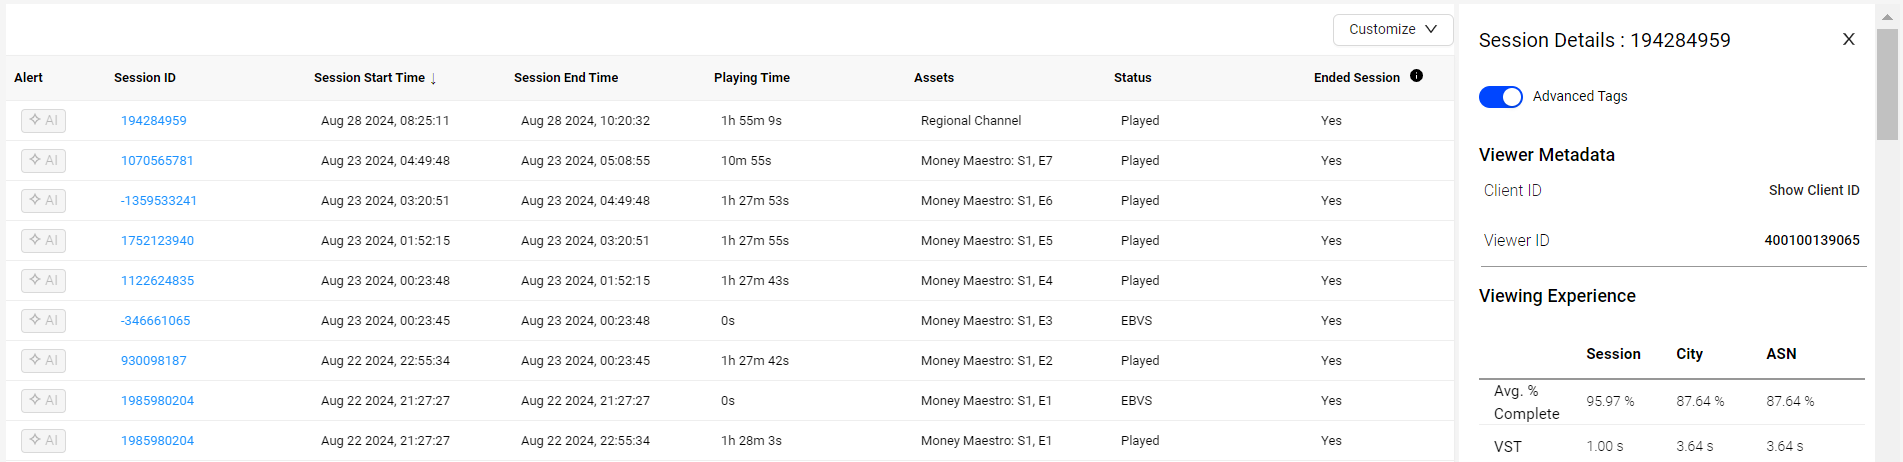
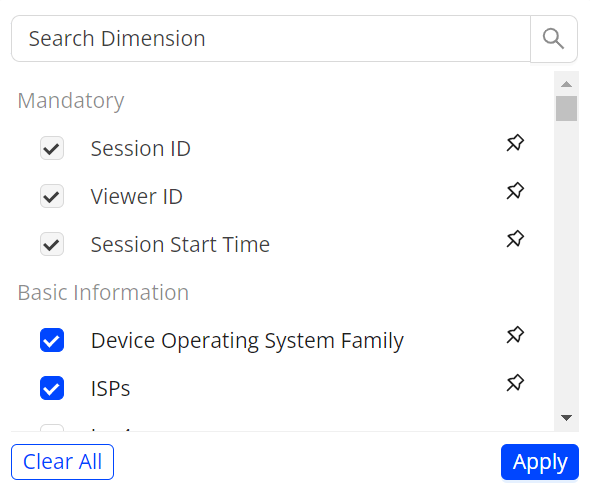
Click the Customize drop-down to modify the displayed metadata. Additional metadata is available for configured dimensions. Use the pin option to fix the position of the metadata at the start of the table.
Hover over a column name to sort the column or search for a specific value.
Note: If the city and ASN where the session originated are not among the top 200 cities and ASN by video traffic, % Complete for the city and ASN are shown as 0%. Also, for LIve and DVR video, % Complete for the session is shown as -1.
The following table summarizes the session-specific performance data that appears.
| Session Status | Displayed Performance Data |
|---|---|
|
Played |
|
|
VSF-T VSF-B |
|
|
EBVS |
|
|
VPF-T VPF-B |
|
|
Not Played |
|
All status types (Played, VSF, EBVS, Not Played) also display metadata.
-
Content Metadata: Stream URL, isAd, Content Category, Asset Name.
-
Location Metadata: Location, ISP & ASN, IP address
-
CDN Metadata: CDN,
-
Device Metadata: Device Name, Device Operating System, Device Manufacturer, Device Hardware Type, Device Operating System Version, Browser Name, Device Model, Device Operating System Family, Device Marketing Name, Browser Name
-
Player Metadata: Player Name, Player Framework Name, Player Framework Version.
-
Other Metadata: Based the configured metadata based to the player during integration.
For detailed metric definitions, see the Metric Dictionary.
View the session tags in the Session Details. The advance Tags toggle button displays more tags. The Other Metadata section shows the tags enabled as dimensions.
Save, Share, Make Default Options
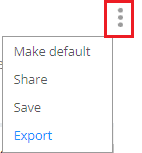
Save, share, and set the default page by clicking the kebab icon and selecting an option in the kebab menu.
Export Session Data to a CSV File
Export the viewer's detailed session data as a Comma Separated Values (.csv) file. Import the data into a spreadsheet or other analytical application.
To export a viewer's data, in the upper-right kebab icon click Export.
Device Validation
The Device Validation feature enables testing and verification of the accuracy of metadata set during integration. Accurate metadata is essential for successful integration, as it creates filters for data analysis within Conviva's platform using the passed metadata.
For information on device validation using CDN, Metircs, Custom Tags, and more, see Device Validation using Viewer Module.
Viewers dashboard Viewers dashboard Viewers dashboard Viewer Experience Metrics Session Data Device Validation