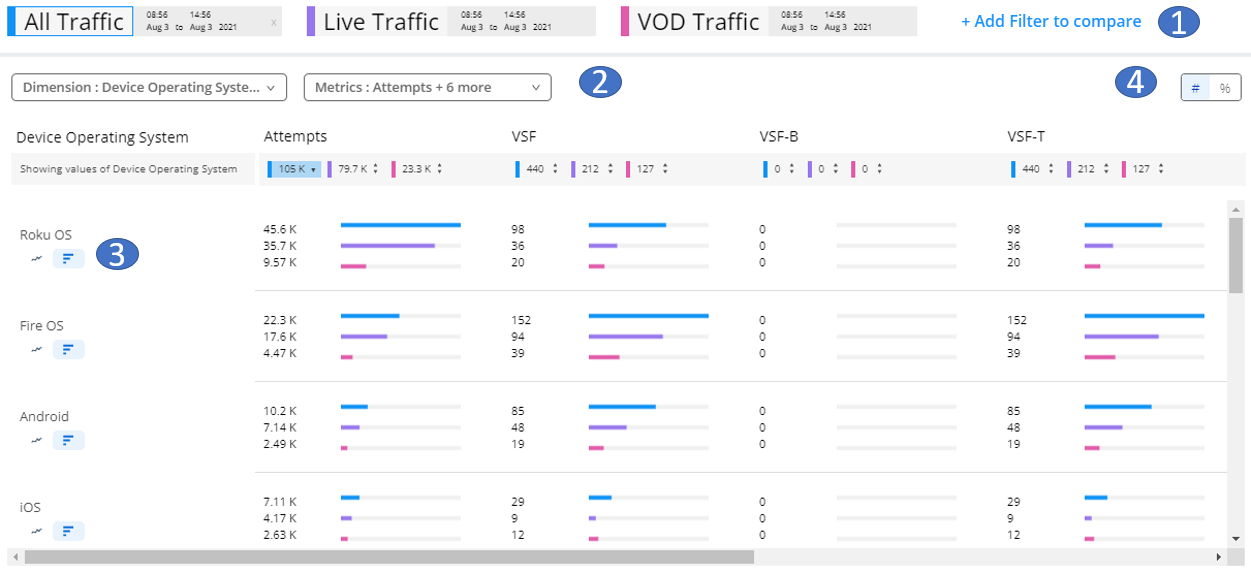
Conviva's MetricLens dashboard enables the dimensional analysis of quality and audience metrics in a unified visual presentation of metric comparison bars and time series with 1-hour granularity. Enhanced with up to three selected filters, you can customize the data analysis to monitor the performance of your most critical streaming KPIs and easily narrow the root cause of performance impacts for up to 10 dimensions.
By default, the MetricLens data is sorted by All Traffic.

Common MetricLens tasks:
- Click + Add Filter to compare to set up to three filters for metric comparisons (All Traffic is selected by default). For each filter, click the date/time to set a custom period for that filter, typically used for week-to-week or multi-event comparative analysis. When selected, the Live option refreshes every 20 seconds and applies to all active filters.
Note: All configured filters are available, and filters no longer require the enable for MetricLens option.
- Click the Dimension and Metrics boxes to select the desired dimension and metrics. In the display, metrics appear in the order of the video stream activity, for example Attempts, VSF, EBVS, Plays, etc.. Type sequential letters contained in the dimension entities in the search box to quickly display specific dimension values, such as typing NFL for the Asset dimension to view all the assets with NFL in the asset name or typing California for the City dimension to display all cities with California as part of the name.
- Toggle the data representation between comparison bars and time series. Time series display 1-hour data within a 30-day period and daily data for longer periods. Period can go back as far as 13 months. Mouse over the data to display data point details.
Note: To display time series for multiple filters, the filter periods must both have the same granularity (1-hour or daily).
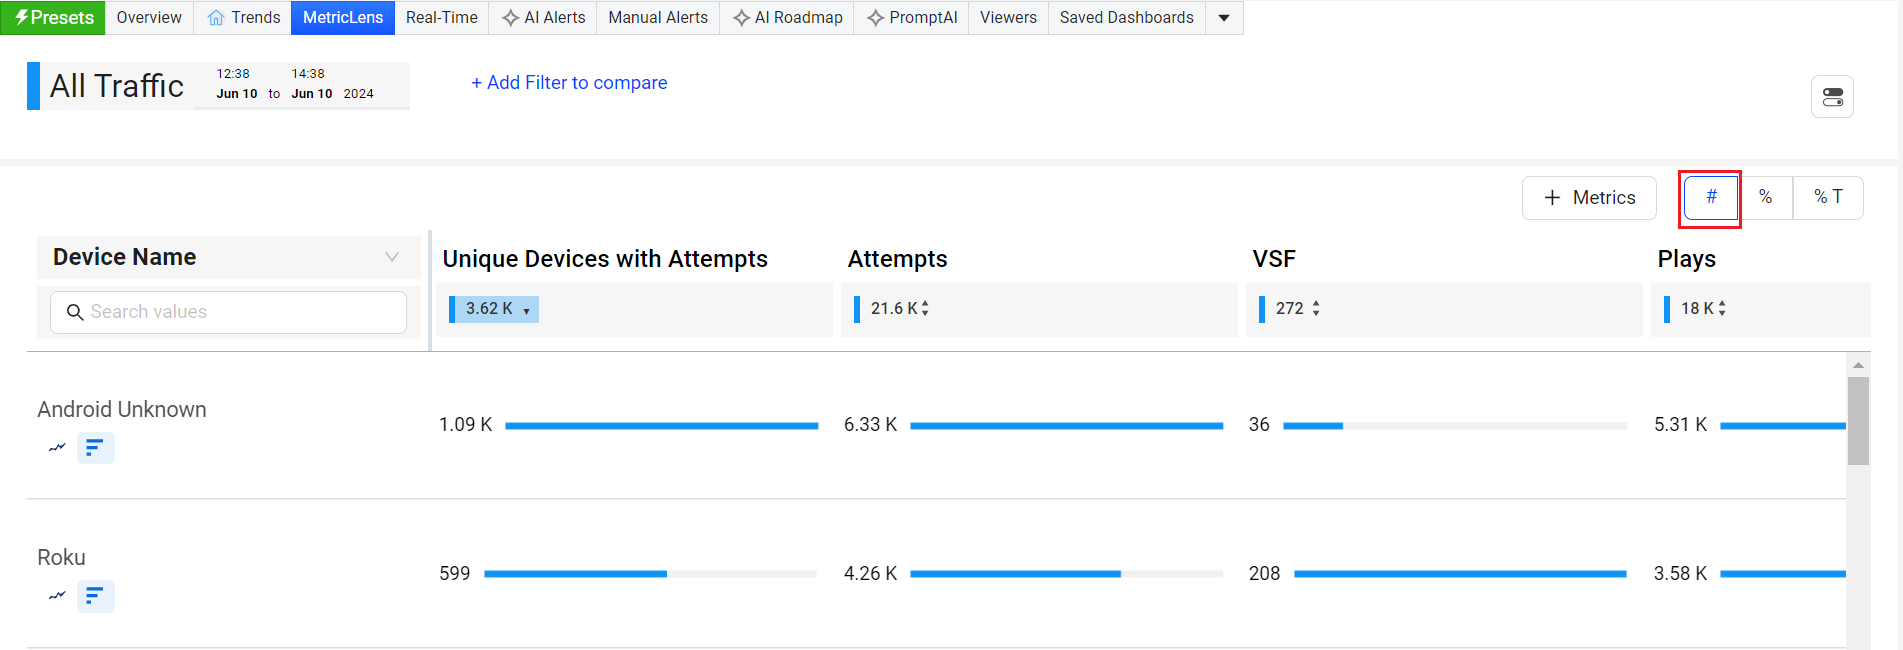
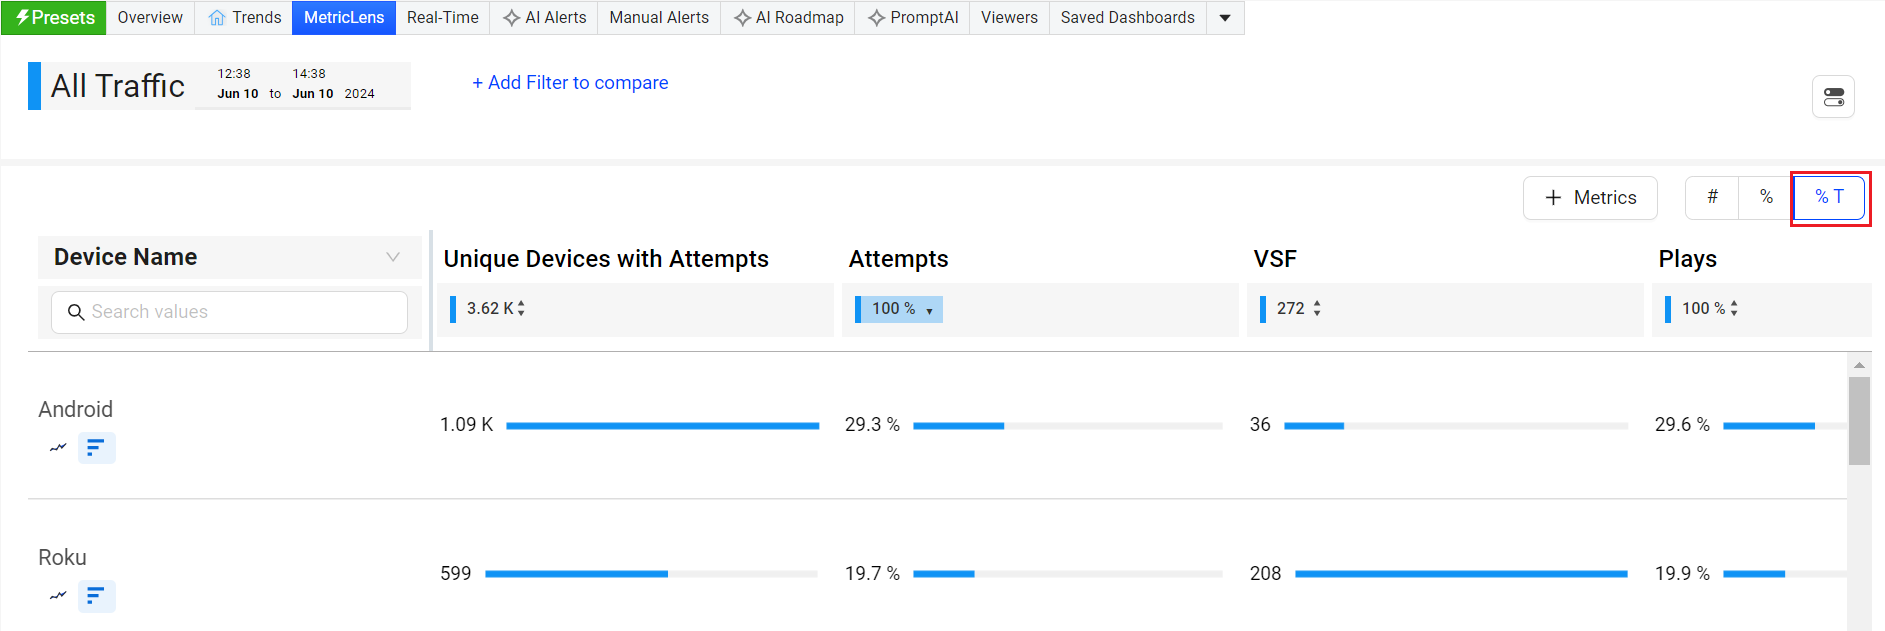
- Toggle the data units between the number, percentage, and percentage of total of the impacted video streams .
Impacted Video Streams in Numbers
This displays the number of impacted video streams within the selected time period.

Impacted Video Streams in Percentage
This displays the number of impacted video streams in percentage out of the total streams within the selected time period.

Impacted Video Streams in Percentage of Total
This displays the percentage of impacted streams for the displayed dimension values within the selected time period.

You can add metrics by clicking the Metrics button.

Note: All the metrics supported in Trends are supported in MetricLens.

The time series is enhanced with the Y axis markers for quick and clear metric value identification, without doing a mouse hover. The mouse hover text is also optimized to take minimum space now and not hide the adjacent chart.
To expand the data analysis across dimensions with various traffic levels, the MetricLens page supports infinite scrolling, along with ascending and descending ordering of data by metric values. MetricLens settings are persistent and remain the same when returning from other dashboards, or closing and reopening the MetricLens dashboard.
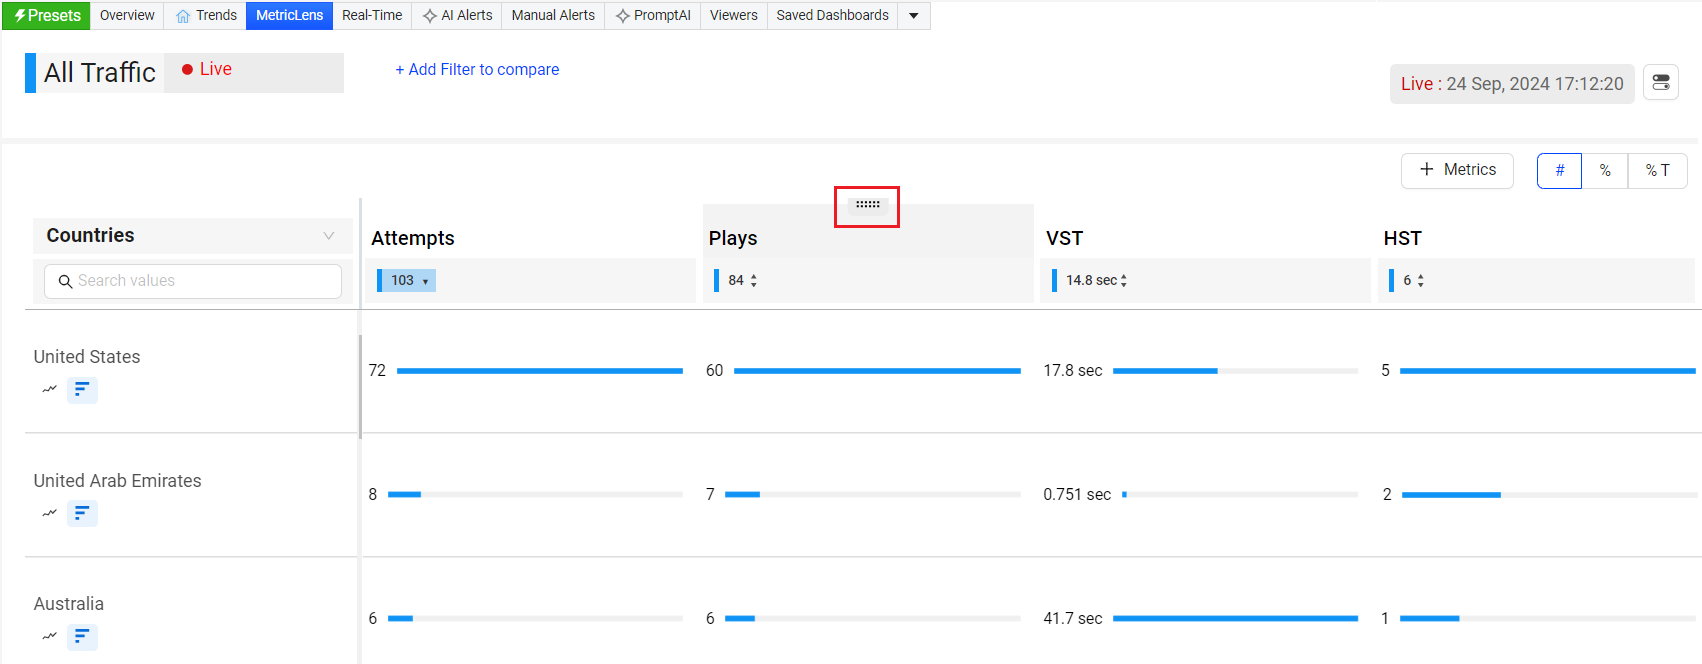
Rearrange Metric Columns
The MetricLens dashboard provides an option to rearrange the metric columns using the selector. You can rearrange the metrics columns for easier analysis.

Saving, Sharing and Exporting Data
Click the toggle icon in the upper right to save, share and export the data.

After clicking Share, Conviva VSI saves a snapshot of the item for 30 days and produces a link that you can share by email, by Slack message, or by pasting it into another document.
Note: Special character and emojis are not supported in the shared links.
When a user opens the link and logs in to Conviva VSI, they see an exact copy of the item you sent. They can change how the VSIpresents the data in the snapshot, but cannot change which data are part of the snapshot. For example, the user can deselect metrics to hide them, but they can't change the dimension or time series.
The Save option is only available for shared dashboards.
From the kebab icon you can also make this page your default page so it appears as the active page whenever VSI launches.
Export outputs data in both percentage and numeric values based on the selected metrics and filter settings, and generate a comma separate file (.csv) file for further analysis. Data for each active filter is displayed with a data label (F1, F2,) to indicate which filter was used for the data.
The page scroll determines the amount of data included in the export file. Each page scroll selects 20 rows for export, so two page scrolls includes 40 rows of data.

MetricLens MetricLens MetricLens 10-dimensional comparison 10-dimensional comparison