The Trends dashboard introduces a range of new capabilities designed to enhance streaming performance and metric analysis.
These features include:
-
Trends Analysis
Layout Options
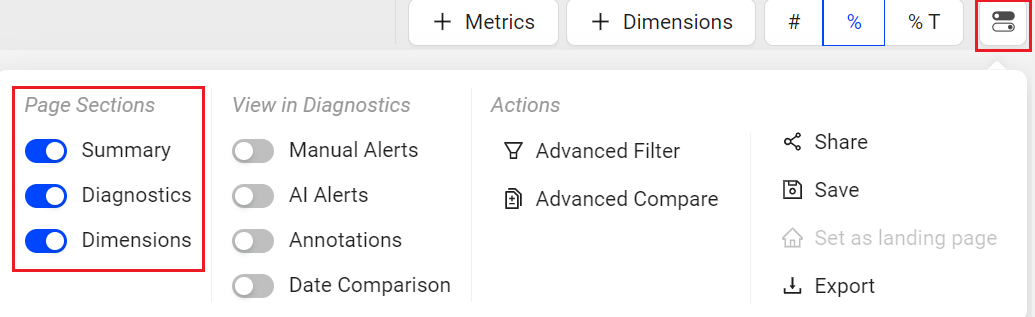
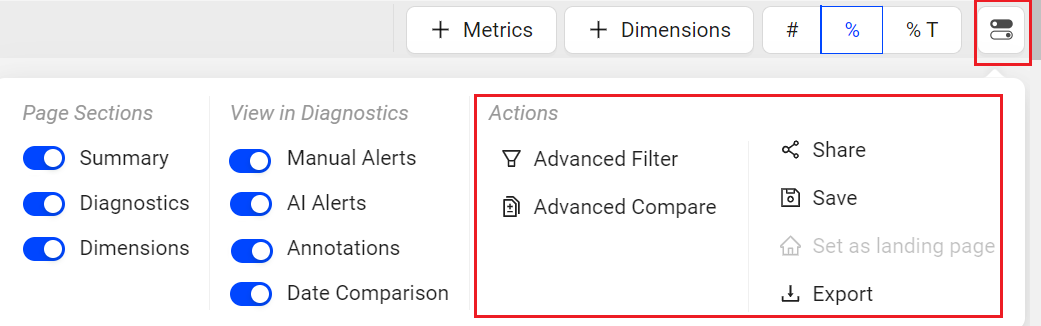
 Page Sections
The Trends displays data in a two-layout structure consisting of Diagnostics (time series), and dimensions. Use the quick toggle on the top right to customize the display.
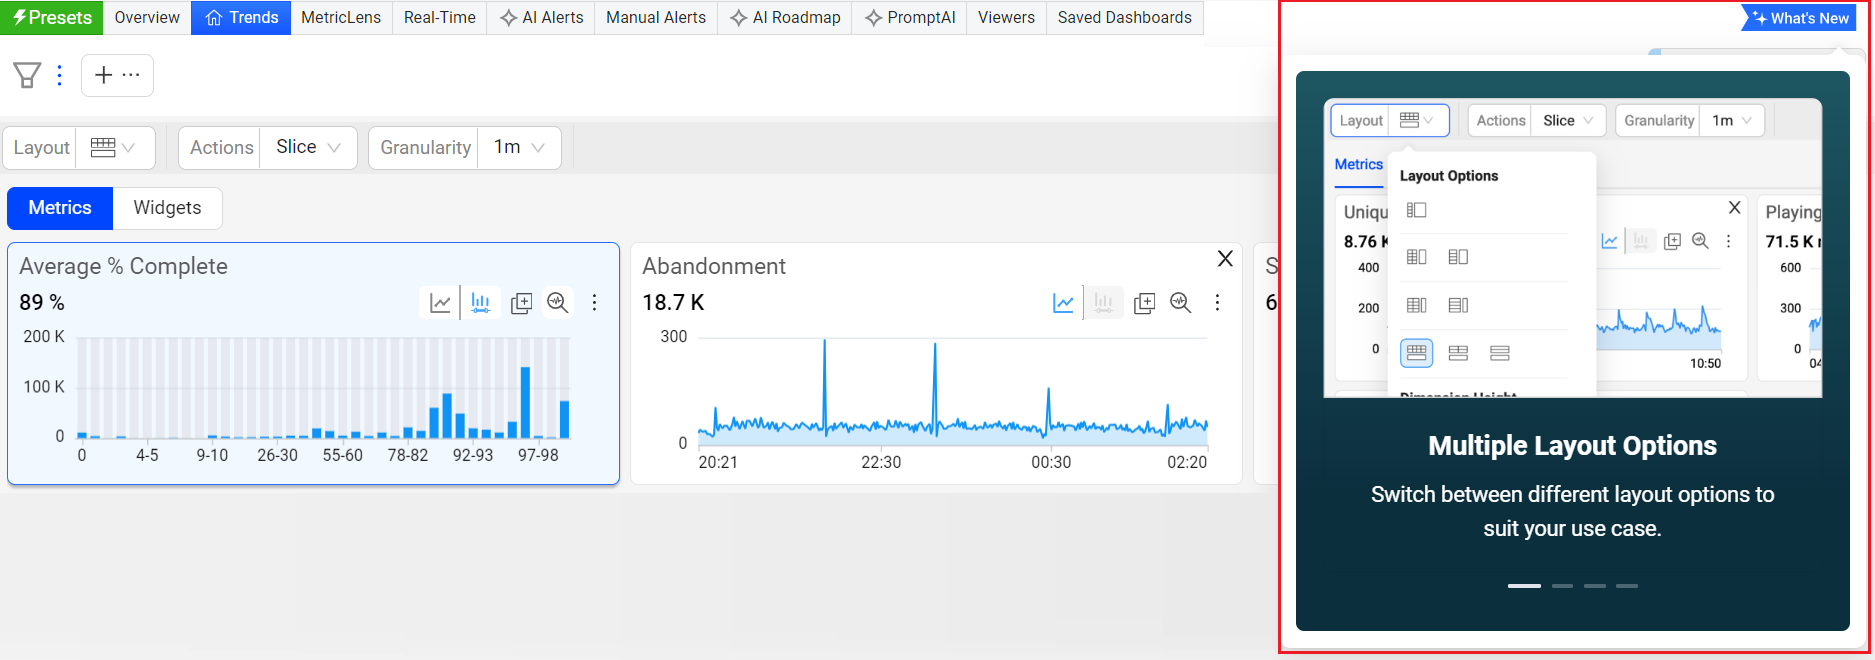
Layouts in Trends
You can select from multiple layout options to enhance your experience and customize the interface to fit your needs. These new layouts allow you to tailor the dashboard’s appearance, giving you greater flexibility to interact with data in a way that aligns with your workflow and preferences.
![]()
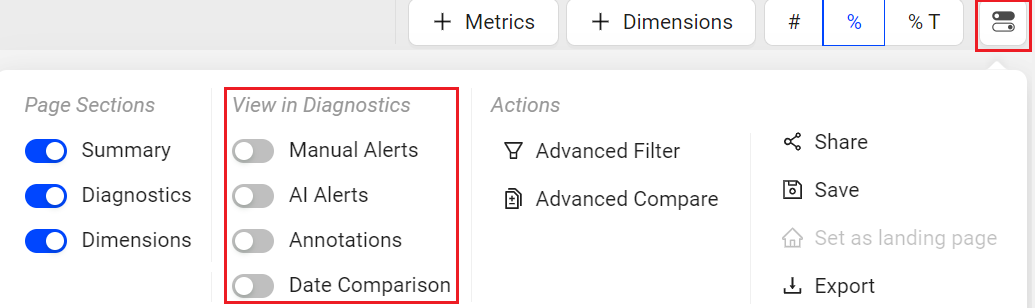
View in Diagnostics
The metric widgets in trends presents detailed information of the selected metric, providing a smooth user experience with the ability to:
-
Toggle on/off the Annotation display
-
Toggle on/off the AI Alerts directly in Trends
-
Toggle on/off the Manual alerts directly in Trends
-
Toggle on/off the Date Comparison
For information on annotating the anomalies, see Annotations.
Trends also provides a new alert summary widget with a heat map. For information on AI and Manual alerts, summary widgets, and heatmap, refer to Trends Diagnostics.
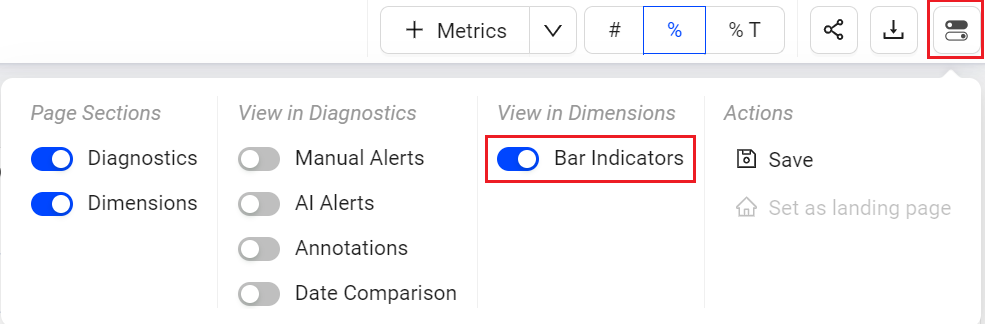
View in Dimensions
Toggle the Bar Indicators to turn the blue indicator bars on or off in the dimension table. When active, the dimension table displays a visual background. Turning it off removes the bars, providing a simplified view of the data.
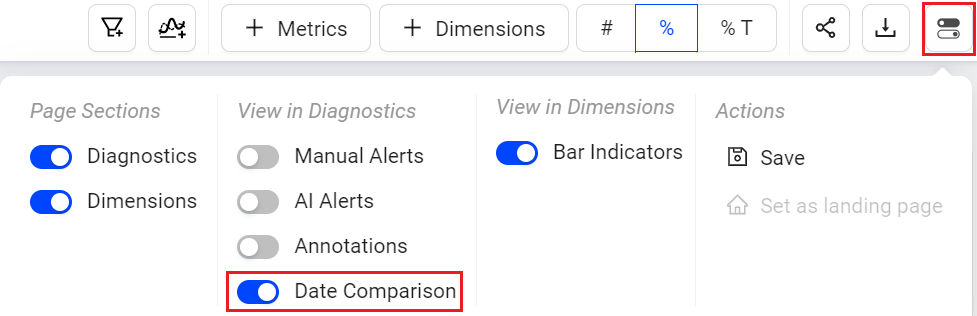
Date Comparison
Date comparison lets you select metrics and dimension values for comparative analysis. Ensure that your current filter settings, such as All Traffic, Live, or VOD, match the data set you intend to use for time series comparisons, as they dictate the metric and dimension values.
For more information on compare, see Compare Mode.
Actions
Trends from the Toggle menu allows you to save, and set the Trends as the default page.
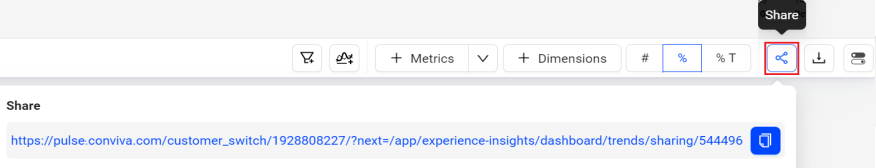
Sharing Trends Dashboard
Click the Share icon in the action toolbar to share snapshots of dashboards with other Conviva Video users. Clicking the Share icon saves a 30-day snapshot of the item and generates a link for collaboration, shared by copying and pasting the link.
Note: SPI selections in shared dashboards are configured independently, so changes in one do not affect the other. Shared dashboards display the SPI setting based on the date the links were generated. Links generated before March 26 default to the Overview setting, regardless of the SPI selection in effect at the time of sharing. Links generated on or after March 26 reflect the specific SPI setting selected at the time of sharing.
Note: Special character and emojis are not supported in the shared links.
Saving Trends Dashboards
You can save the Trends dashboard for reuse and collaboration with other users.
There are two options to save the dashboards:
-
My Dashboards (Private Dashboard): visible only to the owner
-
Public Dashboards: visible to all users
The new publicly-saved dashboard appears in the Public Dashboards list. From this list, you can also share the dashboard with other users, with view-only permissions. Only the owner can edit the data after the dashboard has been saved.
To save the Trends dashboard,
-
Click the Kebab icon on Trends page and select Save.
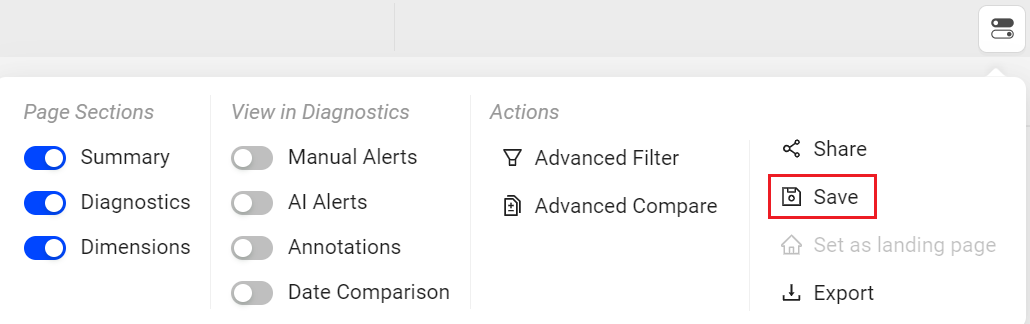
-
On the Save Dashboard screen, give a name to the dashboard. To save this as public dashboard, select the Make it Public checkbox and click Save.
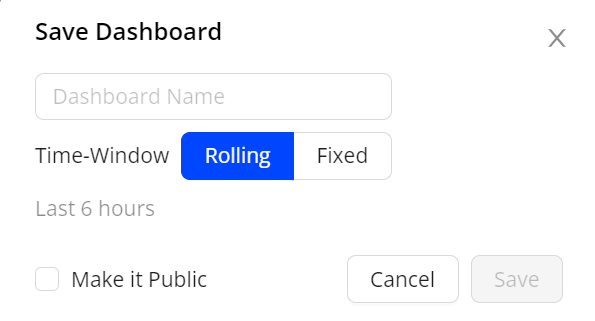
The saved dashboard appears in the Public Dashboards list.
For more information on update, share and delete the saved dashboards, see Public Saved Dashboard.
Export
You can also export the data in .csv format using the Export option in the action menu.
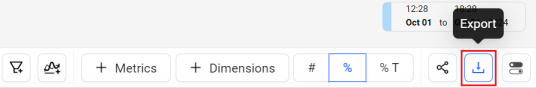
Note: If the dimension table contains a blank column, the system excludes the blank columns during export.
Cloning
Cloning a saved dashboard creates a copy of the dashboard, enabling customization based on the original dashboard settings, for example, expanding the date range. This feature simplifies collaboration and updates while preserving the original saved dashboard.
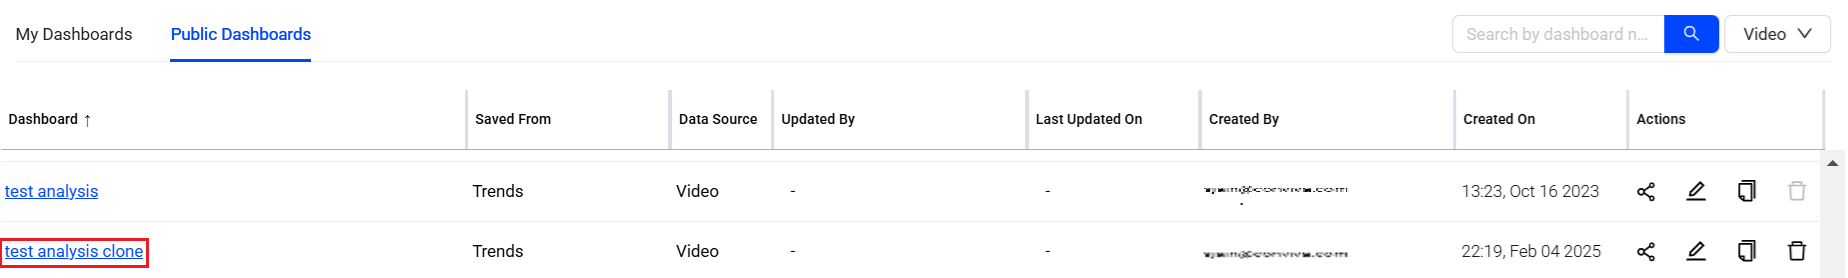
For more information on cloning the public saved dashboards, see Public Saved Dashboard and clone private saved dashboard, see My Dashboard.
Metrics and Dimension Metrics
Metrics
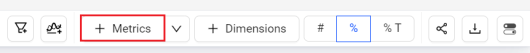
To add the metrics to the Metric widgets and the dimension table,
-
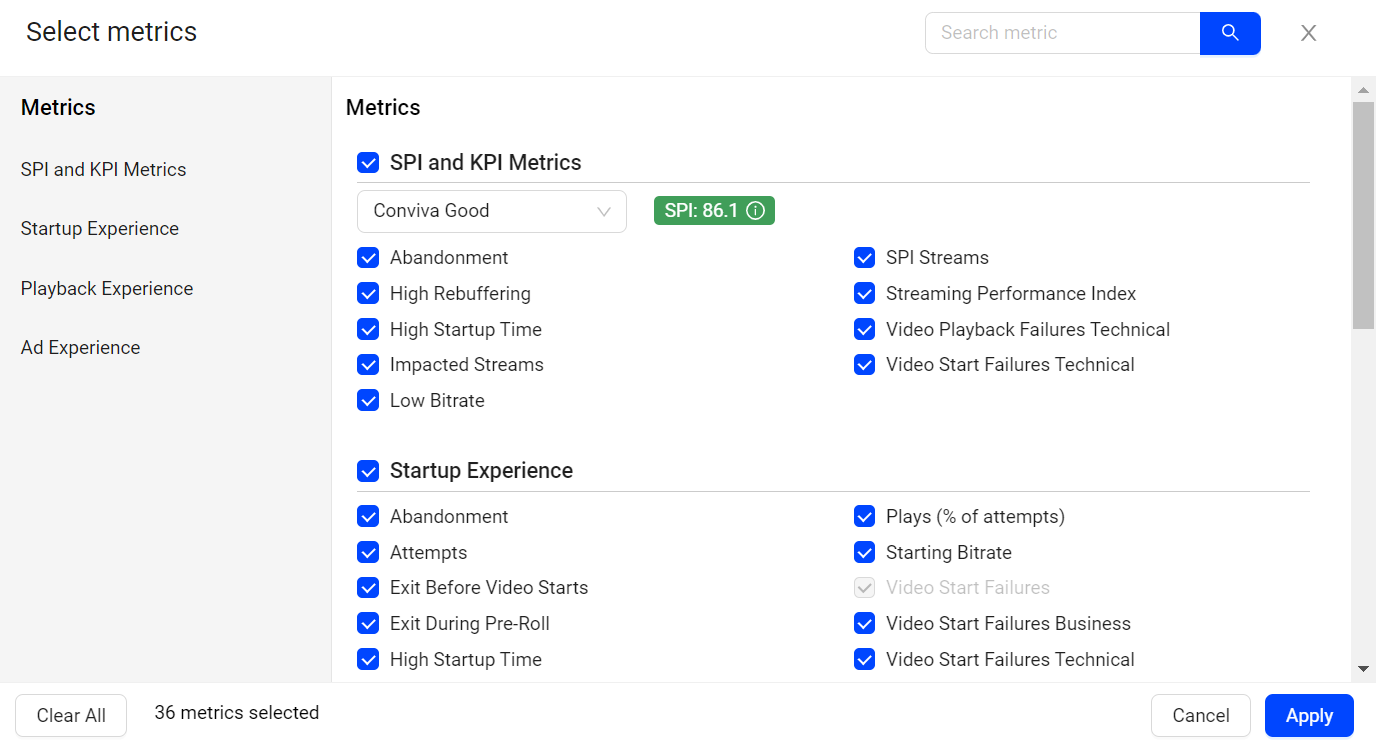
Click the Metrics button in the action bar, to see the metrics slider.
-
Select the metrics from the metric slider and click Apply.
Note: SPI selections in Trends dashboard and shared dashboard maintain and persist their own configuration state. Changes in one dashboard do not affect the other, supporting consistent, context-specific analysis.
Dimension Metrics
To add the metrics to only the dimension table,
-
Click the drop-down next to the Metrics button and click Dimension Metrics, to see the metrics slider.
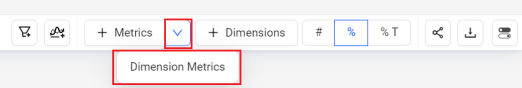
-
Select the metrics from the metric slider and click Apply.
The selected metrics appear as a new column in the dimension table.
Advanced Filters
The Advanced Filters allows you to easily see the conditions applied and modify the filters. This advance mode allows you to change the condition equals and not equals on the fly.
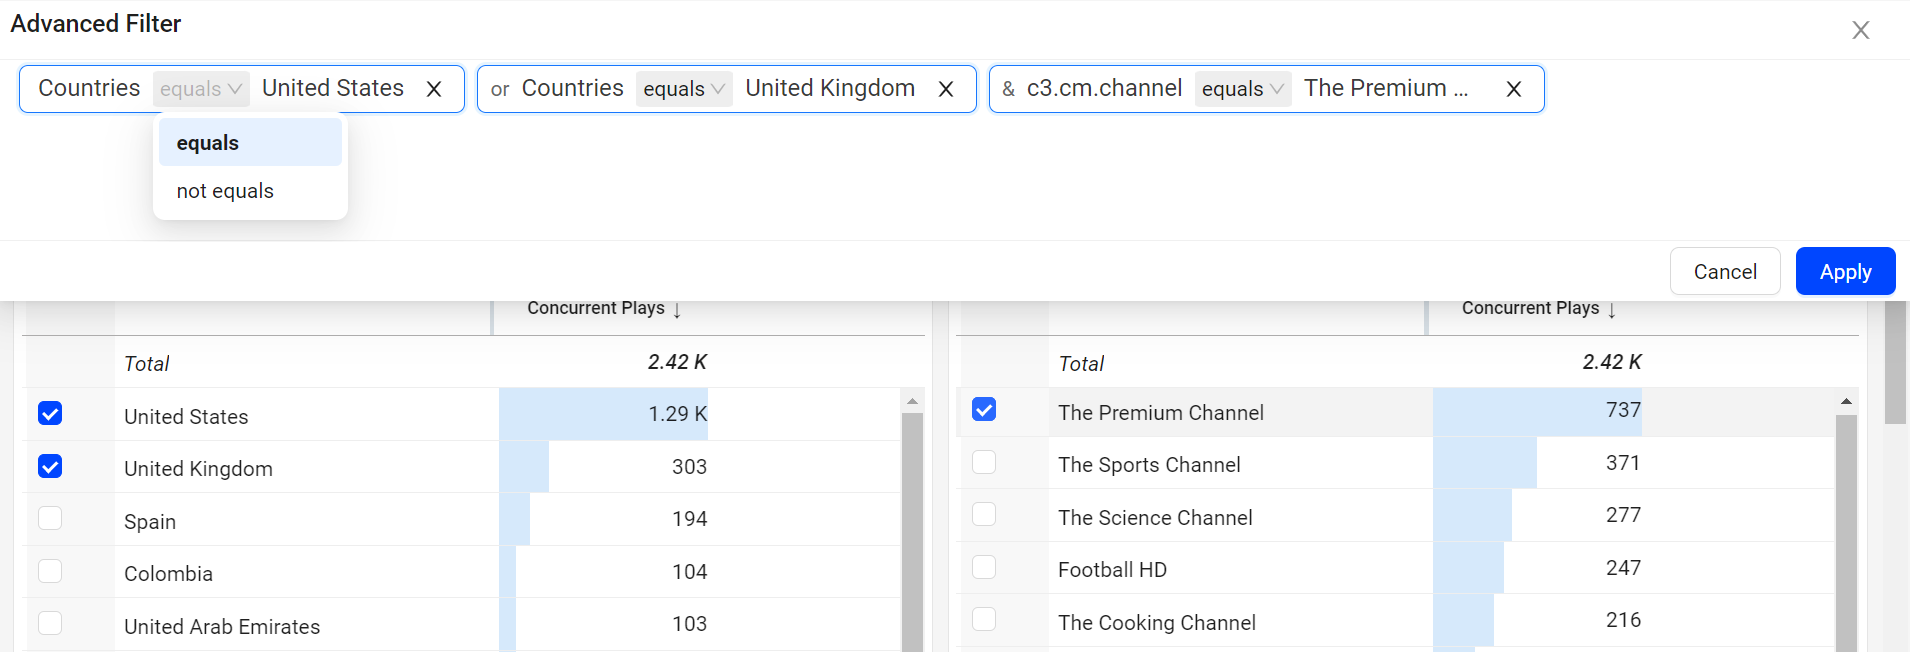
For more information on Advanced Filters, see Filtering.
Advance Compare
Trends provides a new instant compare mode, allowing you to easily compare in advanced modes.
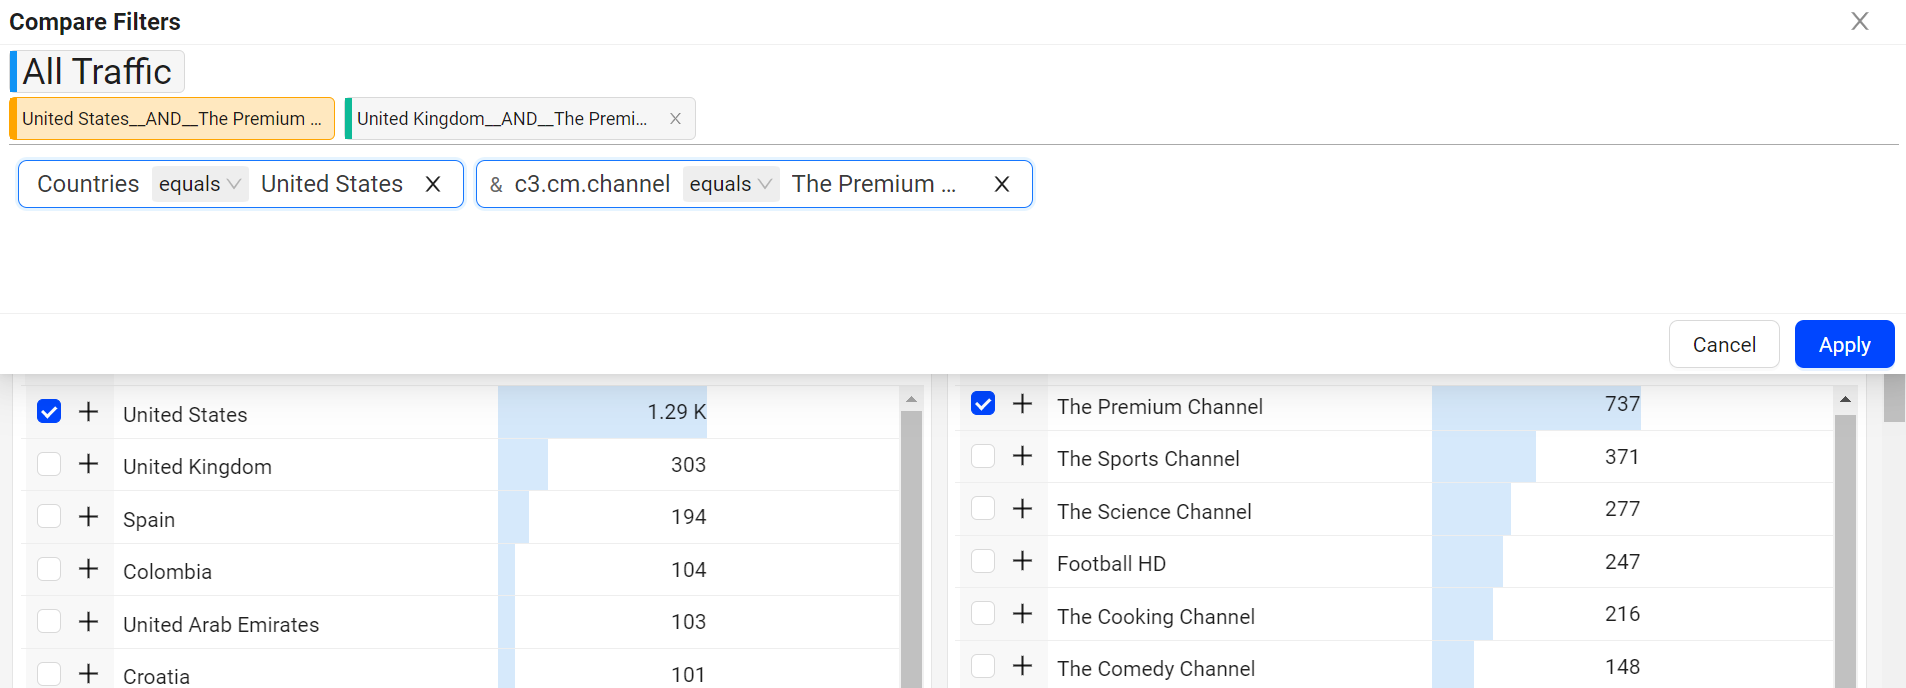
Note: Advanced Compare Mode does not support direct editing of filter details. To modify filter configurations, navigate to the Filter Management and apply the required changes.
Make Default
You can set the Trends dashboard as your default page.
Dynamic Y-Axis
Dynamic Y-Axis narrows the granularity of the y-axis range to focus more precisely on the displayed data points. Pulse calculates the maximum and minimum values, adds appropriate buffers, and determines whether to include the zero position in the y-axis. Excluding the zero position often improves the clarity and interpretation of scatter charts.
Note: Y-axis adjustments are not available when the data range is too large or contains zero values.
For example, the y-axis range changes from 0 – 100 to 50 – 100 when data points fall only between 60 and 100.
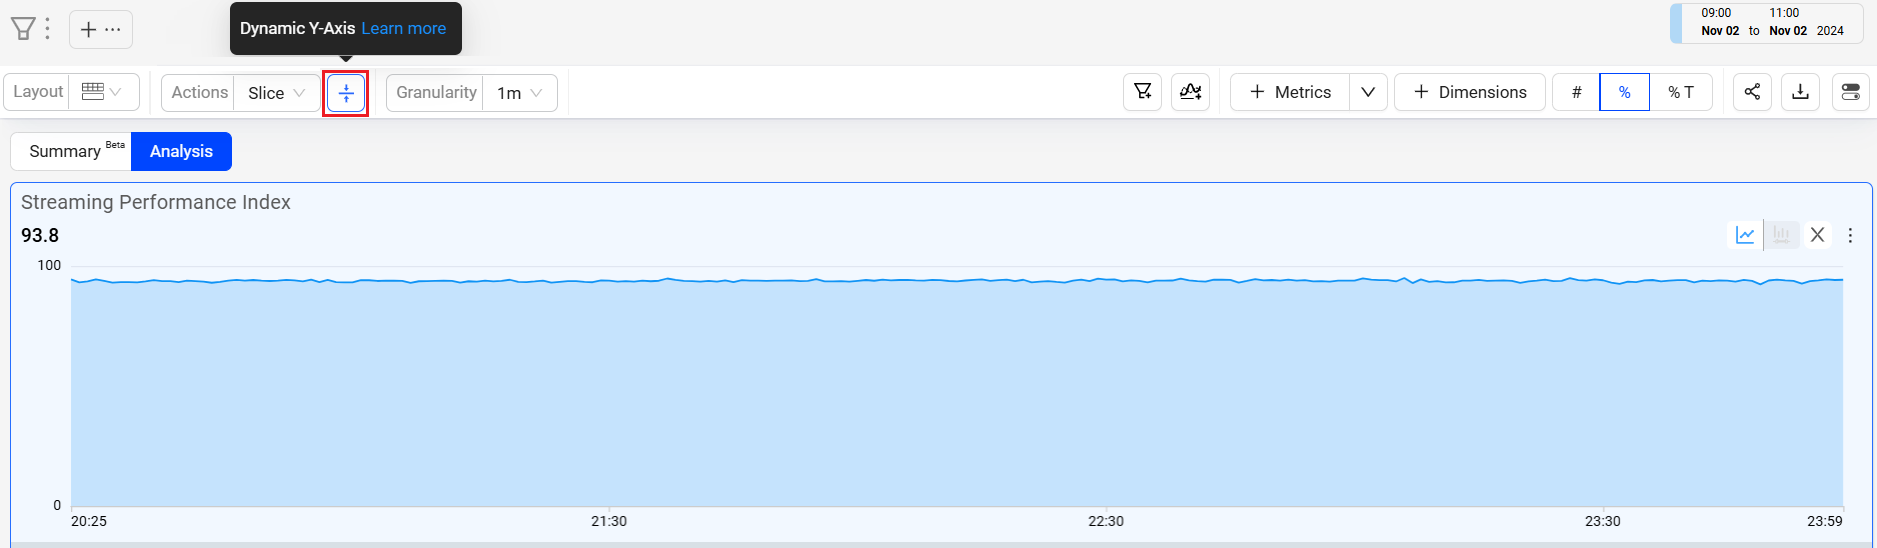
To add Dynamic Y-Axis to time series,
-
Select the desired metrics and click Dynamic Y-Axis icon.
By default, the y-axis values range from 0-100 to show a wide range of variation.
Image: Dynamic Y-Axis icon
Dynamic Y-Axis displays more focused axis points
Image: Dynamic Y-axis displays more focused axis points
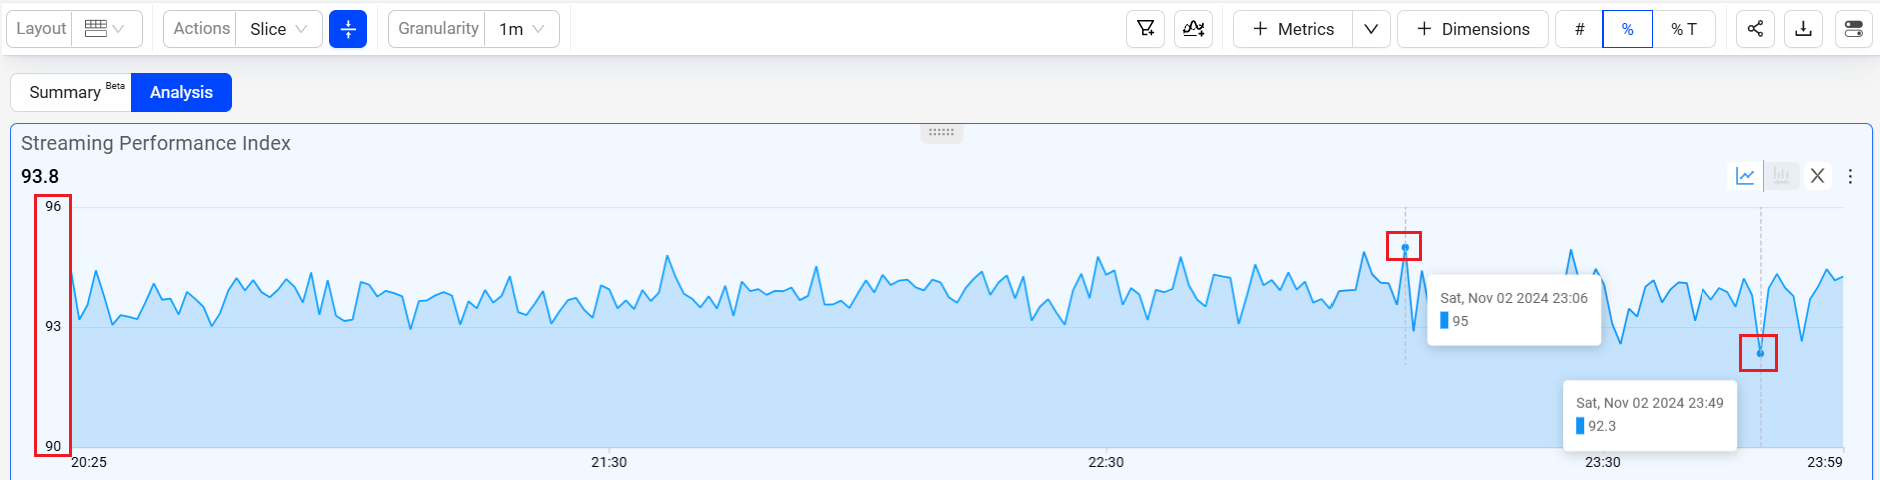
In this example, the y-axis points start at 90 and end at 96, based on the minimum data value in the time series of 92.3, and the maximum value of 96 with added buffer. This adjusted display offers more precise insights into the timeline data points, enhancing the data analysis.
Summary Panel
Quickly determine overall performance based on SPI scores, stream impacts, and key metrics for startup and playback experience.
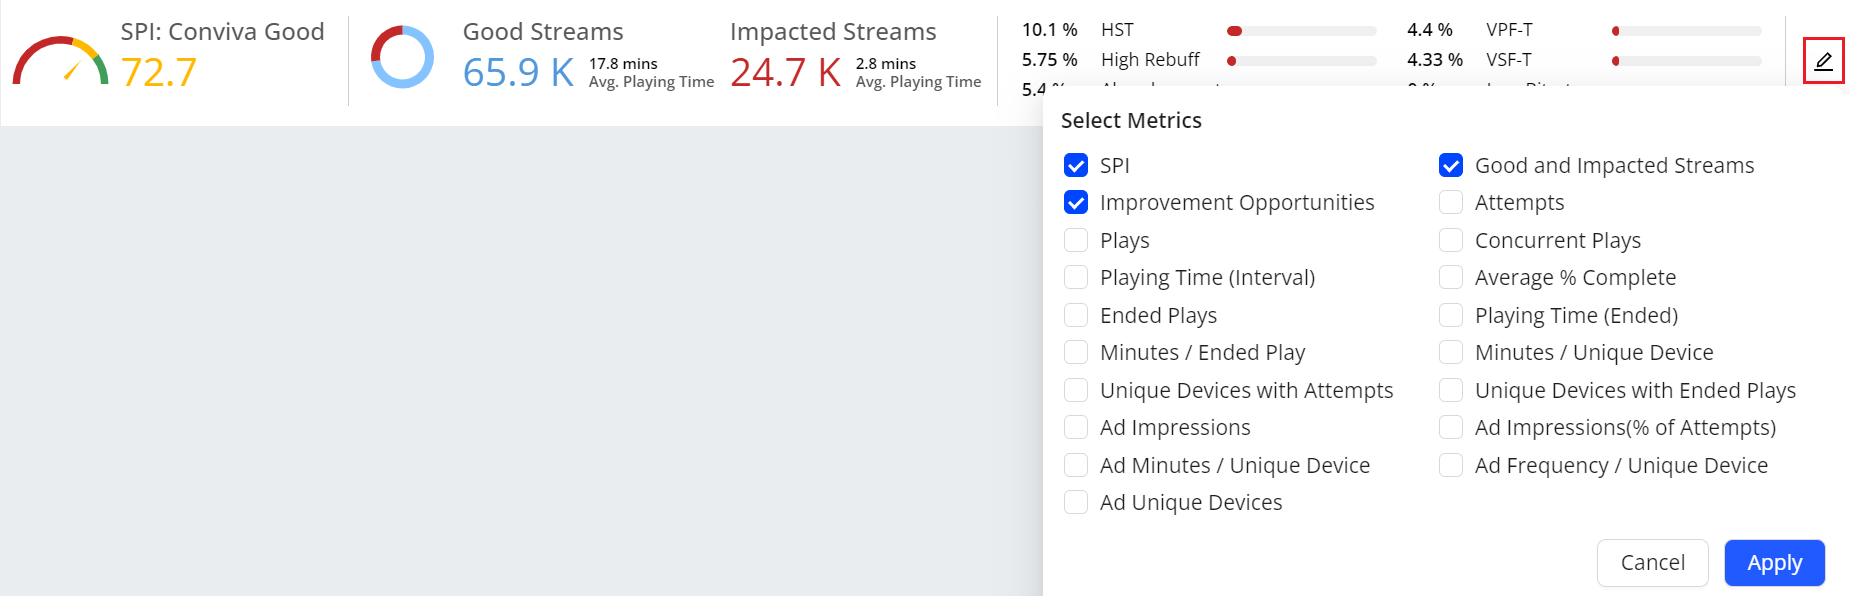
For information on drill down using summary panel, actionability through several features, including SPI, Good and Impacted Streams, Improvement Opportunities (similar to the Overview Dashboard), and an Aggregated Audience Summary, see Summary Panel.
For information on SPIs and it's usecases, see SPI.
What's New
This section provides the introduction of new change in Trends.
Diagnostic Metric Widget
The Diagnostic Metric Widget provides you with the following multiple feature rich options:
-
Trends enable efficient cross-metric analysis by allowing you to move and resize widgets easily.
-
Adjust widget sizes and remove metrics without relying on the metric panel.
-
The focus mode provides the enhanced metric view of the selected metric.
-
Trends distribution mode demonstrates how streaming sessions affect the overall metric value. This helps in discerning whether the metric value reflects consistent session behavior or if session outliers cause variance.
-
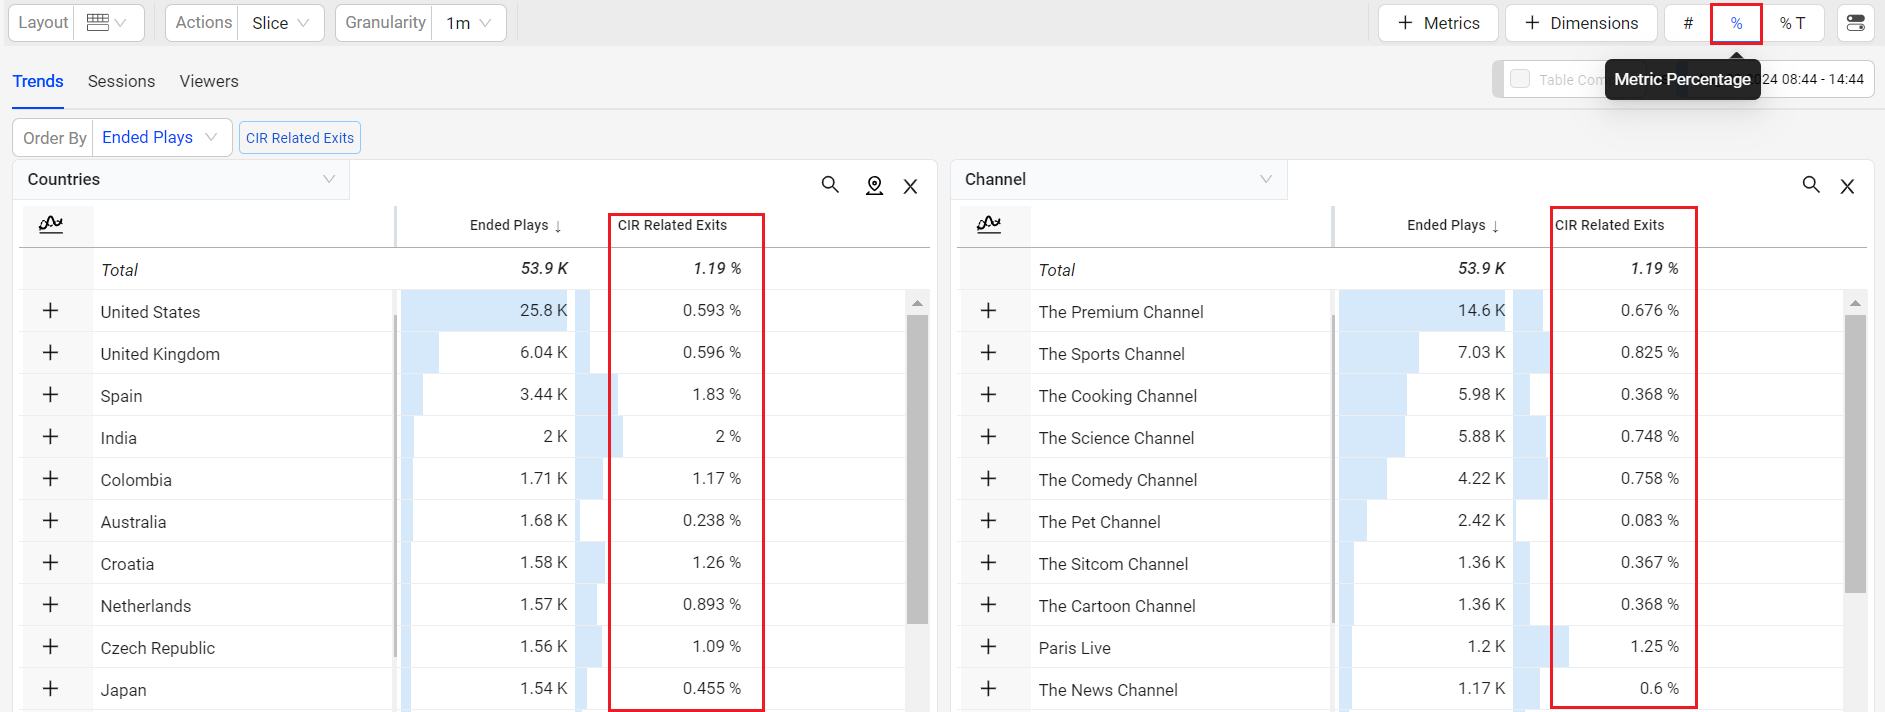
Provides a toggle option to see the metric values in percentage and numbers.
-
Trends allows you to include the basic diagnostic data in the metric widgets. You can incorporate both Manual and AI alert specifics, offering a comprehensive perspective on both types of alerts.
-
Annotation allows you to mark the anomalies in time series during data analysis in timeseries.
-
The Slice option in Trends dashboard provides the option to select a portion of the time line which replicates the same timeline across other displayed metric widgets.
-
Zooming in on the time slice of data in one metric widget, selects the same time slice in the other widgets.
For easy access you can zoom and select in one step using zoom to select.
Trends provides you the option to select the metrics from the metric popup page. Alternatively, you can utilize the search bar to locate the desired metric and select the metrics based on a search query.
To know more information on these features, see Diagnostics Metric Widget.
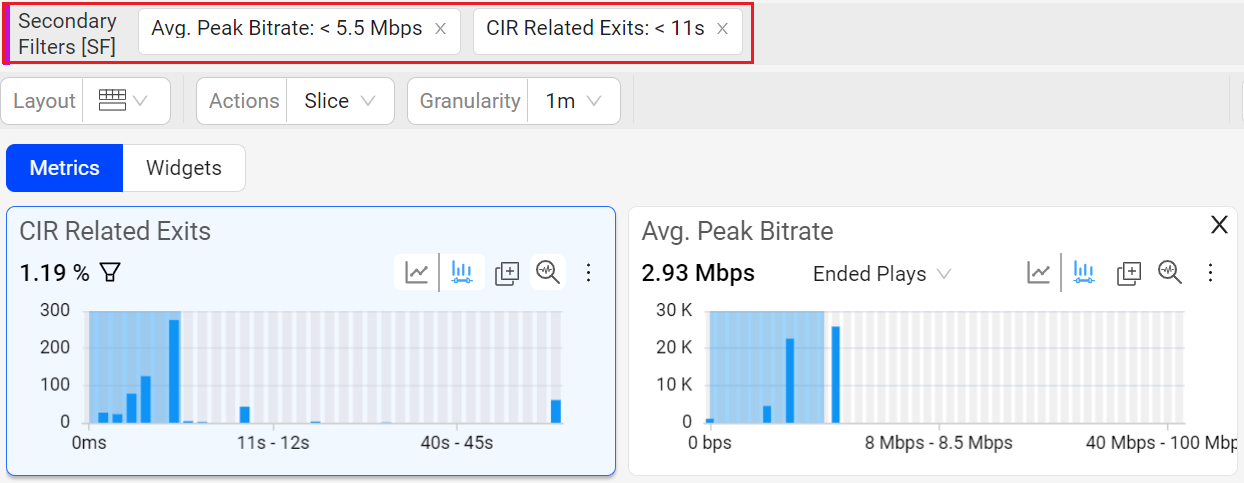
Advanced Metric Filtering
Trends streamlines focused data analysis by employing filters. These filters, categorized as Main and Secondary, offer versatile ways to filter through the data.
Main Filters:
-
Instant Single-click Filtering: Easily apply a filter by clicking on a dimension data entry.
-
Filter Builder: Build the filters using the Trends' Filter Builder feature, available in basic and advanced modes.
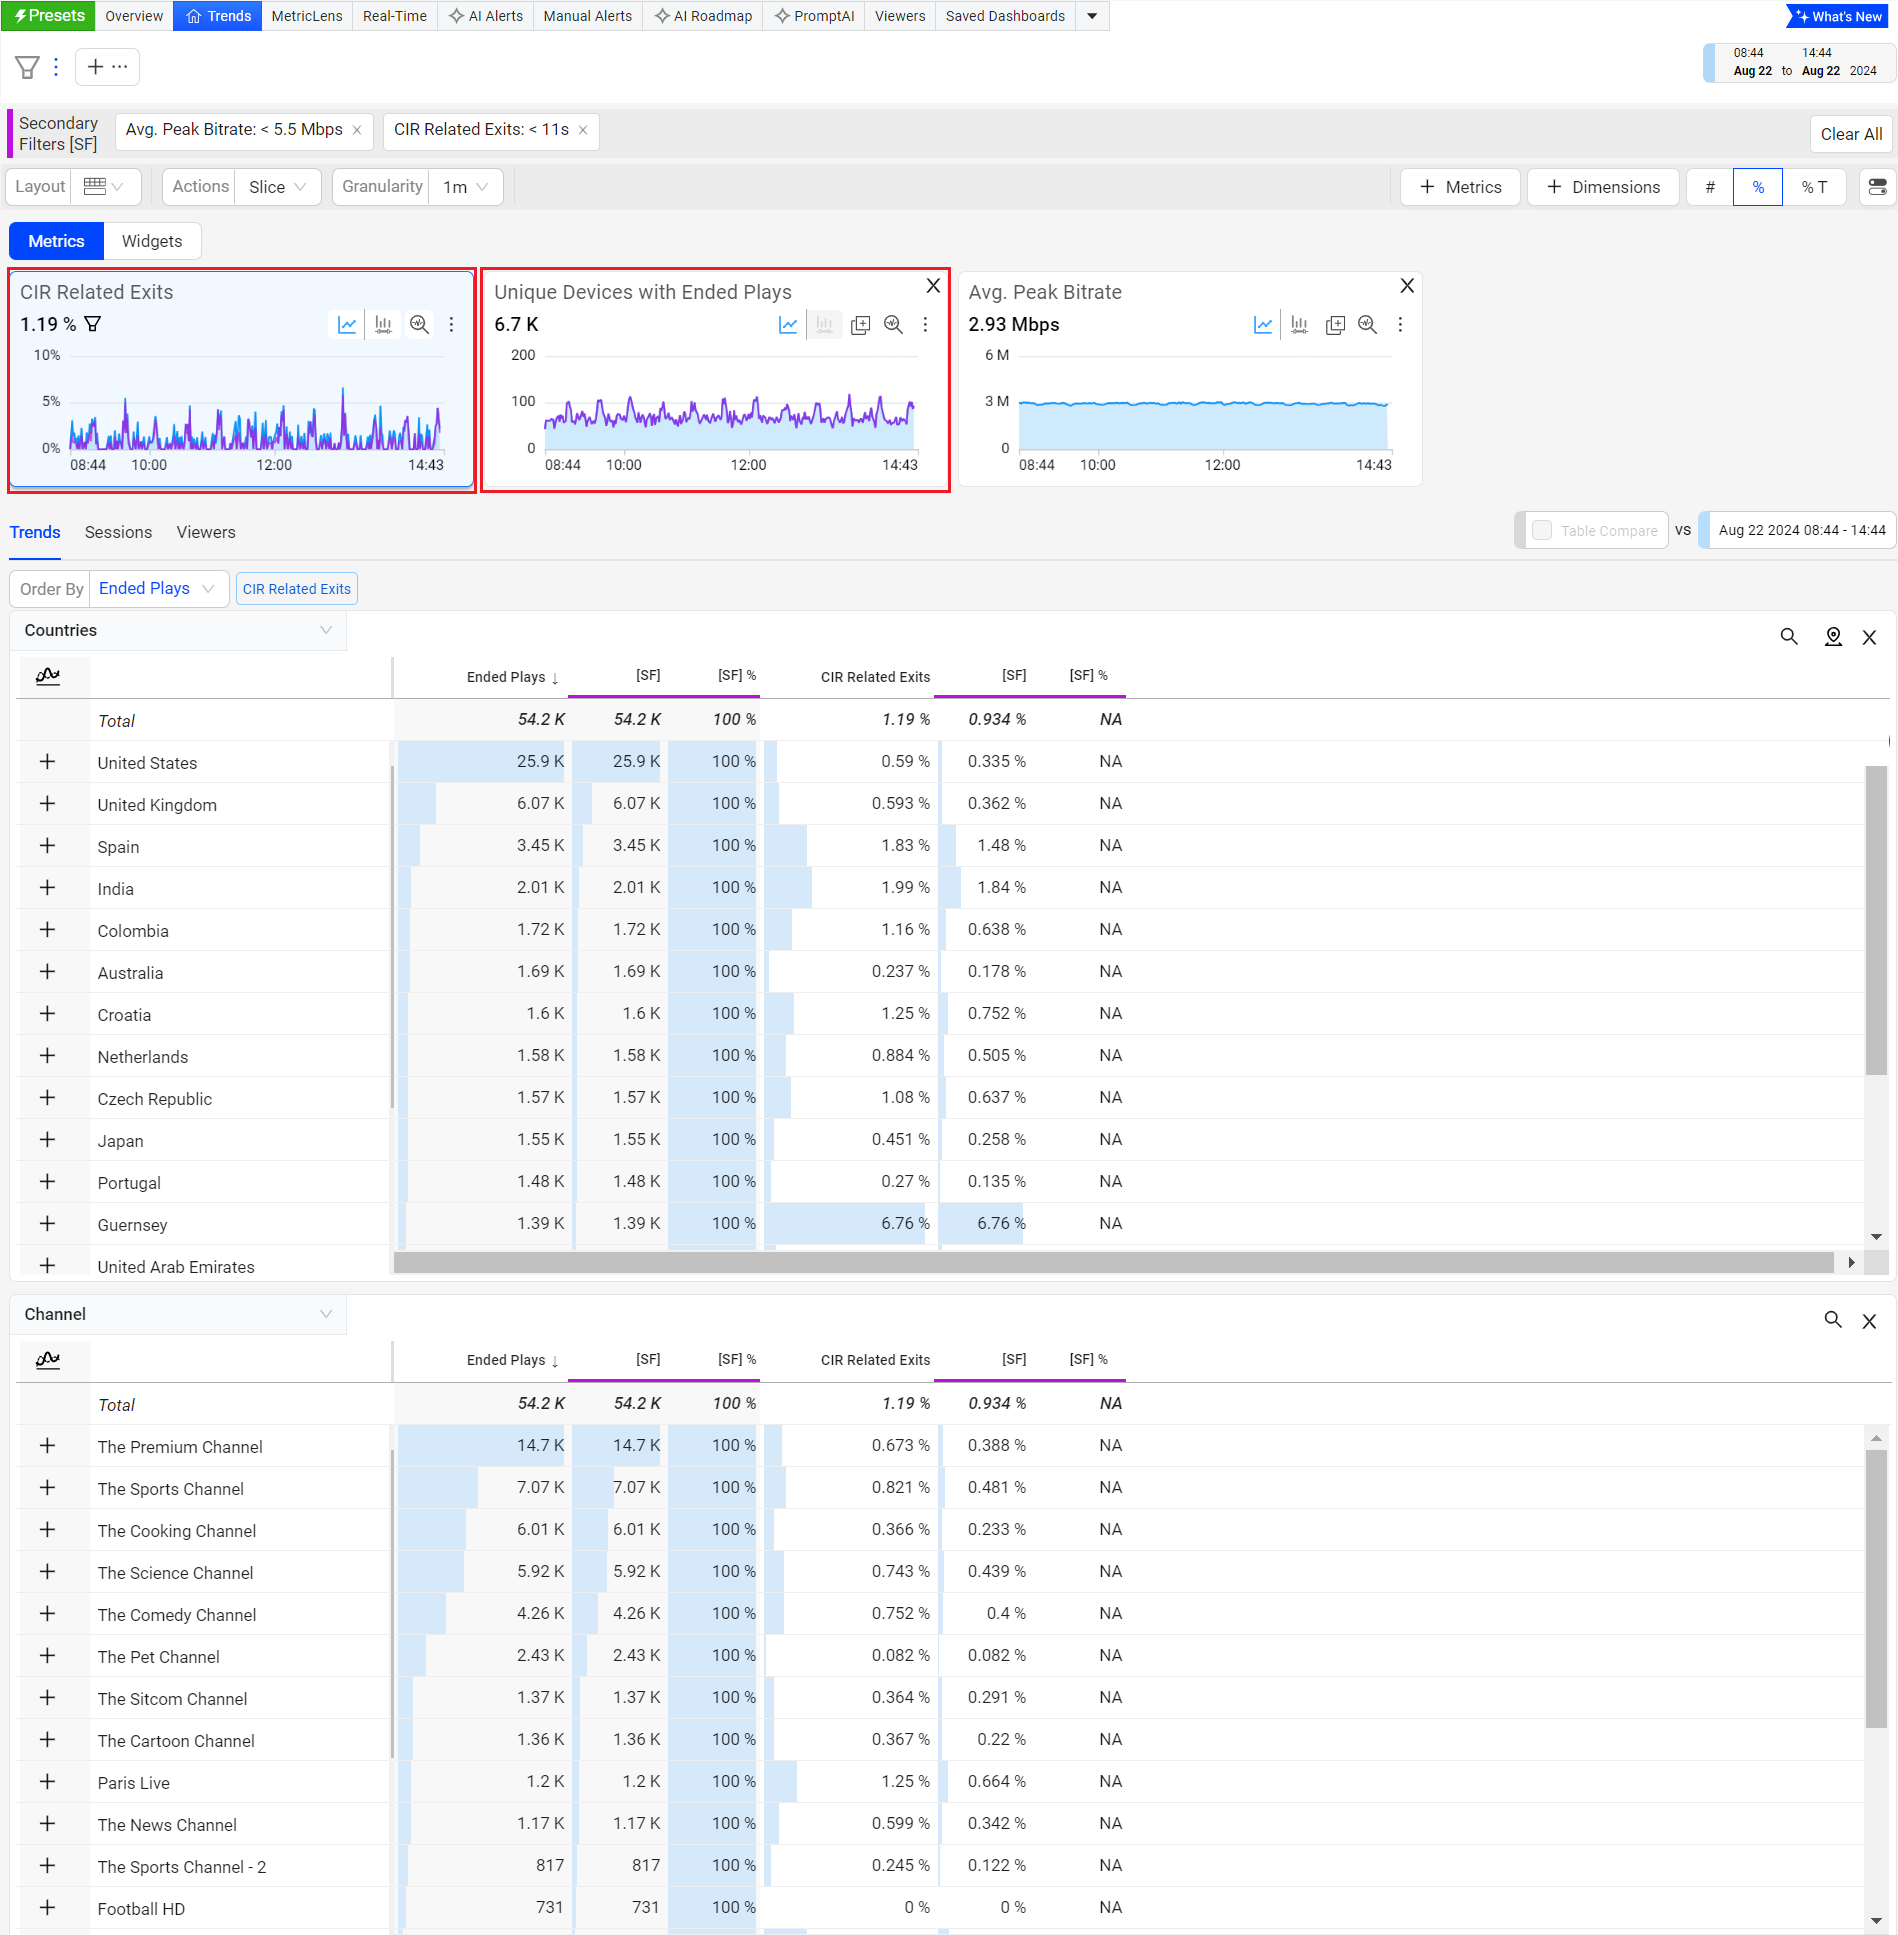
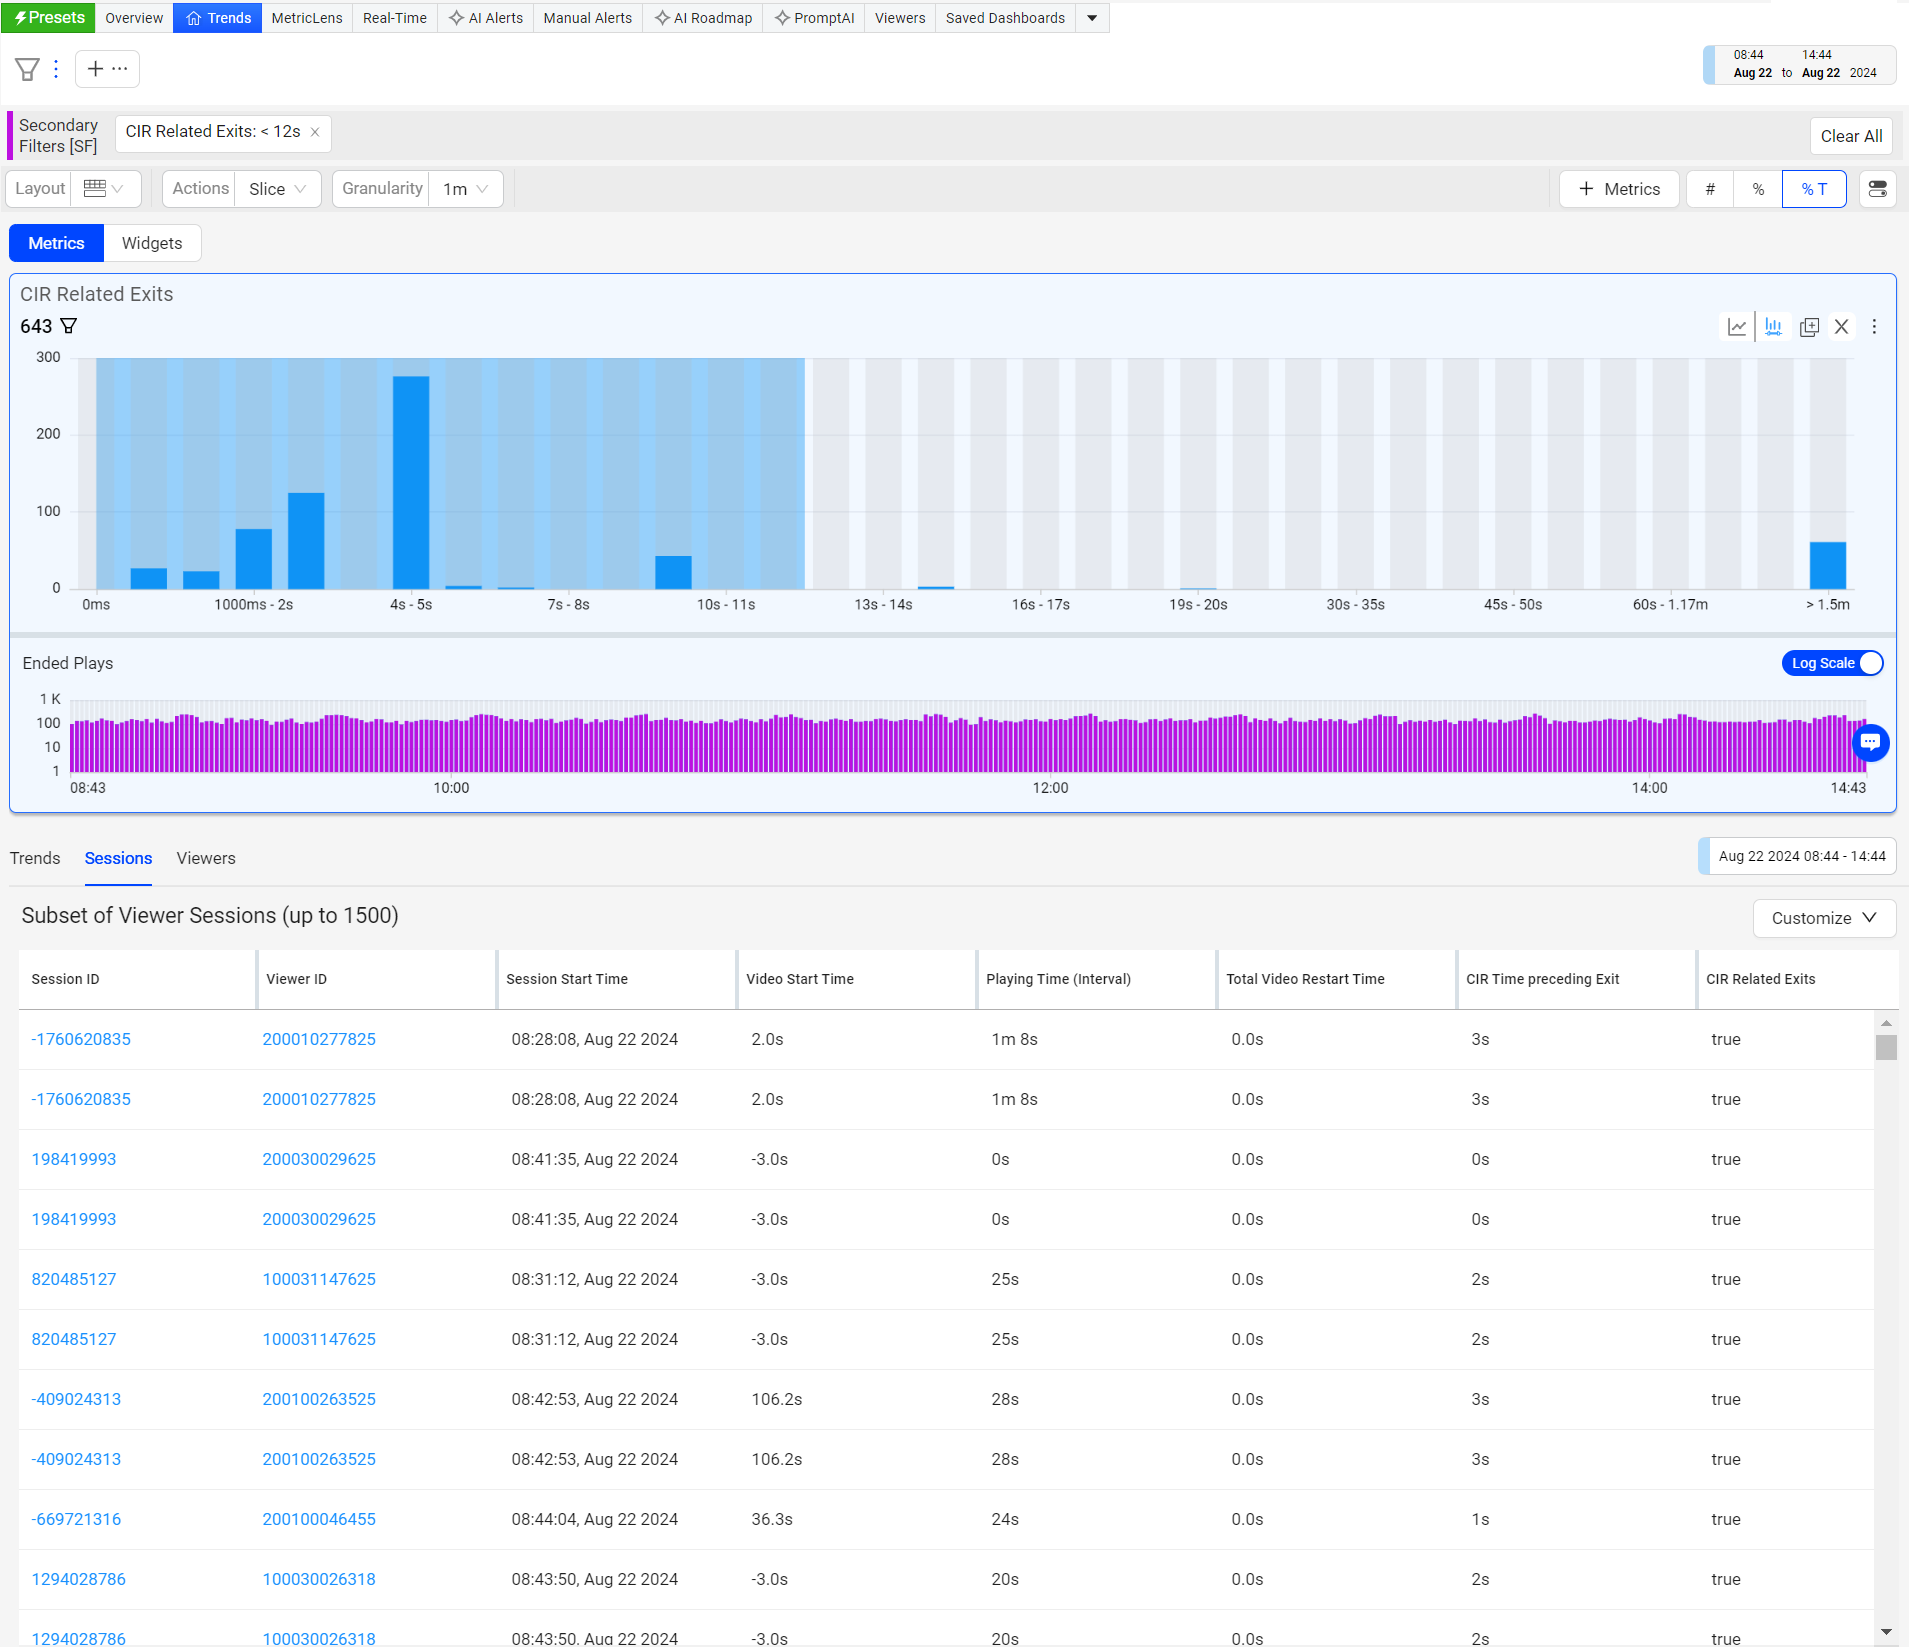
Secondary Filters: Overlay another filter layer on the main filter derived data. Activated by dragging portions of the distribution views in the metric widgets. For example, select areas in the Avg Peak Bitrate and CIRR metric distributions to apply a secondary filter for sessions with high bitrates and high rebuffering, potential ABR issues.
For information on how the filters are applied and see the use case details, see Filtering.
Deep Data Drill-downs (Dimensions, Viewers Sessions, Impacted Viewers)
Add up to eight dimensions enabling advanced analysis across dimension tables for deep drill-downs.
In addition to metric filtering and enhanced data selection, the Trends dashboard enables advanced analysis across dimension tables, viewer sessions, and impacted viewers for more flexible impact and root cause analysis:
-
Up to eight dimension tables
-
Viewer sessions
-
Impacted viewers
For example, you can filter sessions in metric distributions by startup time and rebuffering to analyze the video stream with both high start-up time and high rebuffering. Then, use the dimensional data display for further drill-down analysis of impacted dimensions, sessions, and viewers.
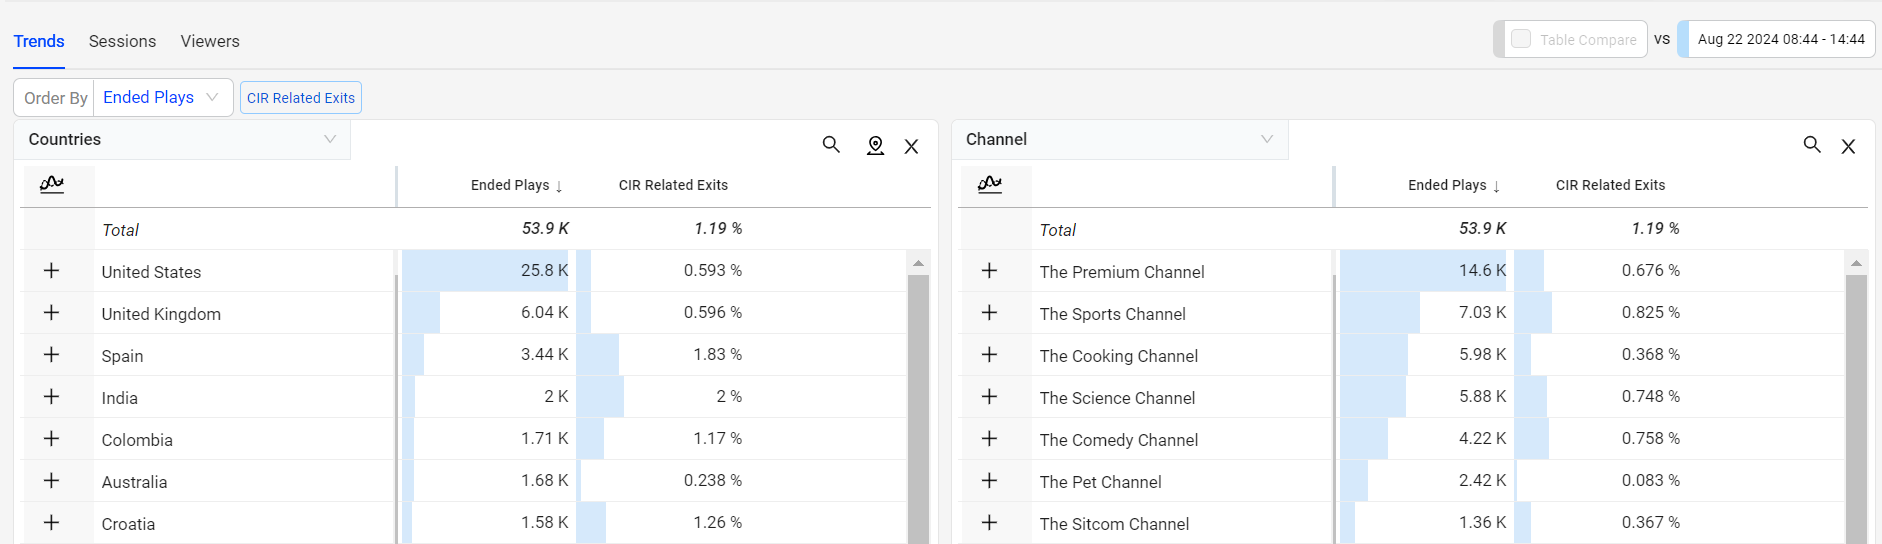
To assist with impact analysis, the Order By option displays up to the top 200 dimension entities in order of the selected metric. Use the sort and search features to rearrange the displayed values.
Note: To find dimension values that are not displayed within the top 200 dimension entities, create a filter with criteria that matches the dimension value, such as asset name contains news or content category equals live.
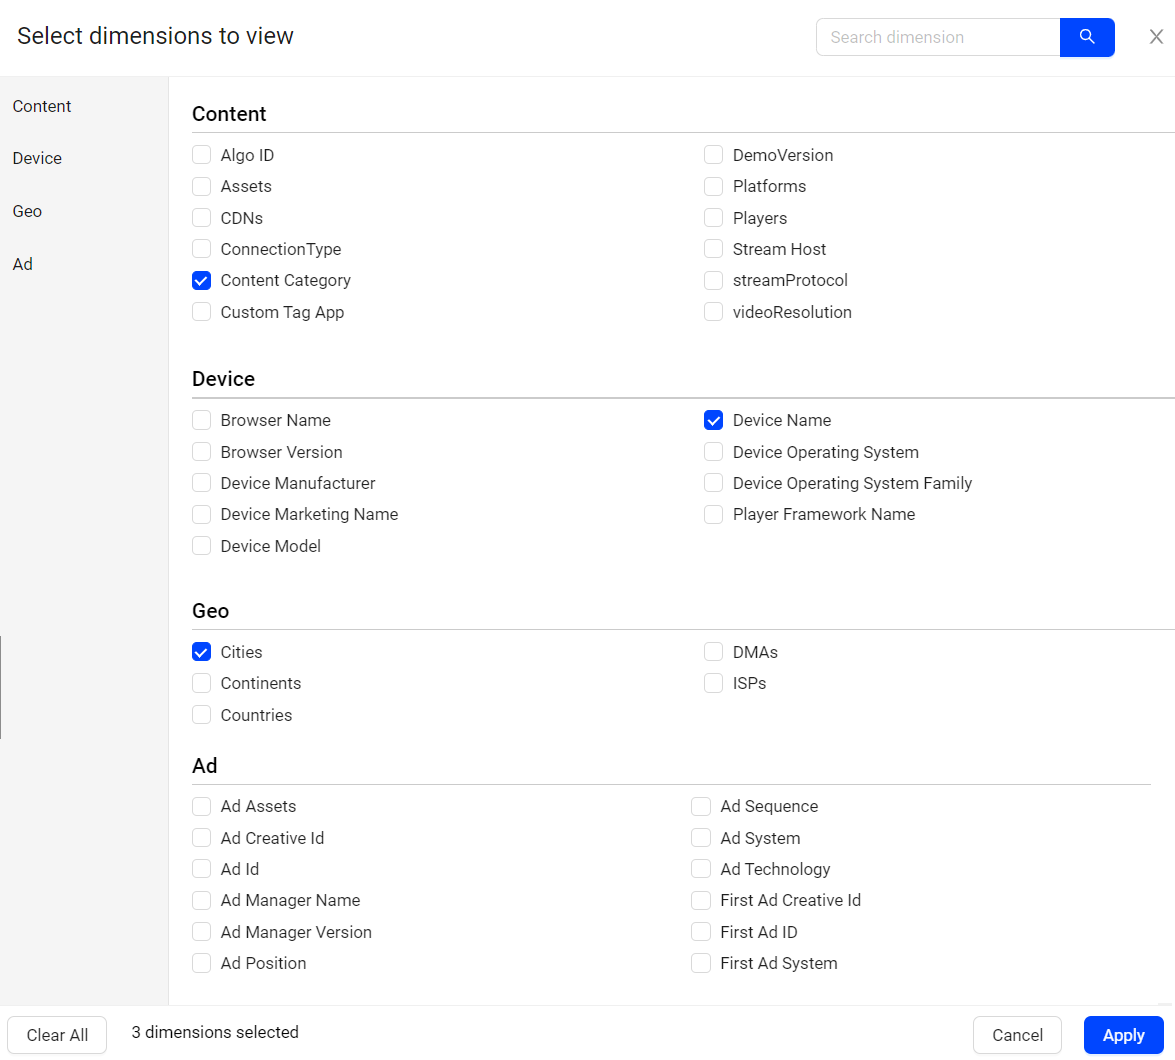
Dimensions Selection
You can select the dimension from the dimension popup page. Alternatively, you can utilize the search bar to locate the desired dimension and select the dimension based on a search query.
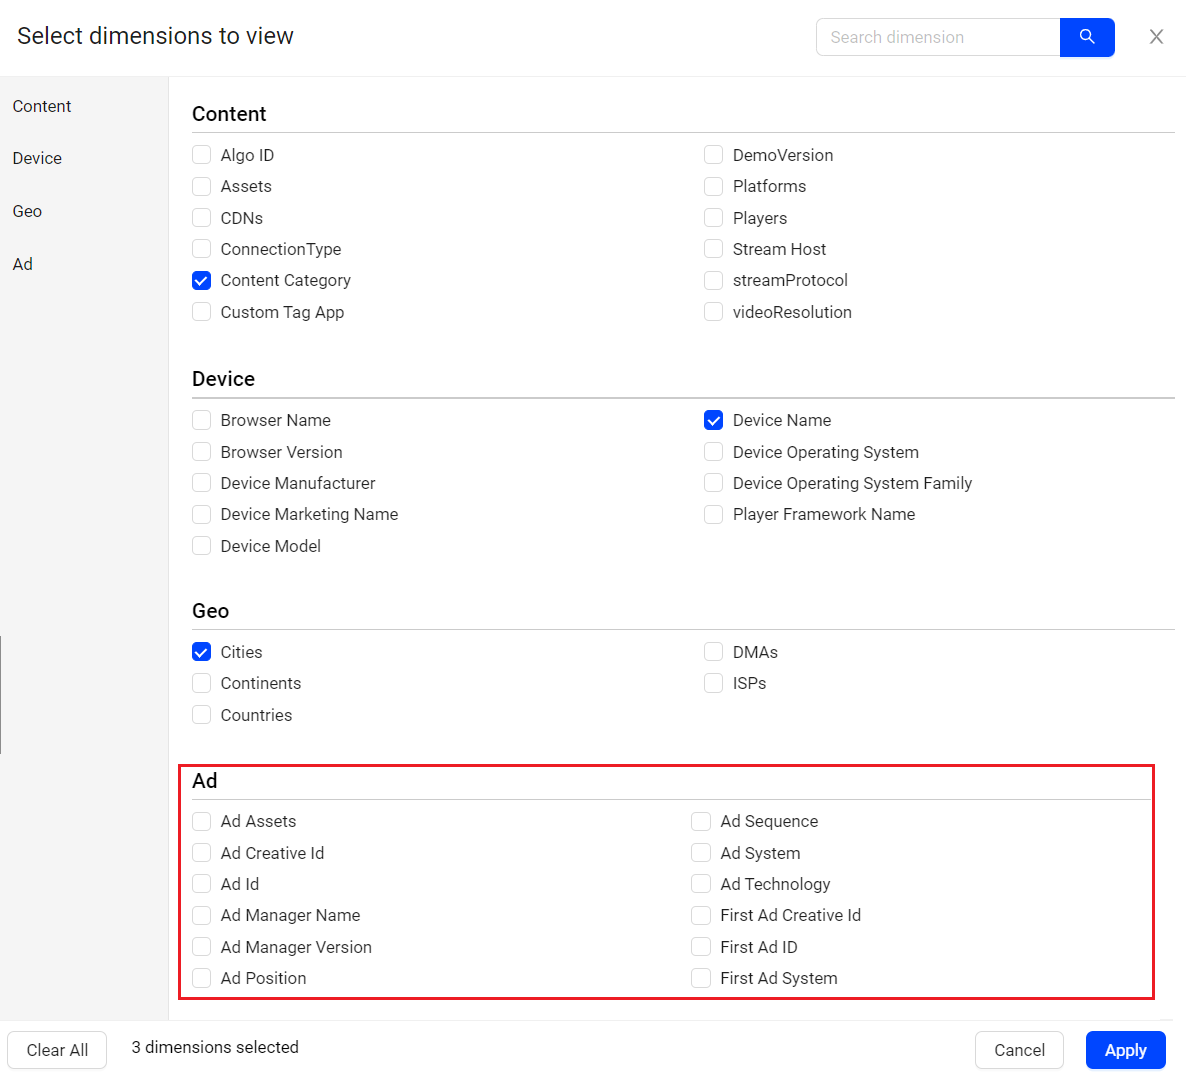
Ad dimensions in Trends
Trends allows you to add the Ad dimension data from the dimension popup screen.
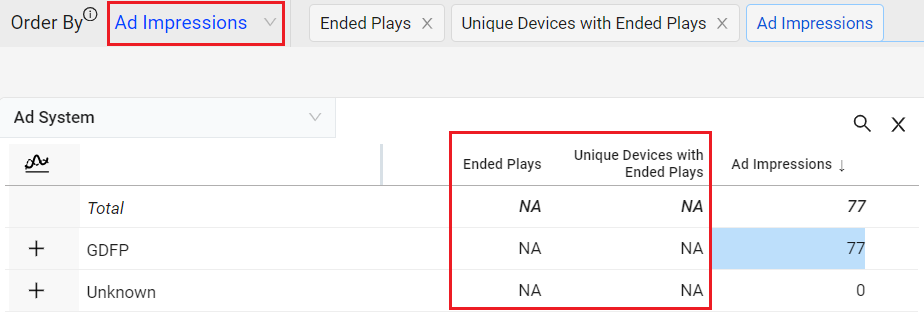
When you add the Ad dimensions,
-
All the invalid/unsupported combinations like Content Metric for Ad metadata are marked NA.
-
Default order by is set to Ad Plays when ad dimensions are selected.
After you slice and dice the data , you can analyze the impact by dimensional analysis by viewer sessions and impacted viewers.
Has Ad as Dimension
For each content session, this dimension indicates if any ad request occurred for pre, mid, or post roll ads (including CSAI or SSAI), even if no ad ever played. After an ad request is detected, the true value persists as lifetime metadata throughout the entire session.
Use this dimension to compare session performance across sessions with ad opportunities and content-only sessions.
Note: This dimension requires proper ad tracking instrumentation (ad pod and ad session reporting). For more details, see ad metric events and the ad integration steps for your platform.
Geo Locations
Conviva supports geographic locations for country and subdivision, based on the country and subdivision levels.
|
Country Subdivsion |
Conviva geolocation reports: |
Example |
|---|---|---|
|
No Subdivision Countries |
Unknown |
Isle of Man, Guernsey, and Puerto Rico |
|
Single Subdivision Countries |
Both the country and first subdivision level |
California, United States |
|
Two Subdivision Countries |
Both the country and the secondary subdivision level |
Cambridgeshire, United Kingdom |
|
Unresolved Subdivision |
Unknown |
--- |
Note:
If the secondary subdivision level is not known, Conviva geolocation reports the country and the first subdivision level, for example England, United Kingdom.
The Conviva geolocations for Italy always use only the first subdivision level, for example Sicily, Italy.
ASN as Dimension
Autonomous System Number (ASN) is a unique numerical identifier for a group of IP prefixes within an autonomous network, which is crucial for making decisions on how to forward data across the Internet, ensuring efficient traffic control, security, and operations, particularly in multi-homed setups with multiple Internet service providers (ISPs). An ASN might be associated with multiple ISPs and vice versa.
For more information on dimensions, see VSI Trends - Dimensions and DPI Trends - Dimensions.
Dimensional Data (Trends, Viewer Sessions, and Impacted Viewers)
Trends
The trends dimension data displays the readings as per the applied primary and secondary filters. This helps you to analyze the data and check the anomalies if any.
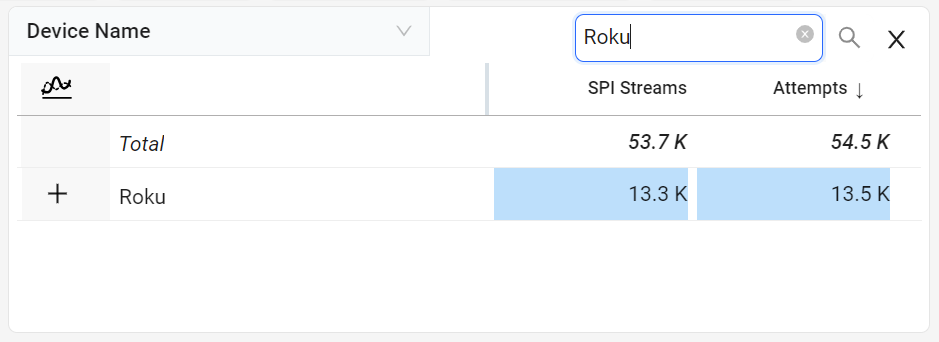
You can search the required dimension data using the search box.
Note: The dimension data are mobile responsive and appear piled up on mobile devices.
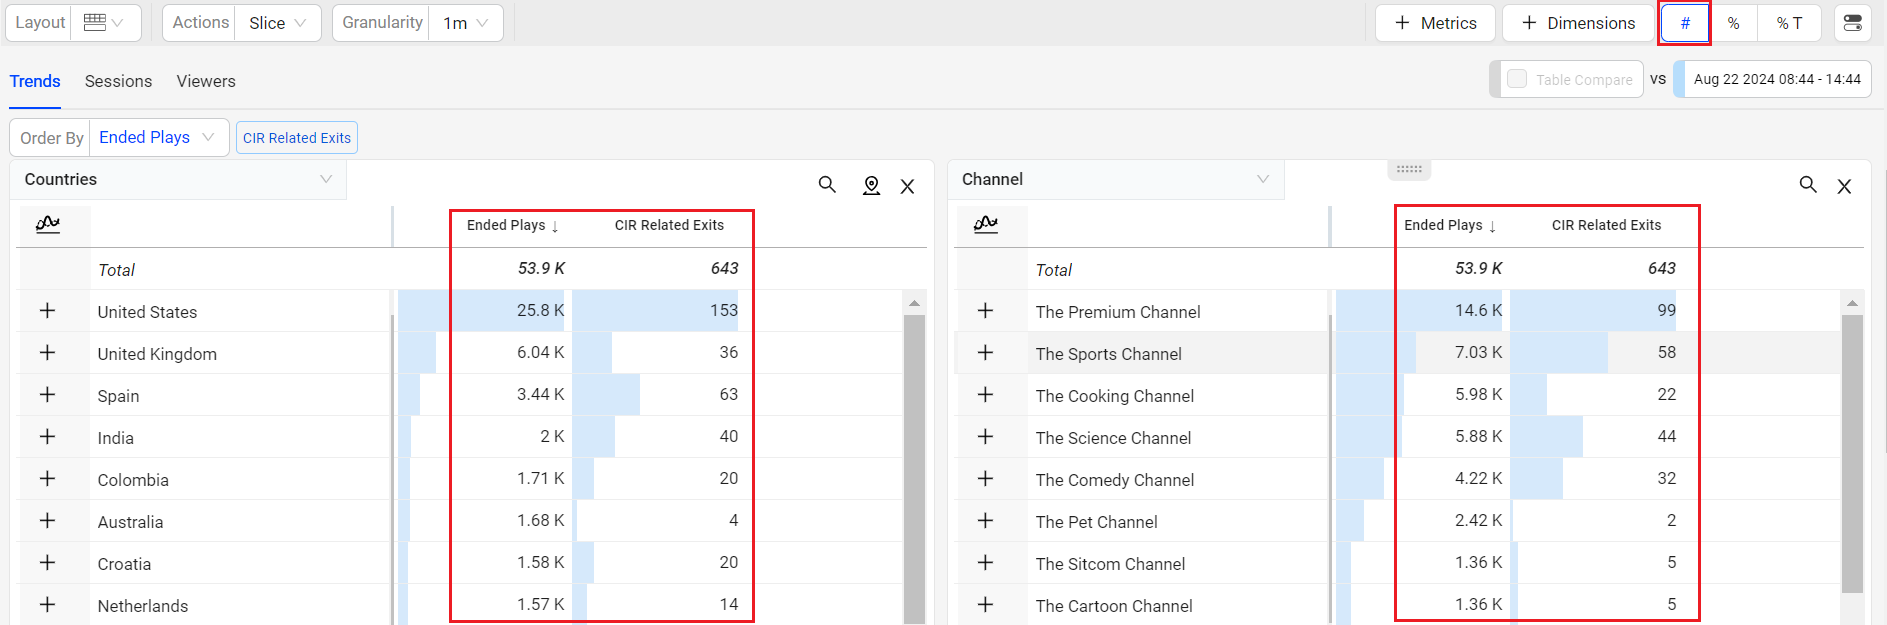
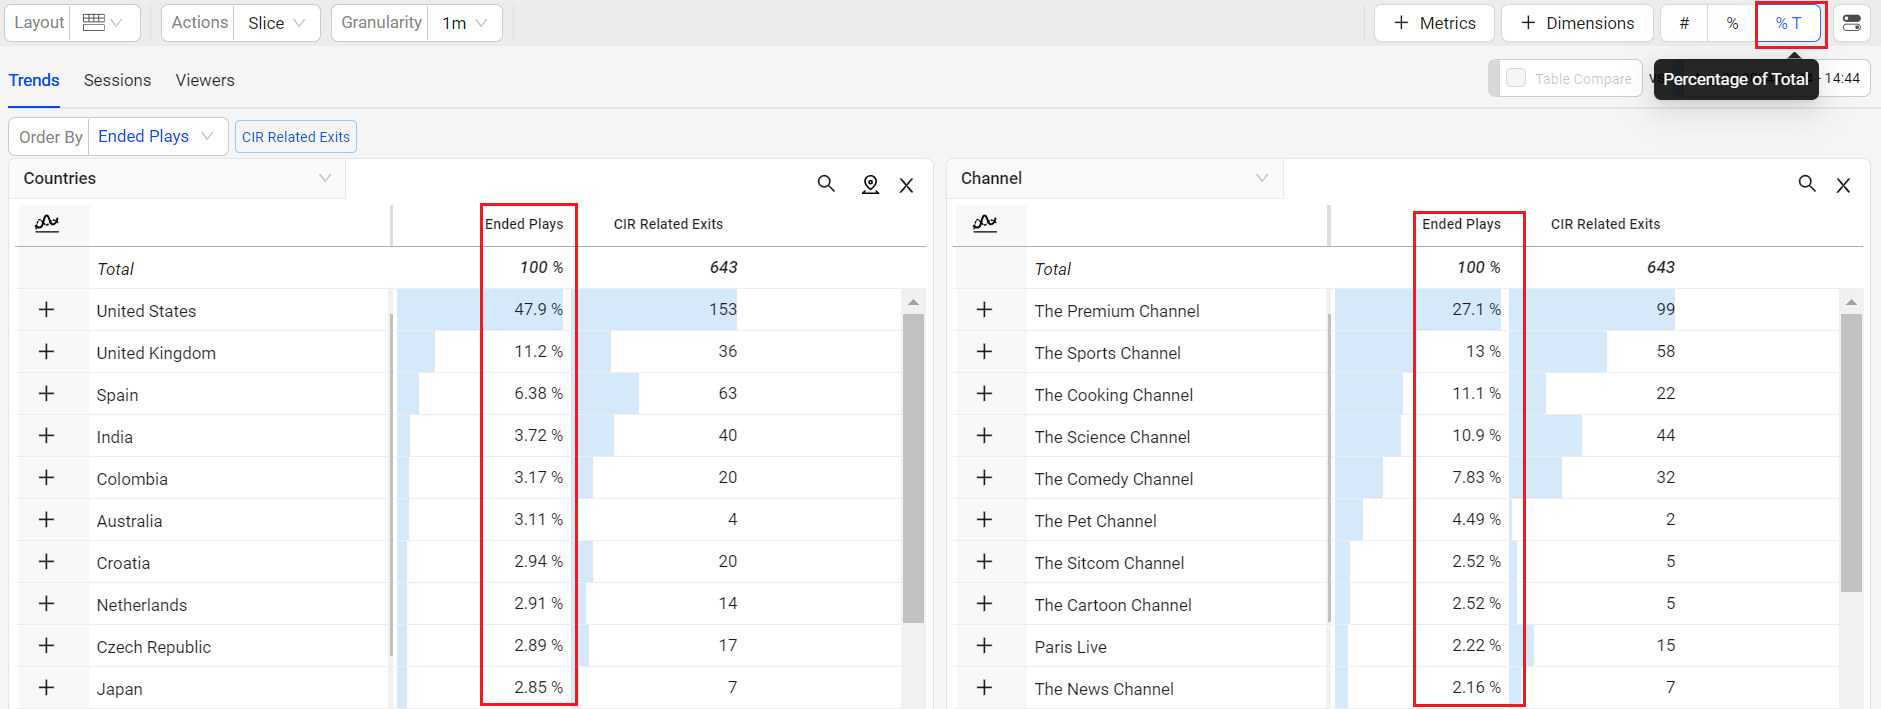
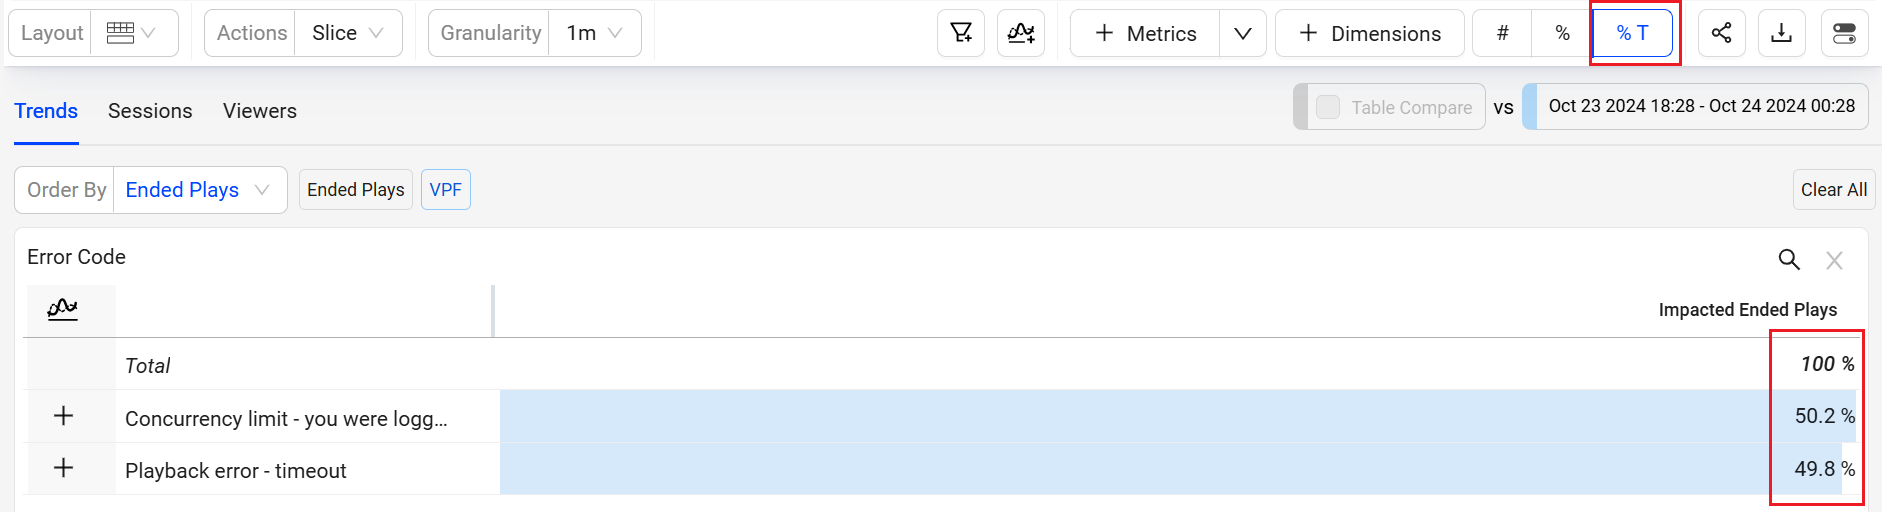
You can also view the dimension data in Numbers, Percentage, and Percentage of Total. Because multiple error codes typically occur in ended sessions with VPF, the sum of all the error code counts may be more than the overall Total.
| # | % | %T | |
|---|---|---|---|
| Total | Count of ended sessions with VPF. | Percent of Ended Plays with VPF | n/a, displays count |
| Error Code |
Count of ended sessions that had this error code. Typically, multiple error codes occur in ended sessions with VPF. |
Percent of Ended Plays with this error code. | n/a, displays count |
Rearrange Metric Columns
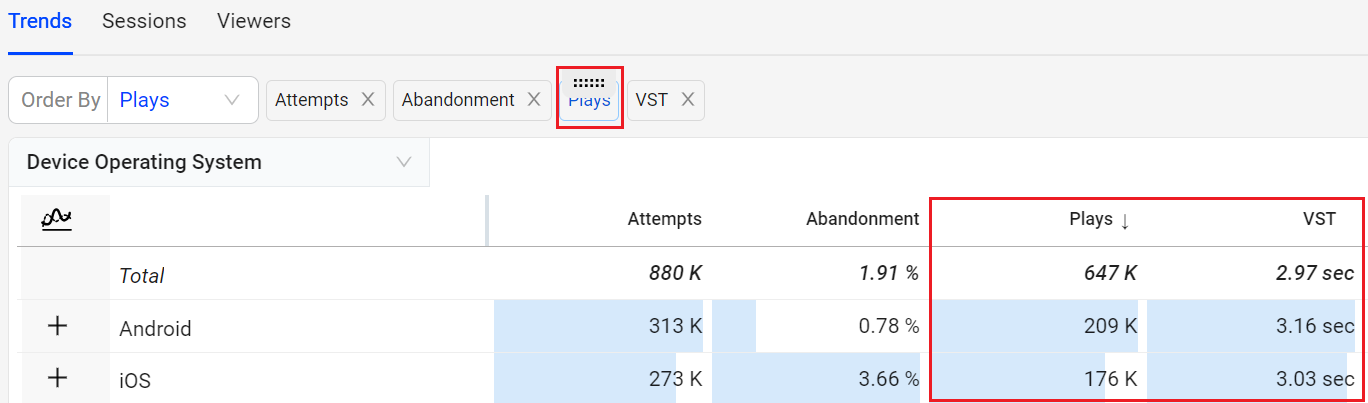
Trends provides an option to rearrange the metric columns using the Rearrange icon. Press and drag the metric label to rearrange the columns for easier analysis. Custom metrics and secondary metrics stay together when you move either one.
Dimension data in Numbers
This displays the number of impacted sessions within the selected time period.
Dimension data in Percentage
This displays the number of impacted sessions in percentage out of the total displayed sessions within the selected time period.
Dimension data in Percentage of Total
This displays the percentage of impacted sessions for the displayed dimension values within the selected time period.
Viewer Sessions
Viewer Sessions enables the analysis of overall metric performance across the sessions in the current interval and for the selected time ranges of spikes and anomalies.
Use one-click filters or combinatorial filters to select dimension values to filter the impacted sessions. You can export the displayed data using the export option in the action bar.
Note: c3.[accountname] is mentioned in the exported file.
For more information on viewing the impacted sessions and drill into the viewer experience issues, see Viewer sessions.
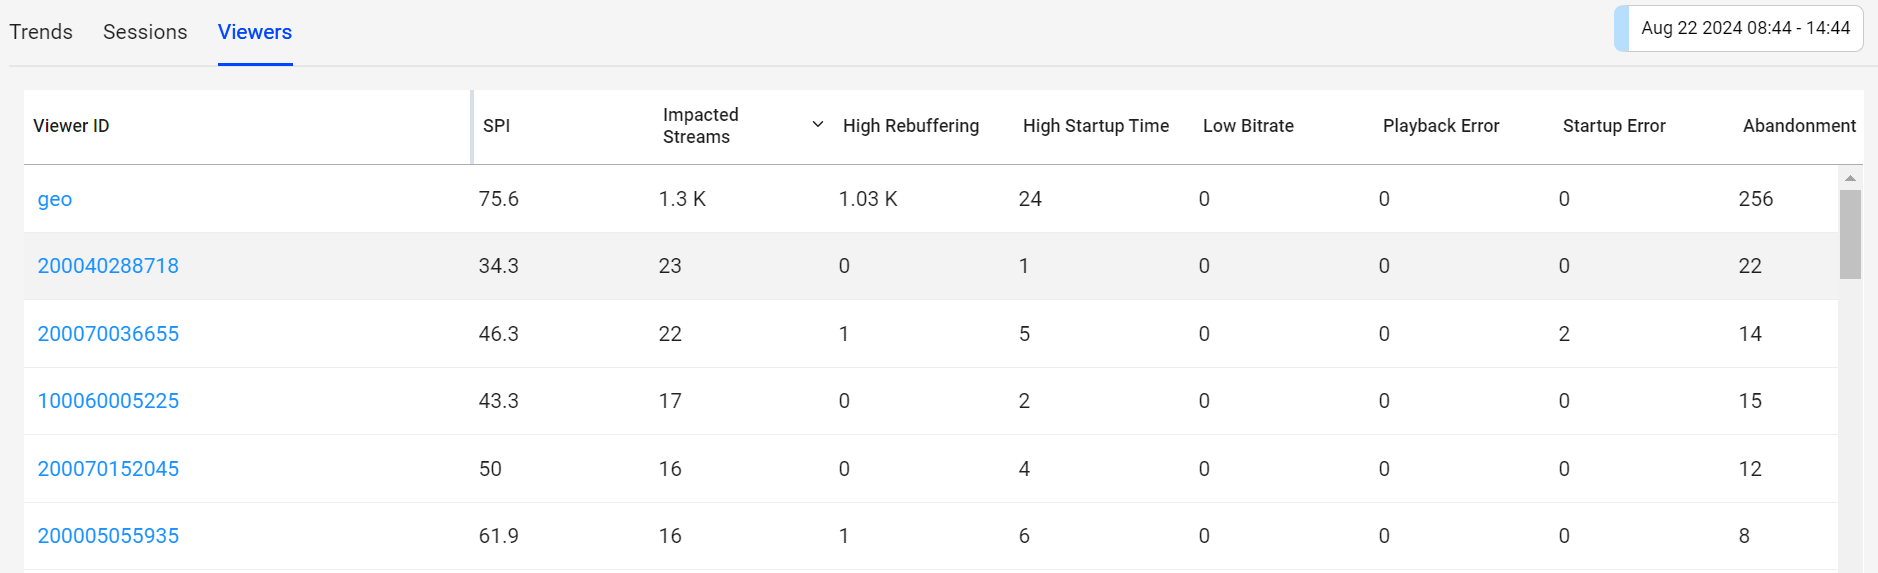
Impacted Viewers
The Impacted viewers tab provides the anomalies of the viewer session for the data as per the added metric filters.
You can export the displayed data using the export option in the action bar.
Note: c3.[accountname] is mentioned in the exported file.
Real-Time (Live Mode) in Trends
Use the updated date picker to select the live mode. The Live mode shows the time series along with the aggregated metric numbers and percentages on the metric widget aligning the aggregate values with the metric values in the dimension table.
Note: The real-time shows only the last 1 min data on the dimension metric widget and the dimension table.
The real-time live mode supports 10 second data refresh with less than 30 seconds latency, based on a 10-second tumbling window.

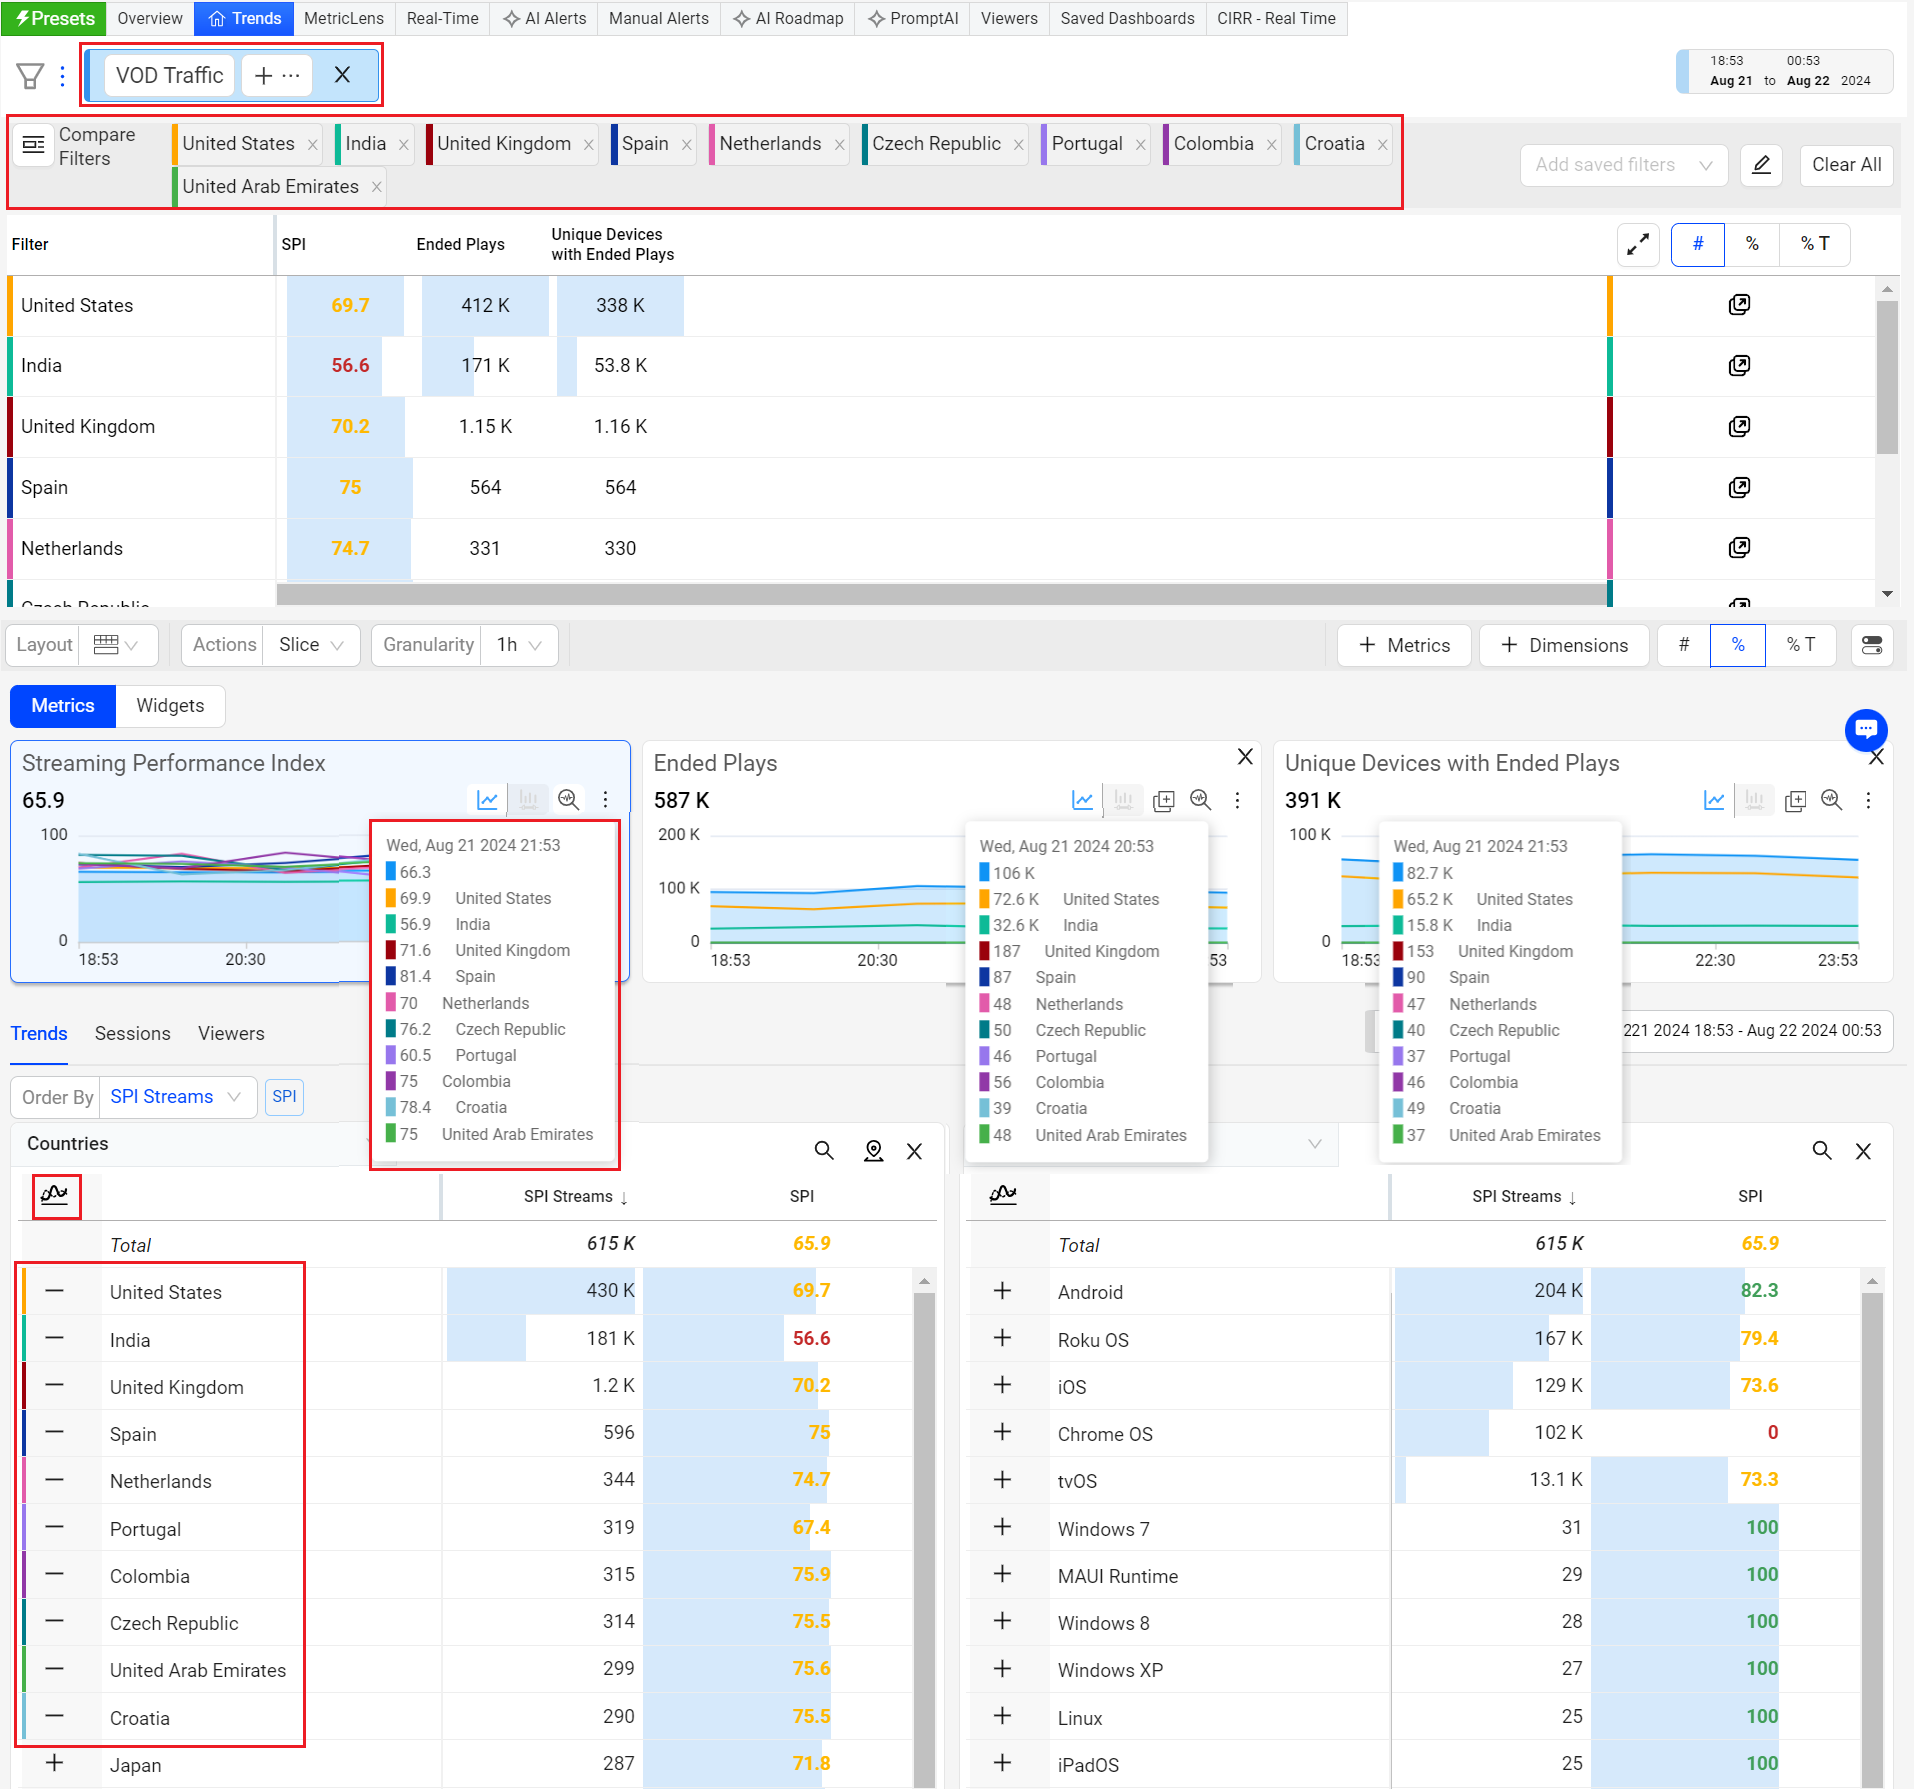
Compare
Trends offers instant comparison in addition to the Compare dashboard. Quickly compare filters for the top 10 dimension entities or across a custom dimension filters. You can now add upto 20 filters in the compare filters bar.
For more information on Compare Integrated in Trends, see Compare.
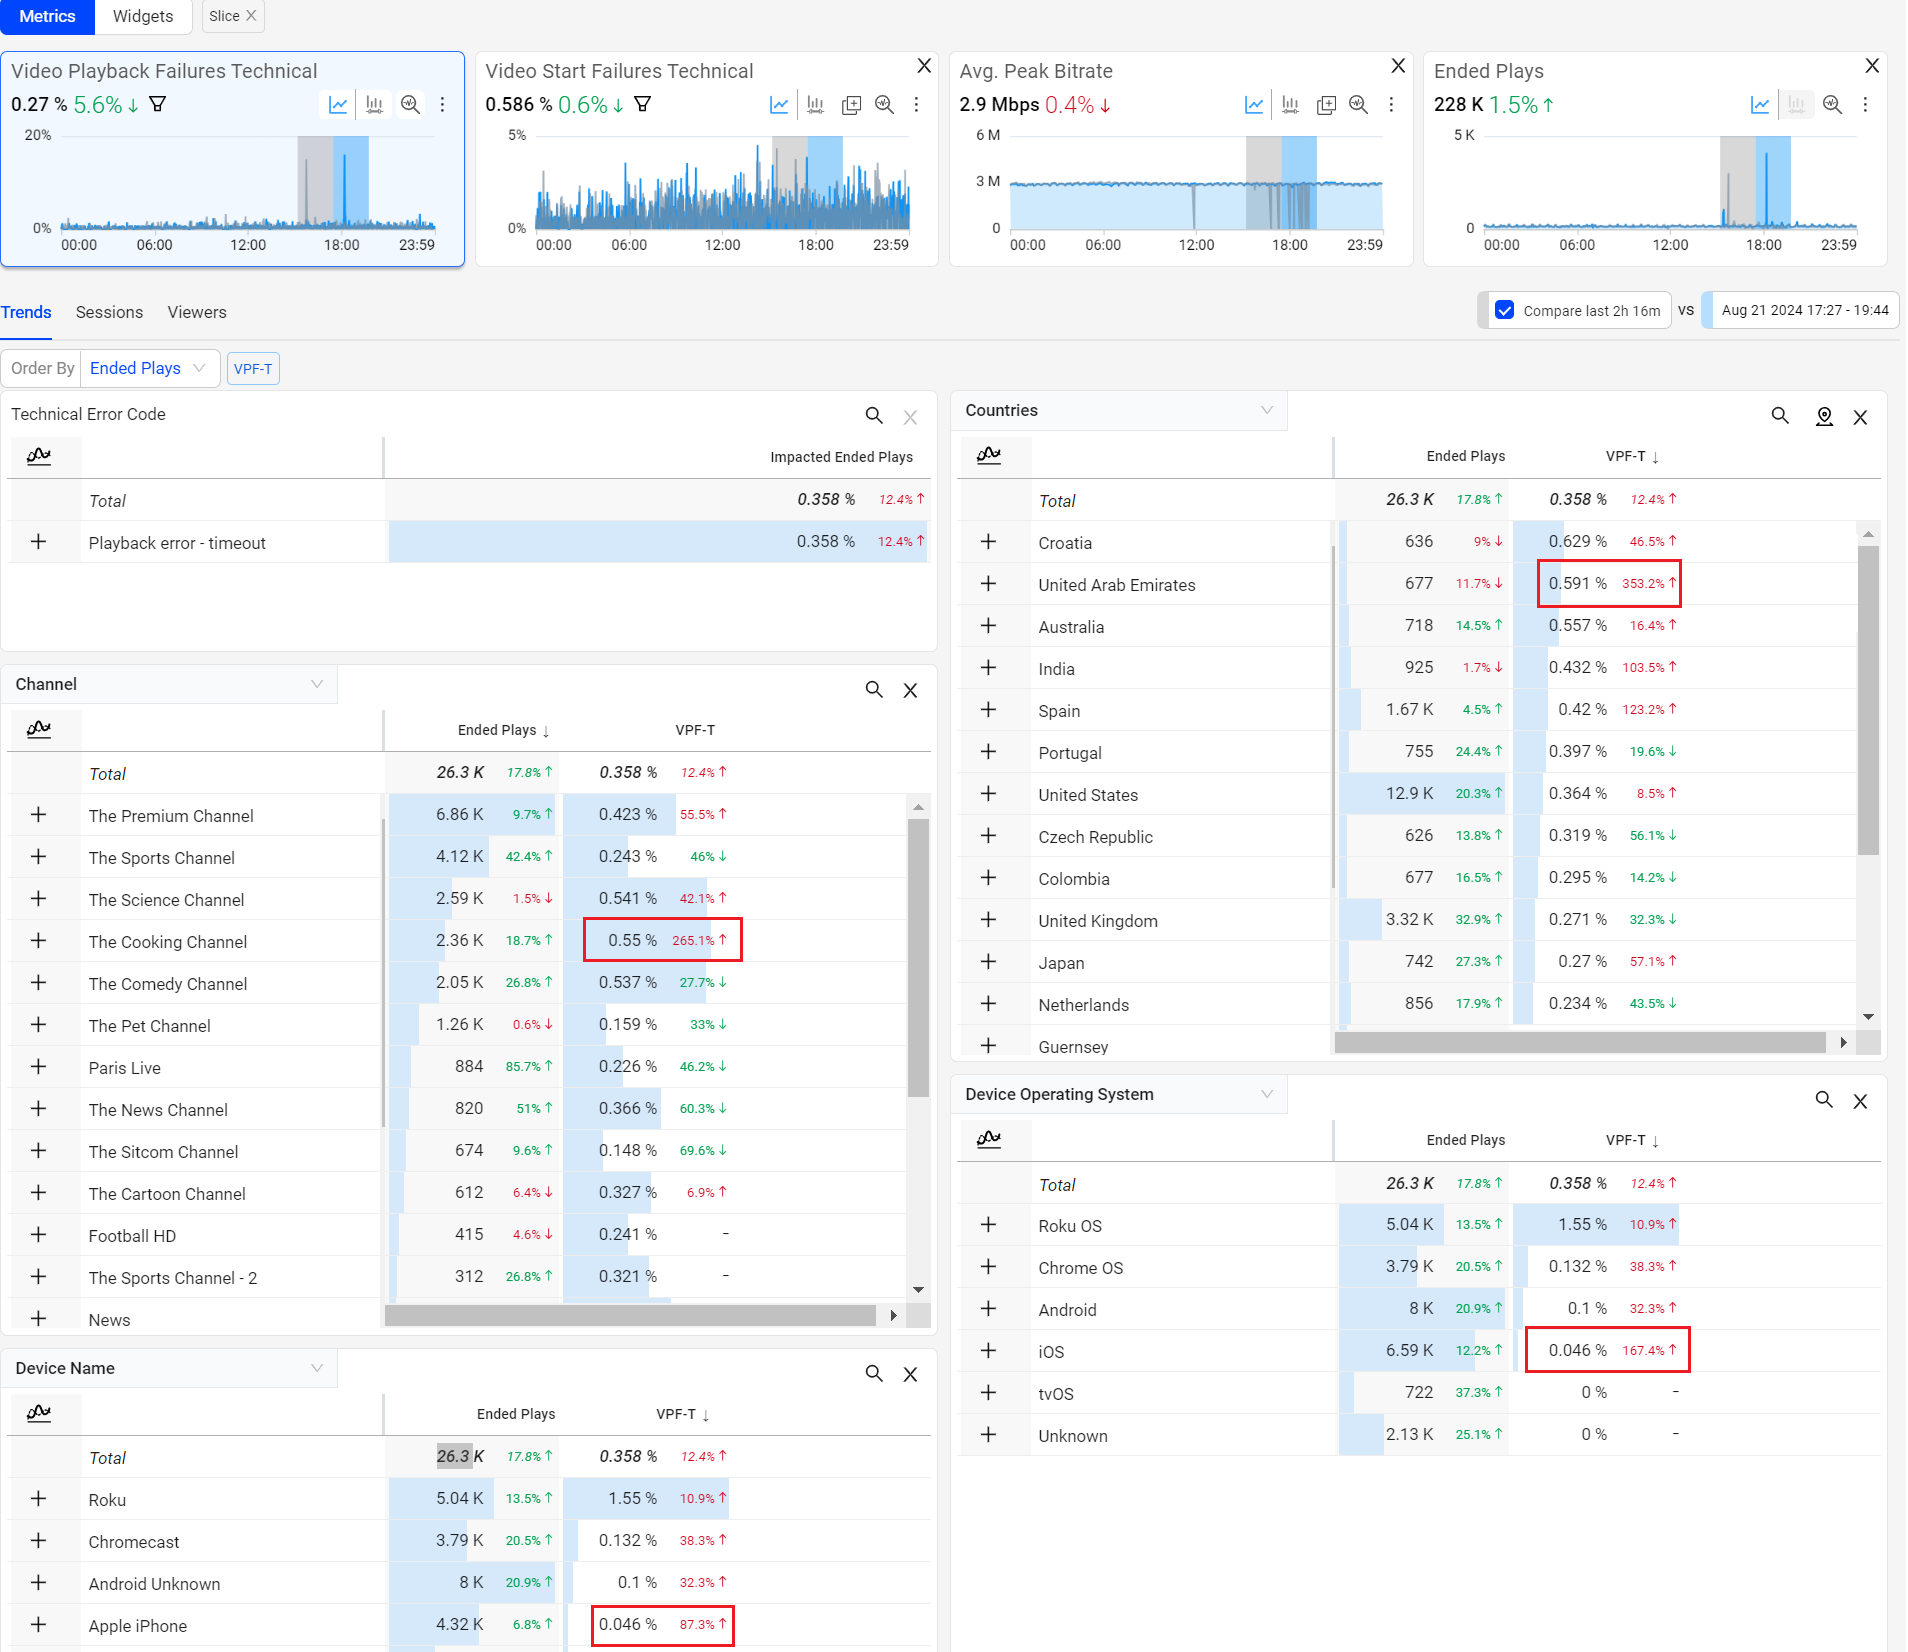
Dimension Table Compare
Dimension Table Compare displays comparitive percentage values in the dimension tables so you can directly identify which dimension values contributed most to the spike or drop (in percentage) within the table. This feature also displays the shaded comparitive area in the metric widget time series, to help clarify the scope of the impacts. Hovering over the percentage value displays the absolute value of the shaded area. With this feature, you can efficiently analyze the data, and detect any anomalies to provide a better user experience.
You can also save, share, and export the table-compare data.
This feature offers two distinct modes, Date-on-Date (DoD) Compare Mode and Slice Mode, each designed to cater to different user needs and scenarios.
Note: Turning the Date Comparison feature toggles off any secondary feature settings. The Dimension Table Compare feature is not supported for Live mode.
For more information on Dimension Table compare details, see Table Compare.
Inline Filters
Using the filter builder in Trends enables focused data analysis along with inline filter creation and updates.
-
Inline filter rule addition, modify operators, and directly apply the filter rule.
-
Save inline settings to create new filters.
-
Open filter builder for a full view of filter creation and management.
-
Open Filter Management to browse saved filters, and directly apply to Trends.
For more information, see Filter Builder.
Time Granularity
The Trends page, including Diagnostics and Compare, supports enhanced granularity levels, such as:
-
1 min, 5 min, 15 min, 30 mins and 1 day for 1-hour intervals
-
1 hour, 6 hours, 12 hours, 1 day, and 7 days for 30-day intervals
Note: When you change the time granularity in Trends, the system retains this selection even when you log out and log back in, provided the granularity is valid based on the selected time range.
The new granularity drop-down next to the time picker allows you to select the granularity level for the current display.
For more information on time granularity , see Time Granularity.
Remove Data Dip for Partial Data in the Last Time Series Data Bucket
Note: Removes the last partial data bucket by dropping any partial data in the last time series data bucket if there is a delay in data ingestion, no data availability from the source, or only partial data available in the data bucket, based on the selected granularity and the specified date and time range.
For example, the date picker sets the range from 14 July at 1:30 pm to 14 July at 4:37 pm with a granularity of 5 minutes. The last time series data bucket spans from 4:35 pm to 4:37 pm, resulting in only 2 minutes of data, which would likely cause a dip in the time series due to partial data availability. Therefore, the partial data in that data bucket, which would cause an observable drop or dip in the last data bucket in the time series, is no longer shown.
Use a wide time range for performance monitoring and user behavior analysis, from the last year to the last 2 hours or real-time. For data analysis within the last 24 hours, narrow the time range to minutes.
Diagnostics
Trends provides a rich set of diagnostic features and capabilities that support optimizing all aspects of your streaming performance from real-time break fixing to on-going continuous improvements. For more information on diagnostic use cases, see Diagnostics.
Deleting Historical Resource Data
Contact Conviva Support for resource deletion requests to remove resources from data in Trends dimension tables and other data displays.
After a resource is deleted from an account, the resource name may still appear in the related dimension tables and other data displays if any sessions with the resource were long sessions that started before the resource deletion.
Trends Secondary Filtering Horizontal View Secondary Filtering Trends Summary, Drill-downs, Drill down Viewer Sessions Impacted Viewers Advanced Metric Filtering Ad dimensions Real-Time (Live Mode) What's New Diagnostics Extend to App date compare Inline filters Dynamic Y-Axis Dynamic Y-Axis Dynamic Y-Axis Dimension List Dimension List Dimension list List Dimension List Dimension list List Dimension List Dimension list List Dimension List Dimension list List Dimension List Dimension list List Dimension List Dimension list