Note: Executive Email will be deprecated on May 8th 2025. Use the Custom Dashboard
Executive email provides key stakeholders with insights into overall streaming quality, comparative QoE performance, and engagement trends. Based on Conviva's industry-leading streaming intelligence, these customized emails provide visual summaries of KPIs and performance metrics to empower data-driven operational best practices and KPI-based decision making.
Note: Custom dashboards allow you to create personalized dashboards by combining widgets and display options to showcase metrics and dimensions in summary, table, or distribution formats.
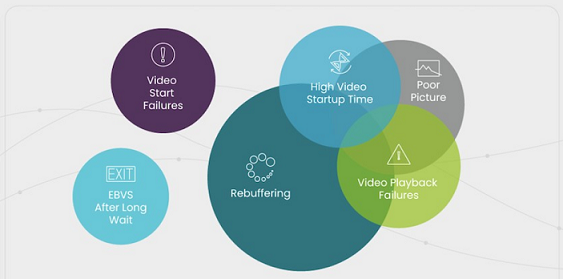
Conviva formulates a unified streaming performance KPI based on the percentage of streaming sessions with good or great viewing experience. This KPI represents the Conviva Streaming Performance Index, and is based on the percentage of streams with:
-
No errors (VSF-T or VPF-T)
-
No or very low Rebuffering (using CIRR)
-
Acceptable picture quality based on average bitrate for different screen sizes
-
Acceptable Video Start Time
-
No EBVS if the viewer was waiting a long time before exiting.
Each playback session can experience one or multiple QoE issues, for example a stream can have high rebuffering that leads to a playback failure.
When interpreting your data, keep in mind:
-
SPI Streams show the Conviva monitored streaming sessions which contributed to the SPI calculation. Sessions that exited before the video started when the viewer did not wait a significant time and sessions impacted by business logic errors are not included in the SPI streams.
-
Plays show the video sessions during which the viewer saw at least the first frame of the video.
-
Concurrent Plays show the maximum number of simultaneously active sessions during a given interval. Active sessions have at least one played video frame, and do not include unsuccessful play attempts or sessions that had ended.
Executive email notifications include:
-
Audience metrics and trends: Peak Concurrent Plays, Plays, Hours Watched, and Unique Devices (with Ended Plays)
-
Top Content for ranking of asset viewership
-
QoE benchmark based on Conviva’s OTT streaming intelligence and industry-leading video streaming coverage across publishers. This benchmark is defined as the 95th percentile (for example, 5th best publisher out of 100) and determined for each country.
-
Top Devices ranked by hours watched and SPI per device.
-
Top Countries ranked by hours watched (available when there are two or more countries with more than 1% of traffic) and SPI per country.
Conviva sends the Executive Emails weekly at 8:00 am on Monday morning with data for the previous Monday through Sunday.
Configuring Executive Emails
-
To configure executive emails, in the Settings menu select Executive Email (v2.0).
You can also use the Executive Email (v2.0) kebab option in the Overview page.

The Executive Report page appears with a list of the configured report emails.

Frequency includes:
-
Daily: Sent every morning
-
Weekly: Sent every Monday morning
-
Monthly: Sent the 5th of each month
-
-
Click the kebab icon on the right to display the menu options.

-
Click Send Sample to send out the email of the last completed week data. This does not affect the weekly email notifications.
-
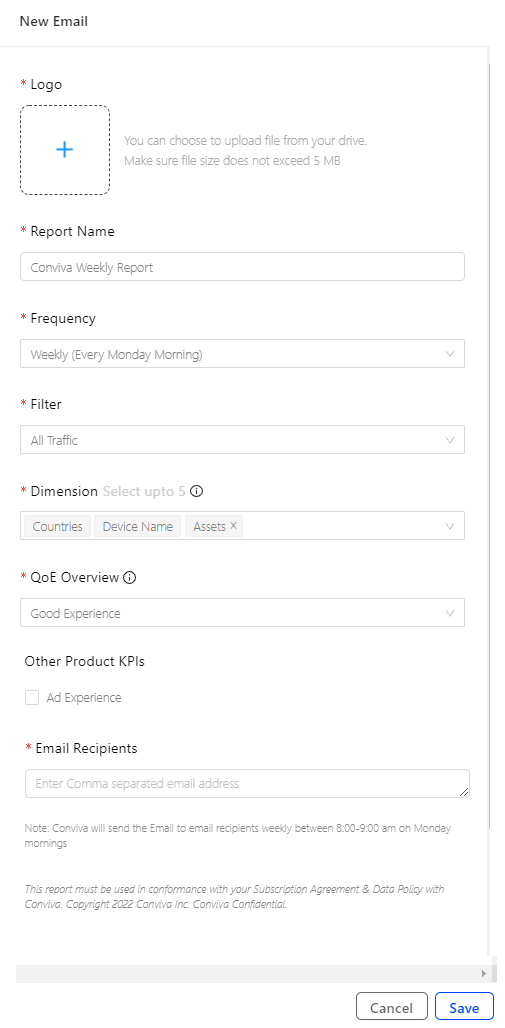
Click New Email to configure new Executive Email report notification. The New Report configuration page appears.
-
Select an image file to appear as the company logo on the email report.
-
Enter the name of the report email that will appear in the email notifications.
-
The email notification frequency as Daily, Weekly, or Monthly. The time of notification is based on your configured Pulse time zone.

Frequency includes:
-
Daily: Sent every morning
-
Weekly: Sent every Monday morning
-
Monthly: Sent the 5th of each month
-
-
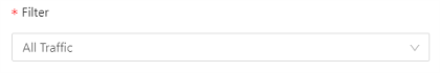
Select the Filter to apply to the data analyzed in the report. Data segmentation and filtering can be based on the configured VSI filters, such as All Traffic, Live, VOD, or mobile devices.
-
Select the desired dimensions. Up to five dimensions can be used. By default, Country and Device Name are selected and cannot be removed. The Country dimension populates only if greater than 1% of the traffic is outside one country.
-
Set the level of QoE critieria used to determine the QoE Overall rating. Conviva analyzes the video streams that meet the specified QoE level and then calculates the percentage of video streams that meet the Conviva Good or Best criteria.
Good QoE
Use this set of criteria for comparison with other OTT streams based on satisfactory stream performance:
Good QoE
-
No Errors (VSF-T or VPF-T)
-
VST-T < 10sec
-
EBVS wait time < 10sec
-
Avg. Peak Bitrate > 800Kbps for TV screens
-
Avg. Peak Bitrate > 400Kbps for desktop or tablets
-
Avg. Peak Bitrate > 200Kbps for mobile devices screens
-
CIRR < 0.4%
-
CIRT < 2sec
Best QoE
-
No Errors (VSF-T or VPF-T)
-
VST-T < 10sec
-
EBVS wait time < 8sec
-
Avg. Peak Bitrate > 2Mbps for TV screens
Note: Encoding compression are not considered in the bit rates. -
Avg. Peak Bitrate > 800Kbps for desktop or tablets
-
Avg. Peak Bitrate > 400Kbps for mobile devices screens
-
CIRR < 0.02%
-
CIRT < 1sec
-
-
Select the Ads to include ad impressions and trend data in the report.

-
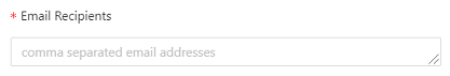
Specify the comma-separated email addresses of the recipients. Up to 10 email addresses can be entered.
Example Executive Email Notification
Engagement levels based on video metrics and week to week comparison.
For historical analysis with peak and low data points, data displays:
-
Daily 15-day trends (Beta)
-
Weekly 90-day trends
-
Monthly 180-day trends (Beta)
Example Daily Report

Note: To Unsubscribe, please update the email settings in Conviva Pulse or reach out to your Conviva Admin.
Top video assets by plays, along with the number of Concurrent Plays.

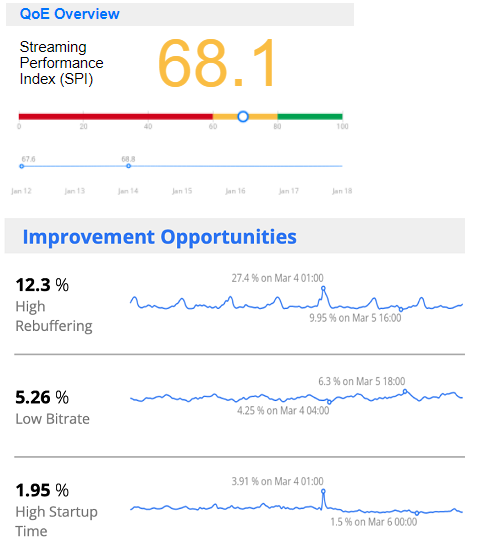
Overall QoE SPI along with the percentage breakdown of the top three QoE issues.
The Conviva SPI benchmark standardizes performance measurements across geographic regions. Benchmark is only available in the QoE Overview for All Traffic, Live and VOD if the publisher has data in only 1 Country (only 1 Country with more than 1% traffic). For example, Live video streams in North America are only benchmarked with other Live video streams in North America.

If Publisher has more than 1% traffic (by Attempts) in more than 1 Country, then the Benchmark is displayed at Country level in the Top Countries section. In this case, Benchmark is also only available for All Traffic, Live and VOD. For example, if the report is for Live traffic, in the Country UK, the benchmark is for UK and Live.

Top devices as a percentage of hours watched, along with the number of hours watched and the SPI index.

SPI Streaming Performance Index Executive Email Executive Email