When viewing diagnostics for supported metrics, VSI enables you to discover the most critical causes of viewer impacts and failure patterns across the impacted sessions. Conviva VSIprovides a high-level time series for metric progressions analysis and the ability to drill down to the minute-level analysis of the impacted viewer sessions. This enables the analysis of overall metric performance across the sessions in the current interval and, for selected time ranges of spikes and anomalies, a detailed view of up to 1,500 impacted viewer sessions in up to 24-hour intervals within the last 30 days.
In addition to time series, several metrics show data buckets with interval metrics. You can calculate the interval metrics for each displayed 1-minute data bucket. Each data bucket shows the collection of viewer sessions for that selected metric range within the displayed 1-minute intervals.
| Metrics with Viewer Session Drill-down | Filtered By | Viewer Session Analysis |
|---|---|---|
| Average Peak Bitrate | Dimensions |
Time Series: Average Peak Bitrate and Play Duration Data Buckets: Concurrent Plays by Interval Average Peak Bitrate |
| Average % Complete | Dimensions |
Time Series: Average % Complete and Ended Plays Data Buckets: Ended Plays by Interval Average % Complete |
| Avg. Average Bitrate | Dimensions |
Time Series: Avg. Average Bitrate and Ended Plays Data Buckets: Ended Plays by Interval Avg. Average Bitrate |
| Average Frame Rate | Dimensions |
Time Series: Average Frame Rate and Plays Data Buckets: Concurrent Plays by Interval Average Frame Rate |
| Bitrate Switches | Dimensions |
Time Series: Bitrate Switches and Ended Plays Data Buckets: Concurrent Plays by Interval Bitrate Switches |
| Connection Induced Rebuffering Ratio | Dimensions |
Time Series: Connection Induced Rebuffering Ratio and Plays Data Buckets: Concurrent Plays by Interval Rebuffering Time |
| Connection Induced Interrupted Plays | Dimensions |
Time Series: Connection Induced Interrupted Plays and Ended Plays Data Buckets: Connection Induced Interrupted Plays by Interval Play Duration |
| CIR Related Exits | Dimensions |
Time Series: CIR Related Exits and Ended Plays Data Buckets: CIR Time preceding Exit by Interval CIR Related Exits |
| Dropped Frames Ratio | Dimensions |
Time Series: Dropped Frames Ratio and Ended Plays Data Buckets: Ended Plays by Interval Dropped Frames Ratio |
| Playing Time (Ended) | Dimensions |
Time Series: Playing Time (Ended) and Ended Plays Data Buckets: Ended Plays by Interval Playing Time (Ended) |
| Paused Time | Dimensions |
Time Series: Paused Time and Ended Plays Data Buckets: Ended Plays by Interval Pause Time |
| Paused Ratio | Dimensions |
Time Series: Paused Ratio and Ended Plays Data Buckets: Ended Plays by Interval Pause Ratio |
| Exits Before Video Start | Dimensions | Time Series: EBVS and Attempts |
| Exit During Pre-Roll | Dimensions |
Time Series: EDPR and Attempts Data Buckets: Ad Plays by Interval EDPR |
| Starting Bitrate | Dimensions |
Time Series: Starting Bit rate and Ended Plays Data Buckets: Ended Plays by Interval Starting Bitrate |
| Rebuffering Ratio | Dimensions |
Time Series: Rebuffering Ratio and Concurrent Plays Data Buckets: Concurrent Plays by Interval Rebuffering Time |
|
Video Playback Failures Video Playback Failures Technical Video Playback Failures Business |
Dimensions and Error Codes |
Time Series: Video Playback Failures and Ended Plays Data Buckets: Total Ended Plays vs Impacted Ended Plays |
|
Video Start Failures Video Start Failures Business Video Start Failures Technical |
Dimensions and Error Codes |
Time Series: VSF and Attempts Data Buckets: Total Attempts vs Impacted Attempts |
| Video Start Time | Dimensions |
Time Series: VST and Plays Data Buckets: VST vs Plays |
| Video Restart Time | Dimensions |
Time Series: Video Restart Time and Ended Plays Data Buckets: Video Restart Time vs Ended Plays |
Displaying Impacted Viewer Sessions
To display and analyze viewer sessions impacted by filter dimensions and error codes (when available):
-
Select Viewer Sessions tab.
-
Using the Date/Time picker or dragging in the time series, select a time period for up to 24 hours. To drill into viewer experience issues, use the time series to select a time period with data spikes or anomalies.
-
Switch to distribution mode and drag to select the data buckets to create a secondary filter.
-
Click on the Session ID to Viewer Session details.
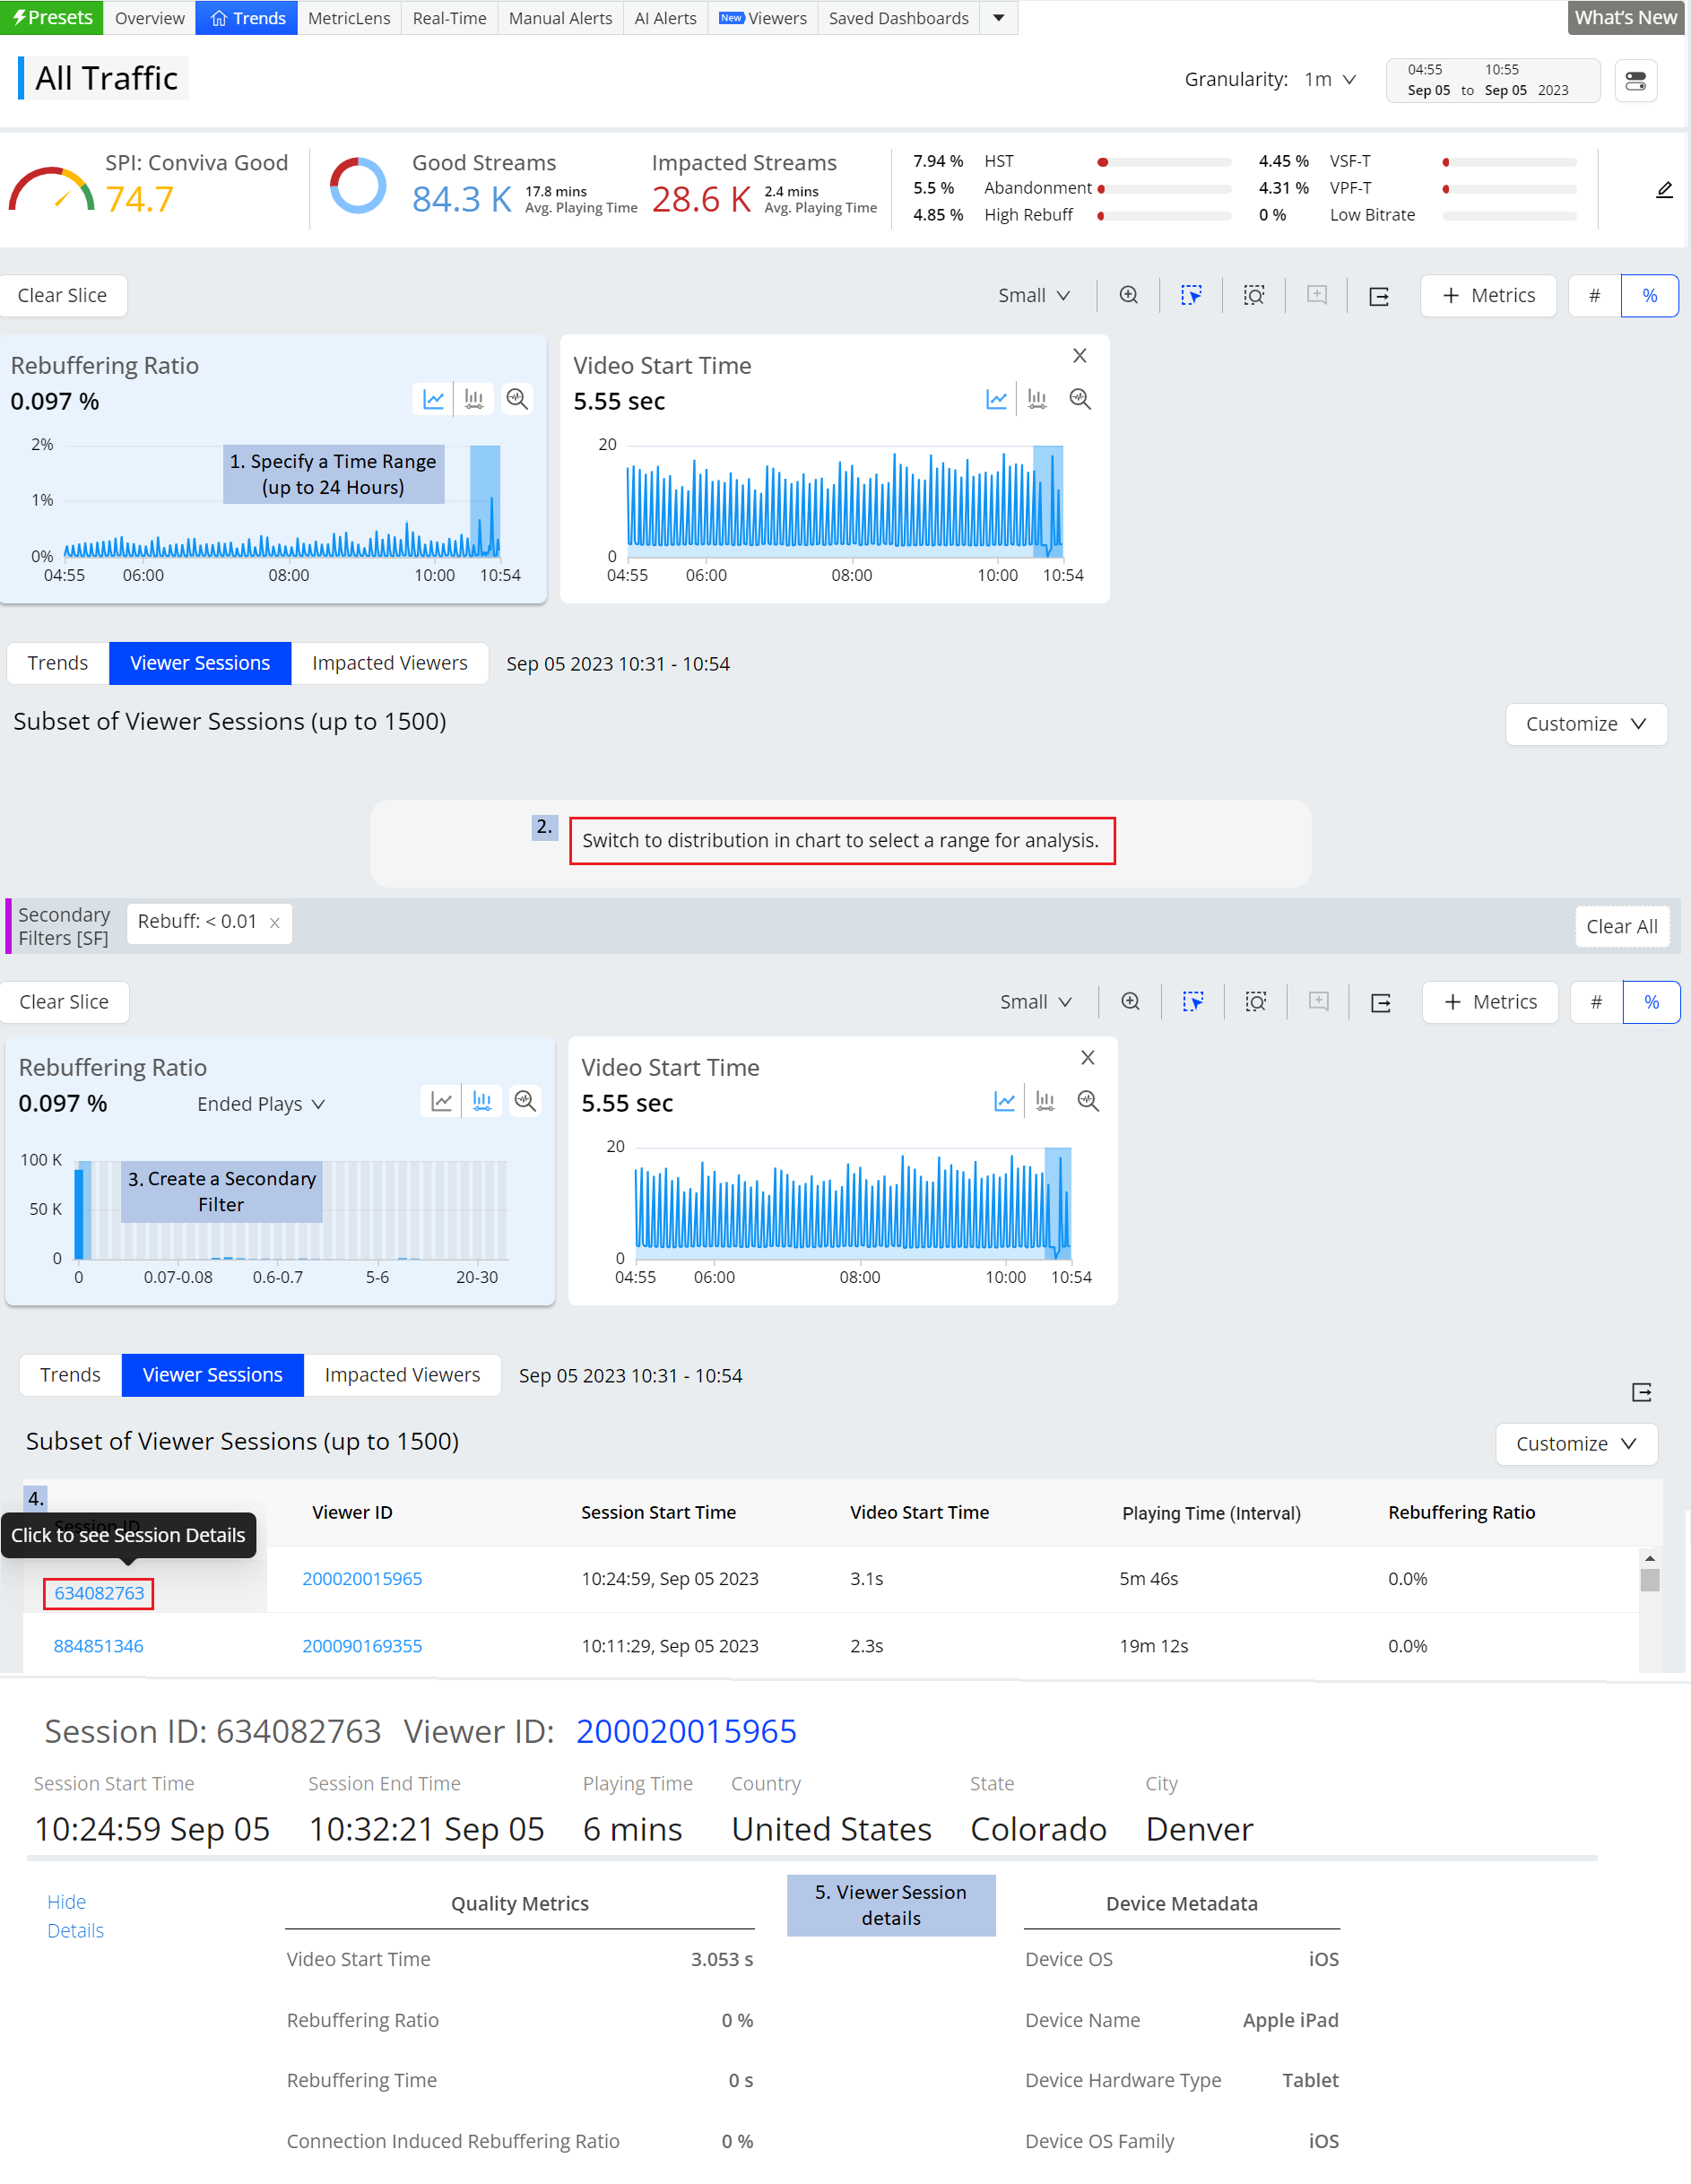
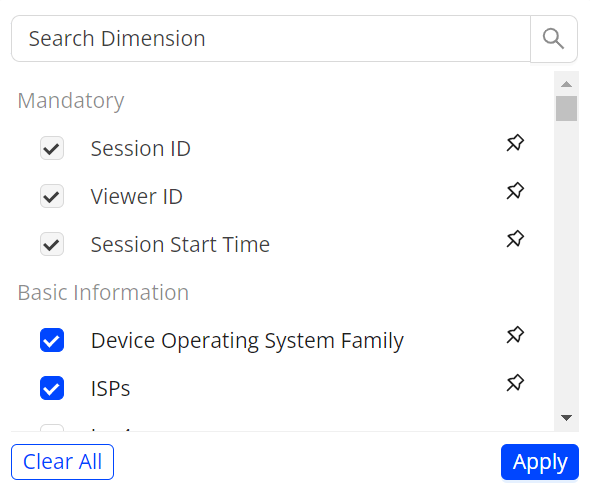
Click Customize to toggle the display of data columns and sort sessions, for example sessions with EBVS or Playing Time greater than 1 minute.
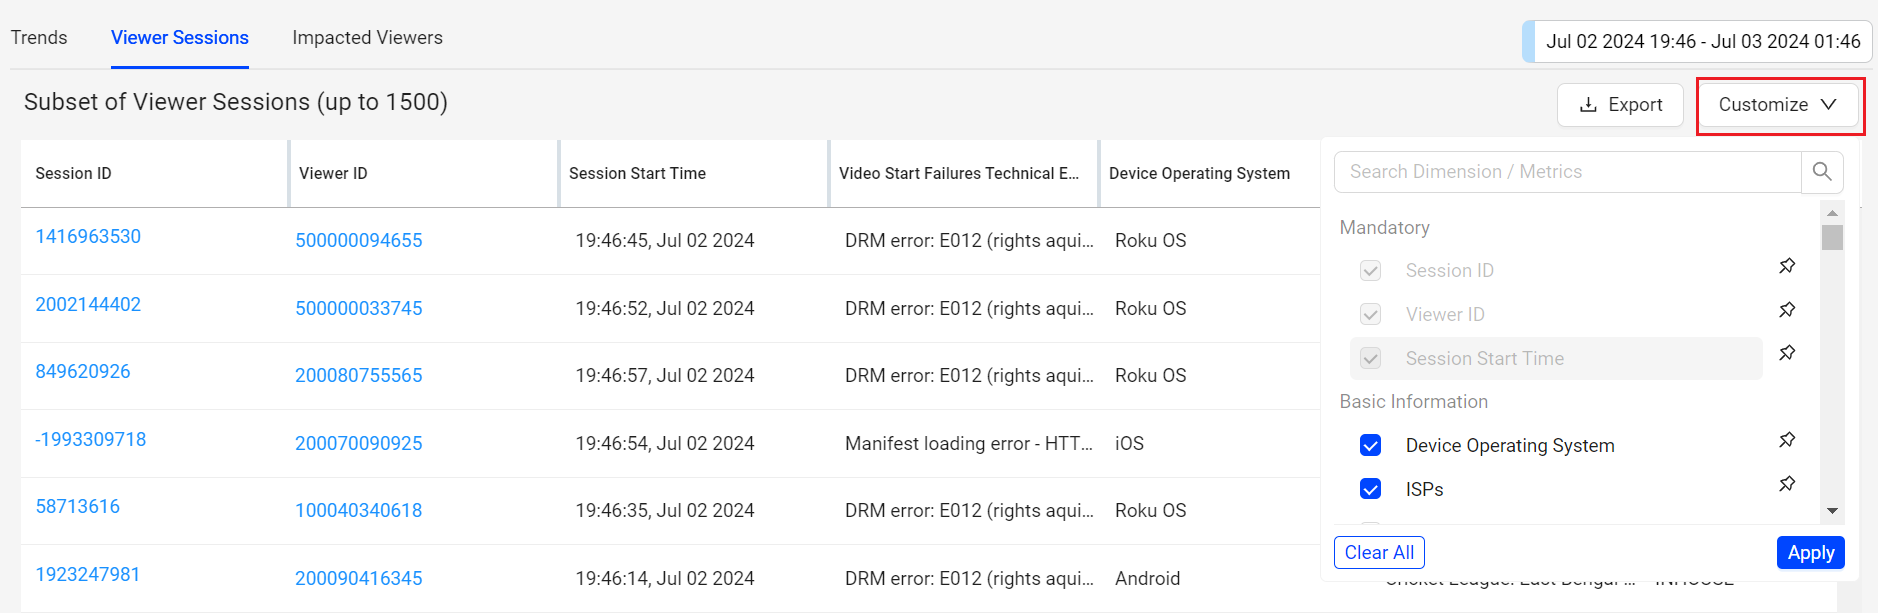
Click a column heading to sort the impacted viewer sessions by that data, for example Device Operating System Family, ISP, or IP Address to analyze how impacts and performance patterns were distributed across video delivery chain.
Click a viewer ID to open the Viewer Module page for that viewer for additional viewer activity analysis.
Impacted Viewer Session Fields
| Category | Viewer Session Data | Explanation |
|---|---|---|
| ViewerID | The viewer ID or session identification passed to Conviva from the player through the `c3.viewer_id` metadata tag. Session IDs in Conviva Connect and Pulse applications are signed, random integers. | |
|
Basic Info |
Session Start Time | The time when Conviva received the first heartbeat for the session. The format is Unix epoch time in seconds. |
| Device Operating System | The device operating system used in this session | |
| ISPs | Internet Service Provider name. | |
| IPv4 (Hash) | An IP hash is an encrypted version of an IP address, transforming it into a unique string of characters, making it harder to trace back to the original address. This hash transformation uses a one-way hashing algorithm, meaning the IP address cannot be easily reversed once hashed. The hashed IP can be used for various analyses or comparisons. In Viewer Sessions and other locations within Pulse where IP addresses are displayed, IPv6 and IPv4 addresses have been hashed at the customer's request. To enable IP Address Hashing functionality in your account settings, contact Conviva Customer Support. | |
| IPv6 (Hash) | ||
| AS Numbers | Autonomous System Number for the ISP. | |
| Assets | The name of the asset that was viewed during this session. | |
| Channel Name | The name of the channel over which content was viewed during this session. | |
| Content Length | The time in seconds that the view session played. | |
| Startup Metrics | Video Startup Time | The VST from the session start to the current minute of the failure. For more details, see Video Startup Time in the Metric Dictionary. |
| Exits Before Video Start | The EVBS from the session start to the current minute of the failure. For more details, see Exits Before Video Start in the Metric Dictionary. | |
| Video Start Failures Error Code | The list of VSF error codes that caused the video start to fail. | |
| Video Playback Failures Error Code | The list of VPF errors (including custom errors) that caused the playback to fail. | |
| Lifetime Playback Metrics | Playing Time (Interval) | The amount of time the player actively displayed video content during the session interval. This does not include rebuffering time. |
| Average % Complete | The average percent of video watched from the session start to the current minute of the failure. | |
| Rebuffering Ratio | The Rebuffering Ratio from the session start to the current minute of the failure. For more details, see Rebuffering Ratio in the Metric Dictionary. | |
| Connection Induced Rebuffering Ratio | The Connection Induced Rebuffering Ratio from the session start to the current minute of the failure. For more details, see Connection Induced Rebuffering Ratio in the Metric Dictionary. | |
| Average Peak Bitrate | The Average Peak Bitrate from the session start to the current minute of the failure. For more details, see Average Peak Bitrate in the Metric Dictionary. | |
| Average Frame Rate | The Average Frame Rate from the session start to the current minute of the failure. For more details, see Average Frame Rate in the Metric Dictionary. | |
| Interval Playback Metrics | CDN | The CDN used at the time the video start or playback failure occurred. |
| Rebuffering Ratio | The Rebuffering Ratio for the minute interval. For more details, see Rebuffering Ratio in the Metric Dictionary. | |
| Average Peak Bitrate | The Average Peak Bitrate for the minute interval. For more details, see Average Peak Bitrate in the Metric Dictionary. |
Note: The playing time displayed on viewer sessions is for the specific minute selected, indicating the duration for which the content was played from the beginning of the session up to that minute. However, it is important to note that the total playing time of the content may exceed the displayed playing time, as the session may continue playing beyond the selected minute.
Example Viewer Sessions with Data Buckets
In addition to the time series with metric progressions, several metrics also display data buckets to help you analyze how a dependent metric value, such as Concurrent Plays, was impacted by QoE performance, such as rebuffering time.
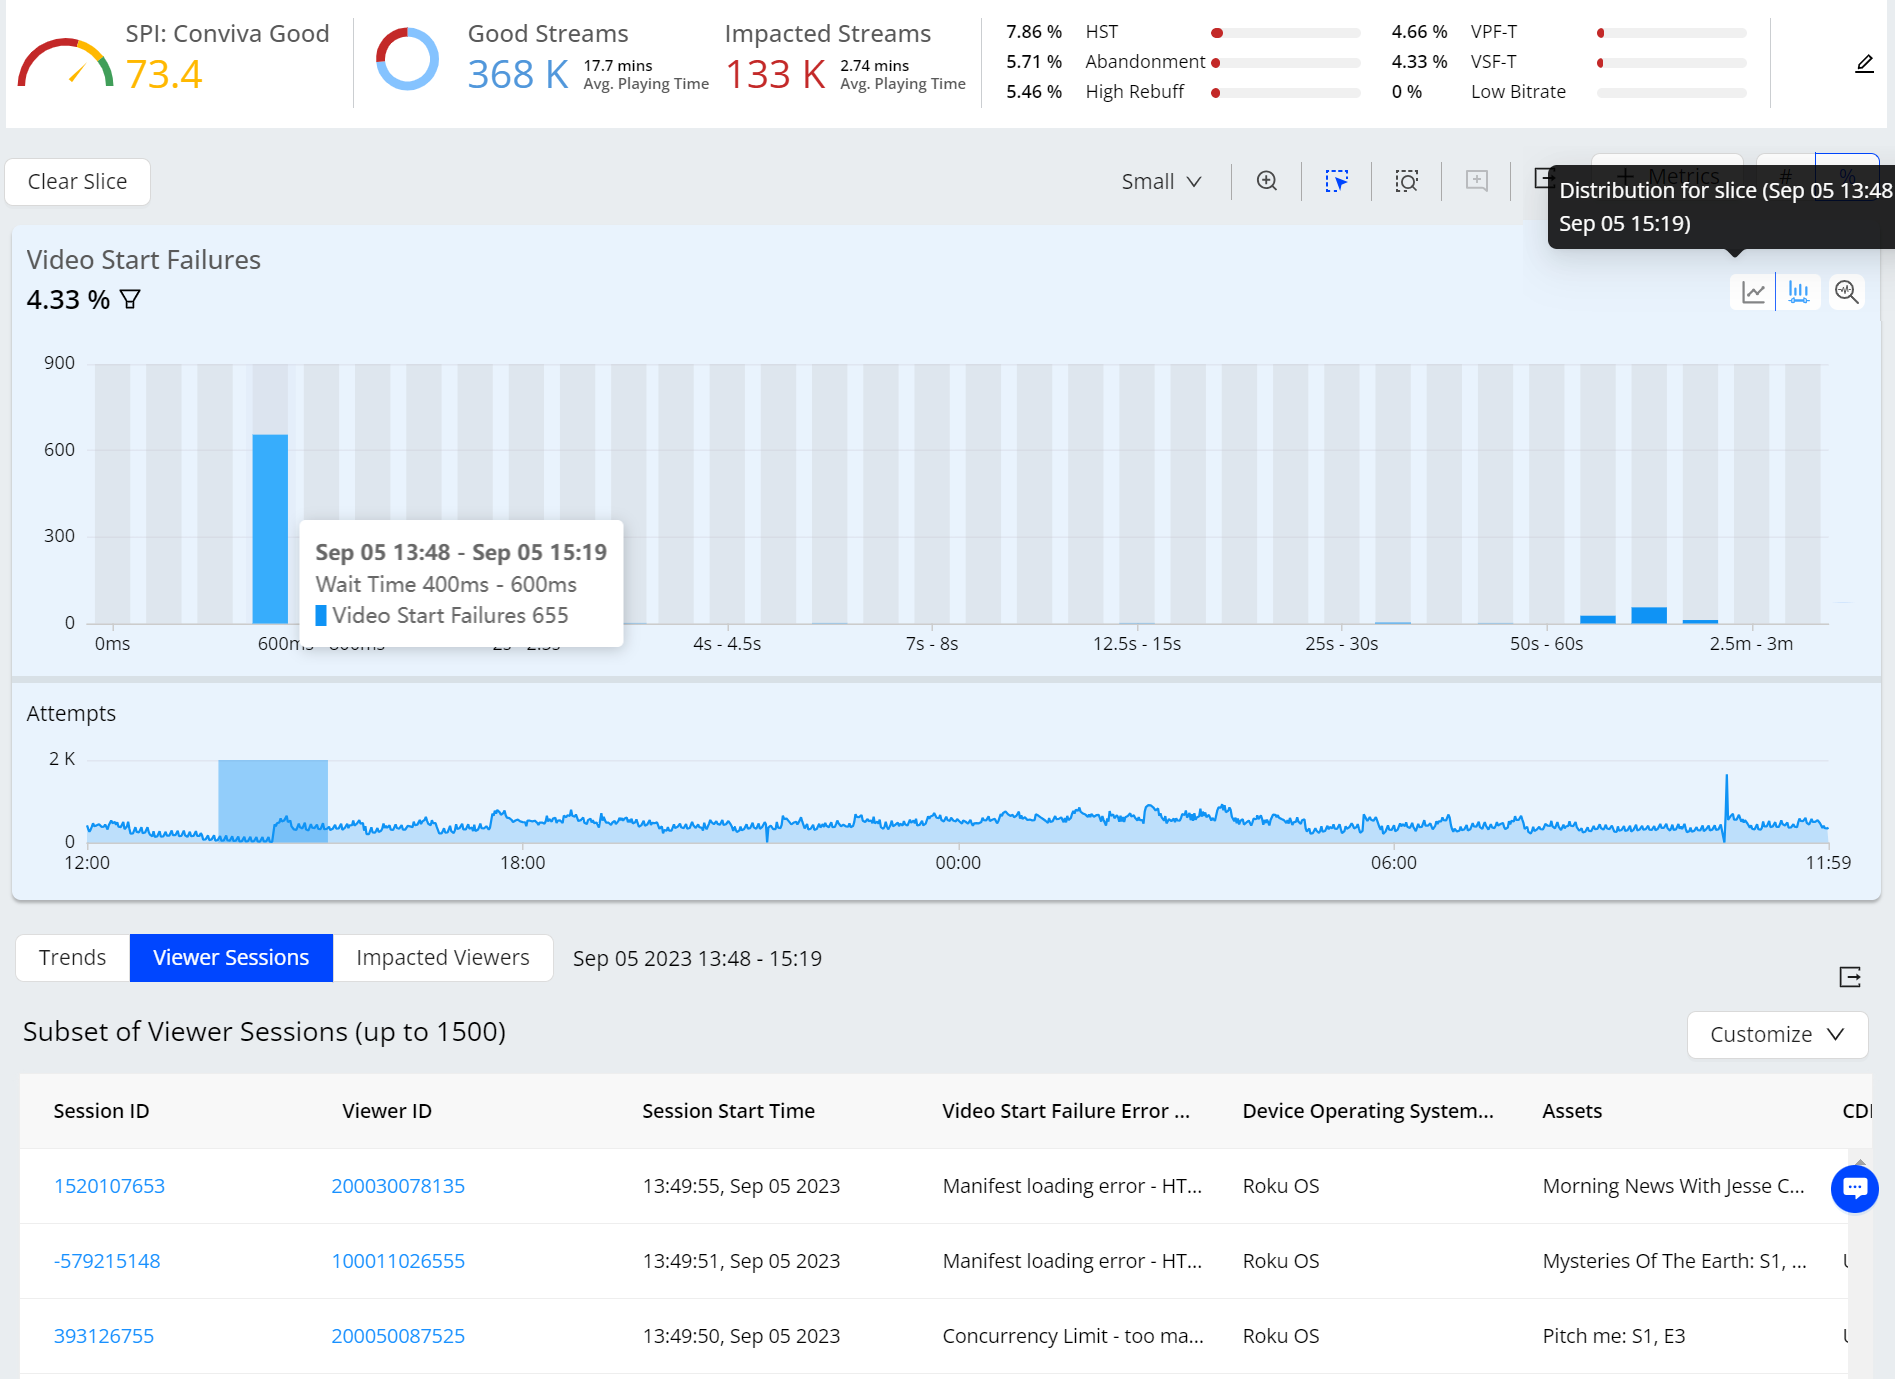
- Video Start Failures (VSF, VSF-B, VSF-T)
The Trends view of sessions impacted by Video Start Failures displays the time series for VSFs and Attempts, and data bars show the number of plays based on the selected VSF interval .
-
Select Viewer Sessions button.
-
Select a time range up to three hours.
Select a data spike or anomaly in the time series to narrow the list of 1,500 impacted viewer sessions to only that those viewer sessions impacted by the anomaly.
The list of impacted viewer sessions appears along with the time series for the secondary metric - Attempts.
You can also select a data spike or anomaly in the time series to help determine which interval contains the most impacted sessions, and apply secondary filter for additional data inspection. Selecting a Session ID displays the Viewer Timeline details, while selecting the Viewer ID displays the Viewer Module details.
Click a Viewer ID to see the Viewer module page.
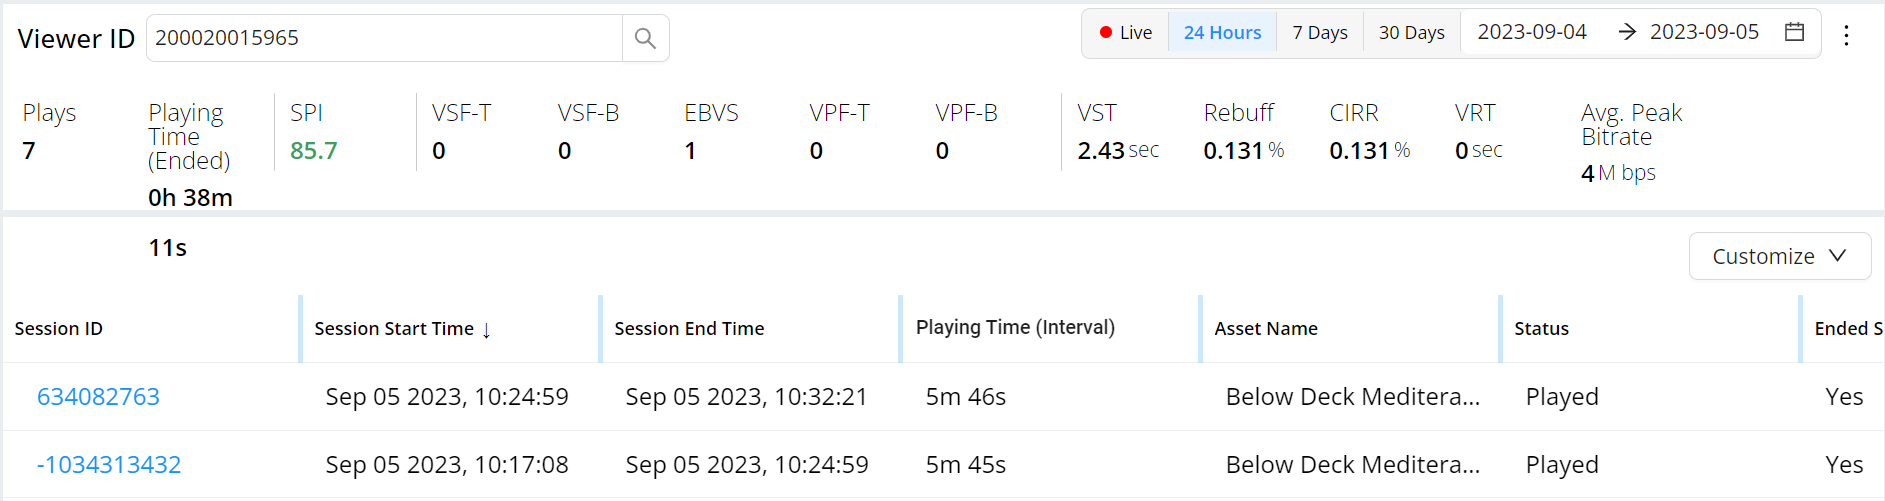
All the viewer session details based on the selected ID is displayed. The Customize drop-down provides the additional metadata options available for configured dimensions.
-
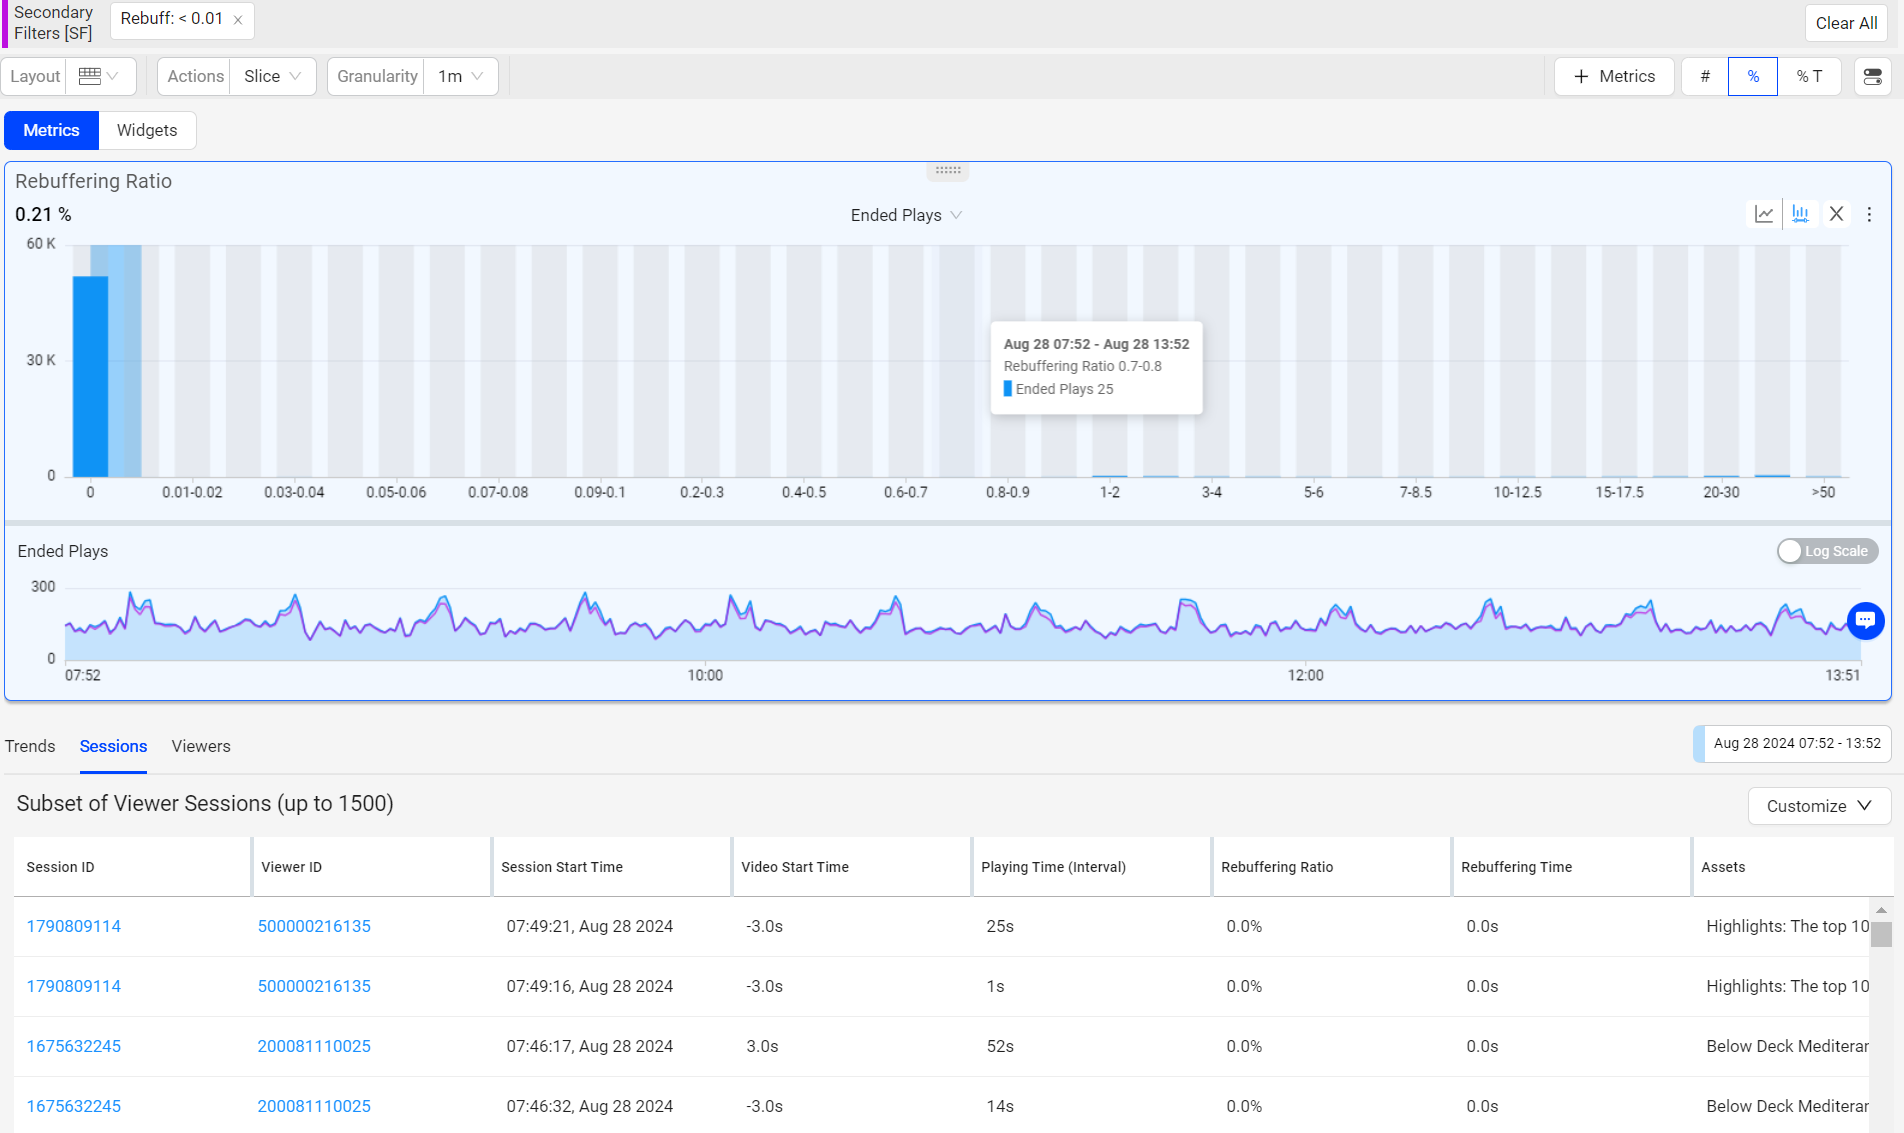
Rebuffering Ratio
The Trends view of sessions impacted by Rebuffering Ration, displays the time series for Rebuffering Ratio and Ended Plays, and data bars show number of ended plays based on the selected rebuffering time interval .
-
Select Viewer Sessions button.
-
Select a time range up to three hours.
-
Go to distribution mode and add a secondary filter by dragging on the buckets.
Select a data spike or anomaly in the time series and create a secondary filter to narrow the list of 1,500 impacted viewer sessions to only that those viewer sessions impacted by the anomaly.
The list of impacted viewer sessions appears along with the time series for Ended Plays.
Note: The 0 rebuffering impact filter is available to display the viewer sessions not impacted by rebuffering.
You can also select a data spike or anomaly in the time series to help determine which interval contains the most impacted sessions, and apply secondary filter for additional data inspection. For example, recurring spikes in rebuffering often occur at play boundaries and may indicate issues with transitions between video assets.
Selecting a Session ID displays the Viewer Timeline details, while selecting the Viewer ID displays the Viewer Module details.
-
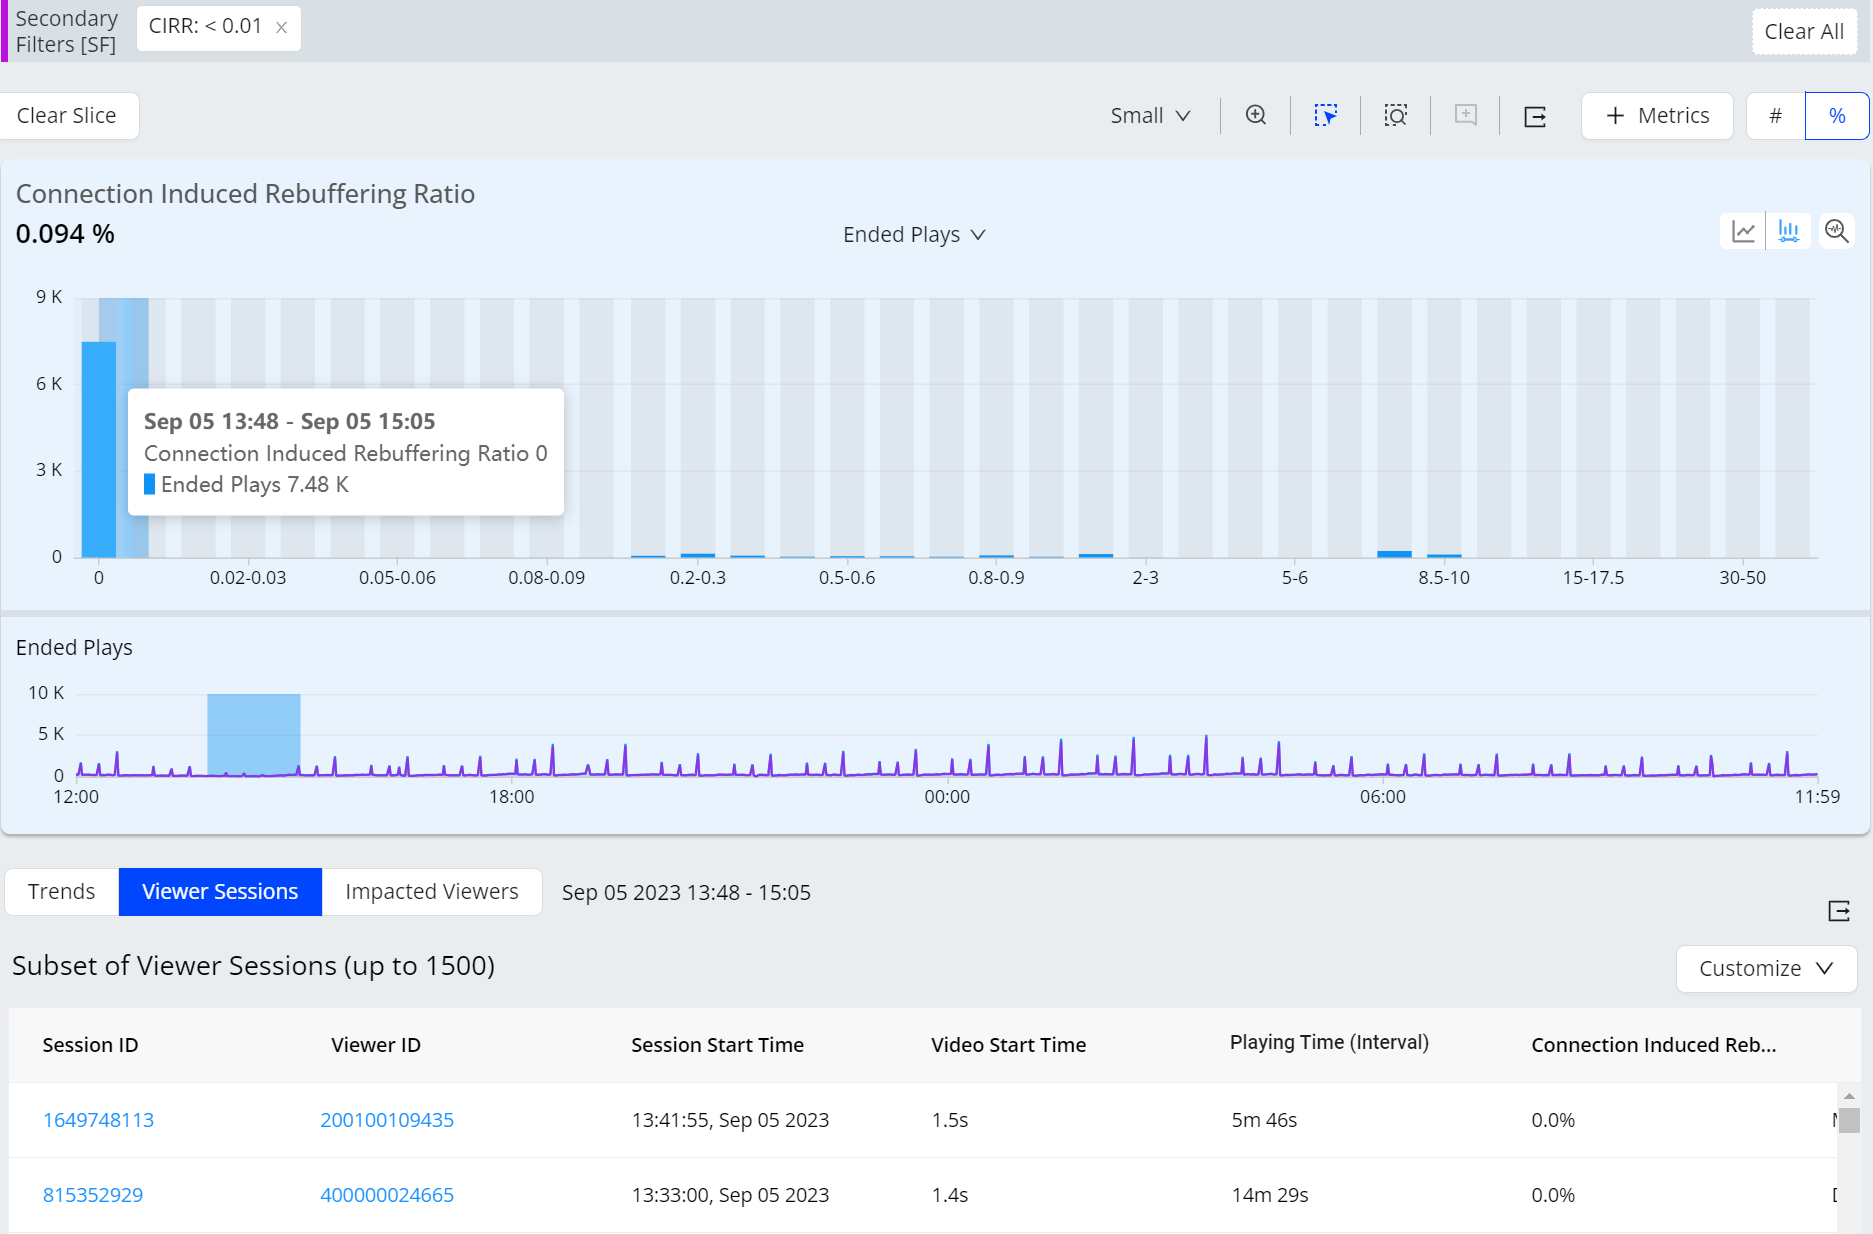
Connection Induced Rebuffering Ratio
The Trends view of sessions impacted by Connection Induced Rebuffering Ratio, displays the time series for CIRR and Ended Plays, and data bars show the number of ended plays based on the selected CIRR interval.
-
Select Viewer Sessions button.
-
Select a time range up to three hours.
-
Go to distribution mode and add a secondary filter by dragging on the buckets.
Select a data spike or anomaly in the time series and create a secondary filter to narrow the list of 1,500 impacted viewer sessions to only that those viewer sessions impacted by the anomaly.
You can also select a data spike or anomaly in the time series to help determine which interval contains the most impacted sessions, and apply secondary filter for additional data inspection. For example, recurring spikes in rebuffering often occur at play boundaries and may indicate issues with transitions between video assets.
Selecting a Session ID displays the Viewer Timeline details, while selecting the Viewer ID displays the Viewer Module details.
-
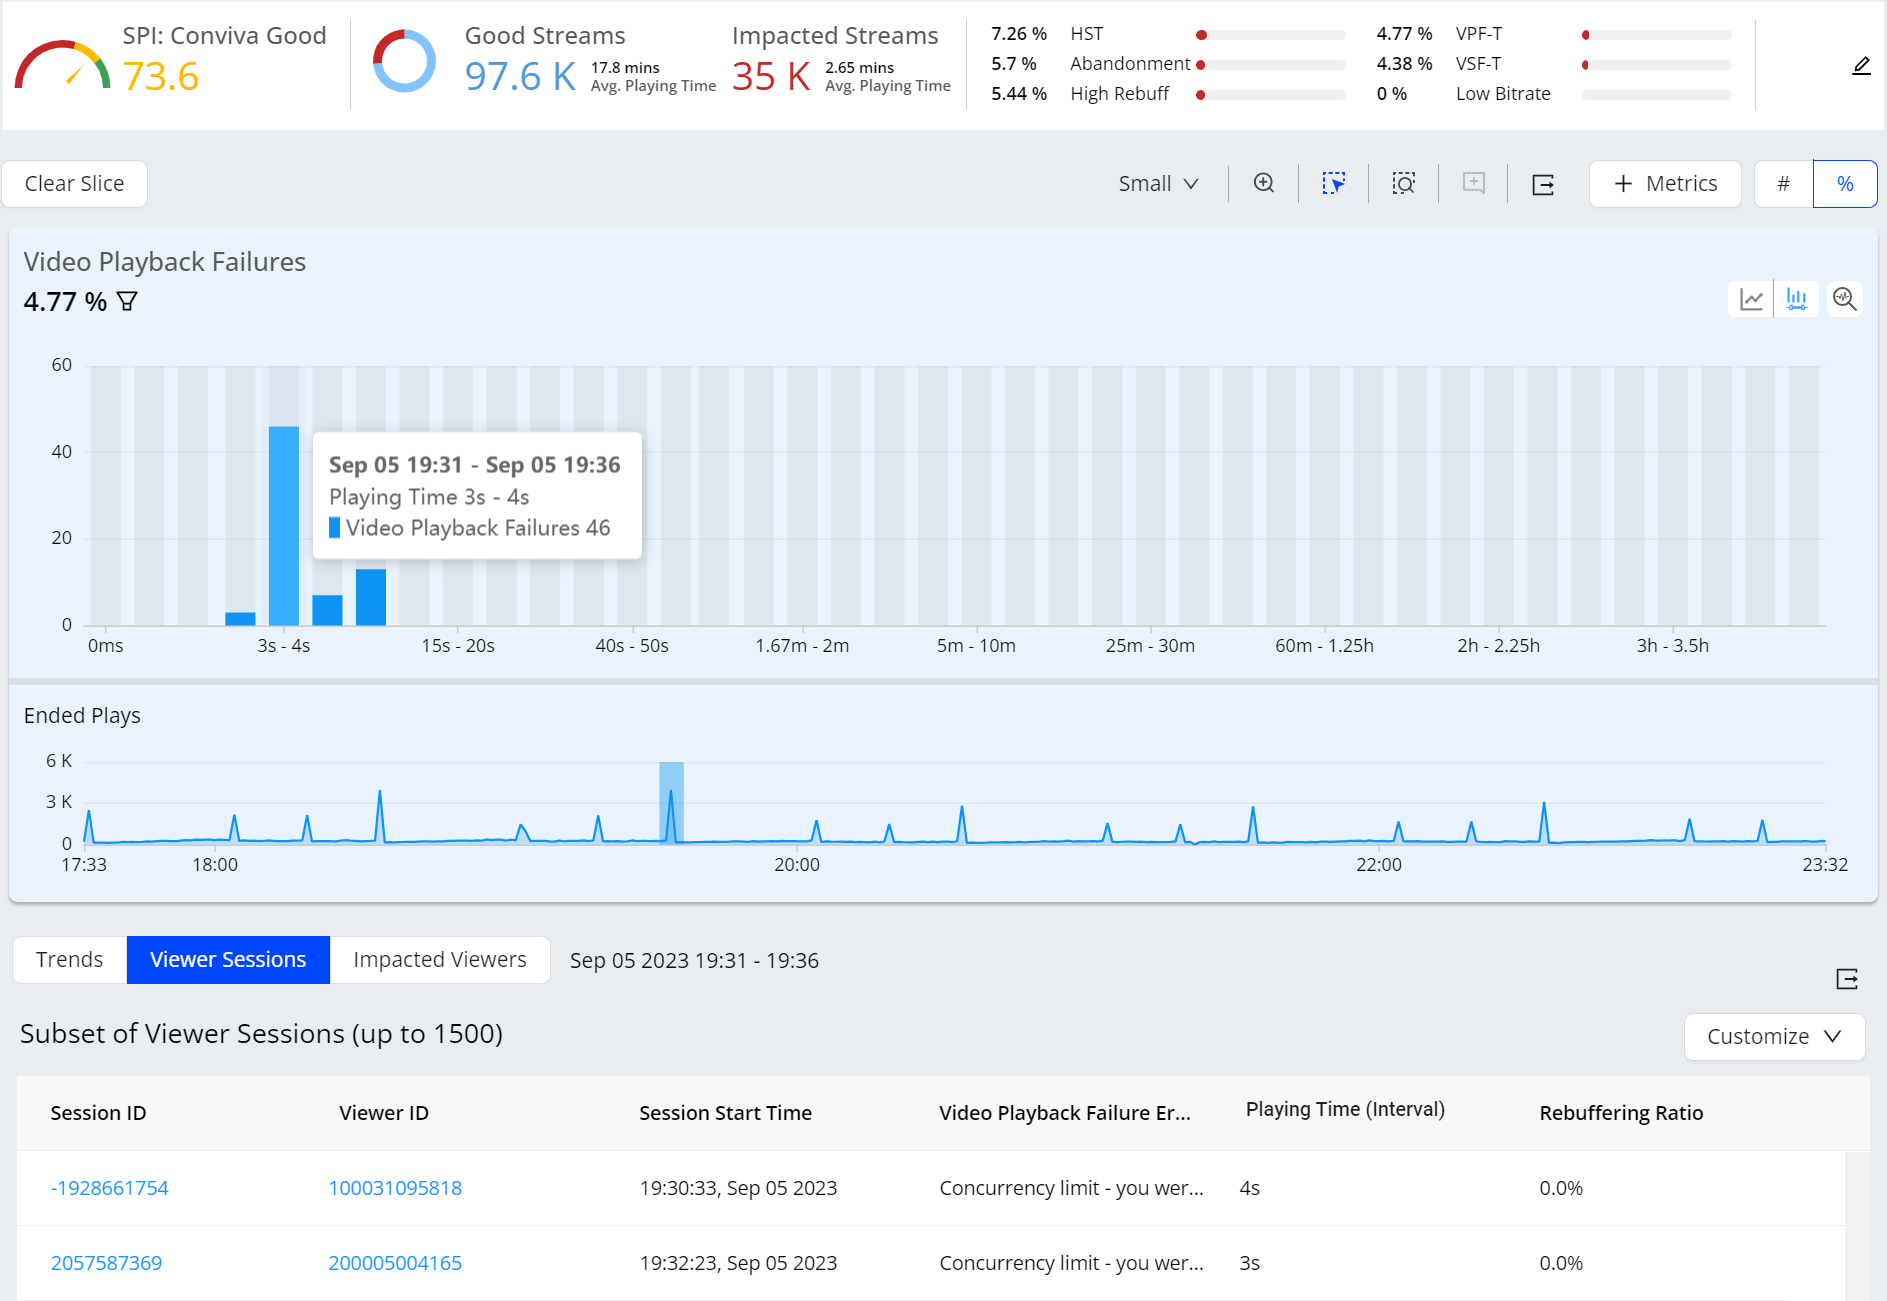
Video Playback Failures (VPF, VPF-B, VPF-T)
The Trends view of sessions impacted by Video Playback Failures displays the time series for VPFs and Ended Plays, and data bars show the number of ended plays based on the selected playing time interval .
-
Select Viewer Sessions button.
-
Select a time range up to three hours.
Select a data spike or anomaly in the time series to narrow the list of 1,500 impacted viewer sessions to only that those viewer sessions impacted by the anomaly.
The list of impacted viewer sessions appears along with the time series for the secondary metric - Ended Plays.
Click a viewer session to analyze that viewer's sessions in the Viewer Module.
-
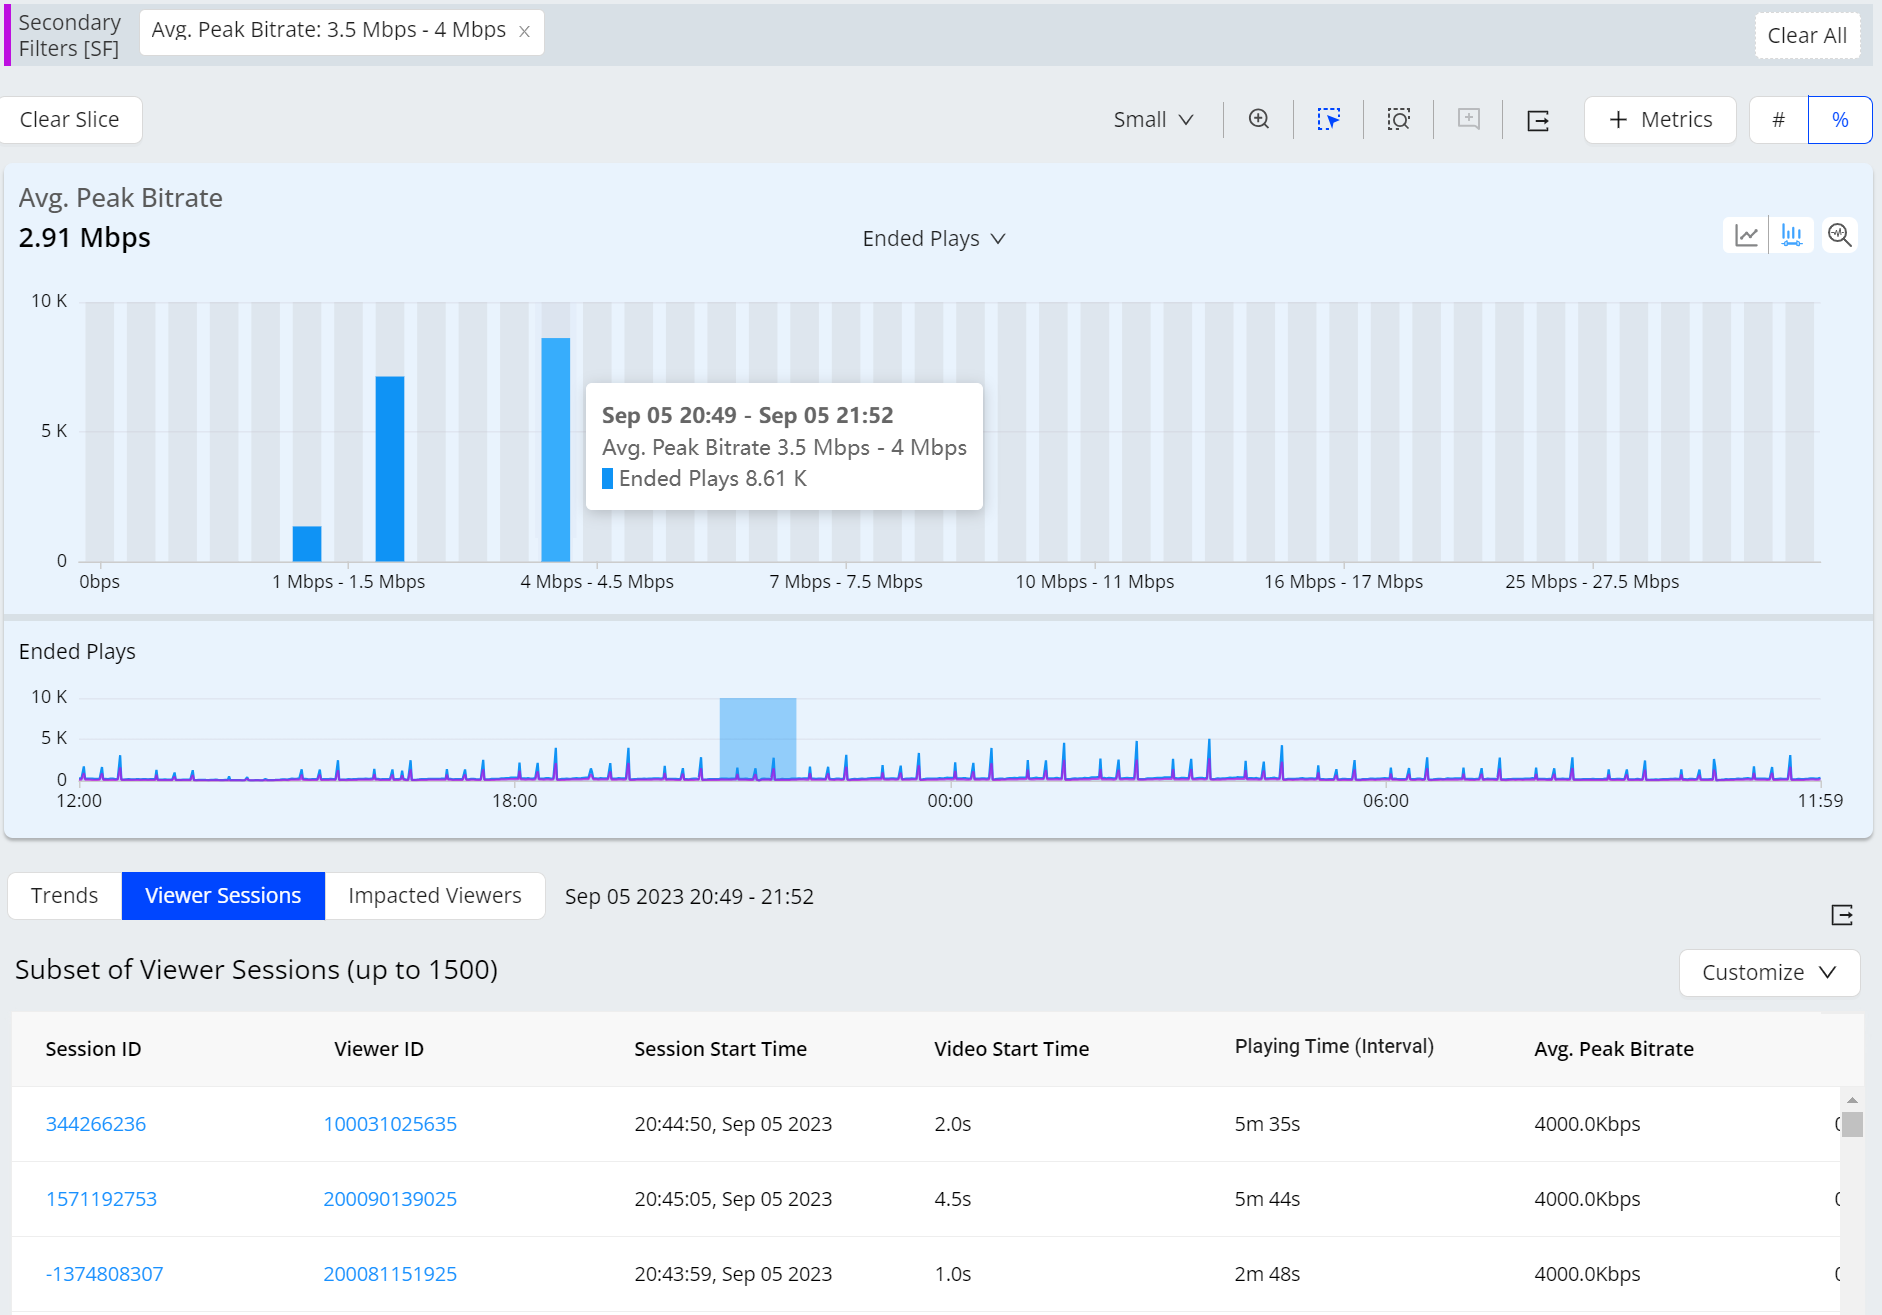
Average Peak Bitrate
The Trends view of sessions impacted by Average Peak Bitrate, displays the time series for Average Peak Bitrate and Ended Plays, and data bars show number of ended plays based on the selected average peak bitrate interval .
-
Select Viewer Sessions button.
-
Select a time range up to three hours.
-
Go to distribution mode and add a secondary filter by dragging on the buckets.
Select a data spike or anomaly in the time series and create a secondary filter to narrow the list of 1,500 impacted viewer sessions to only that those viewer sessions impacted by the anomaly.
You can also select a data spike or anomaly in the time series to help determine which interval contains the most impacted sessions, and apply secondary filter for additional data inspection. For example, recurring spikes in rebuffering often occur at play boundaries and may indicate issues with transitions between video assets.
Selecting a Session ID displays the Viewer Timeline details, while selecting the Viewer ID displays the Viewer Module details.
-
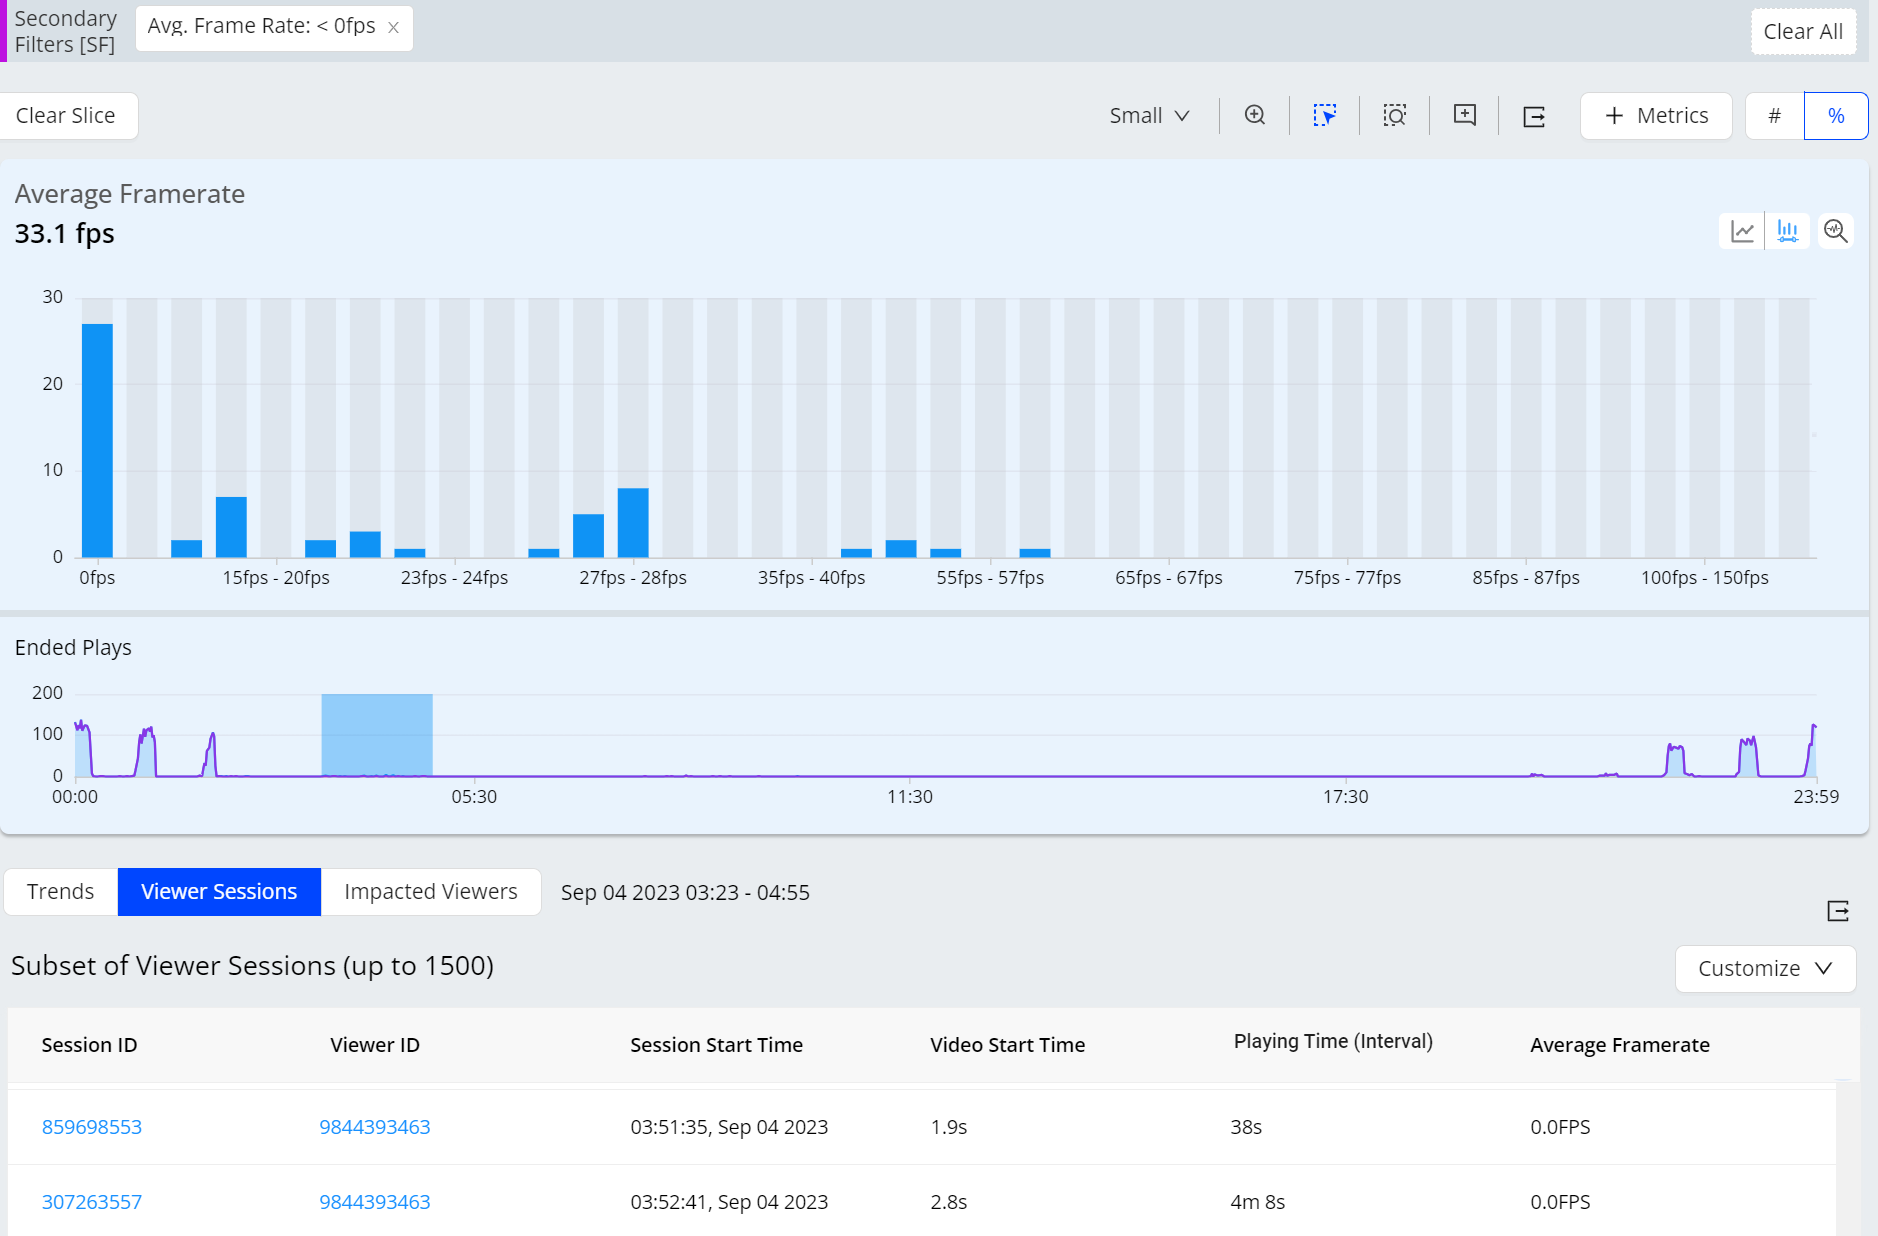
Average Frame Rate
The Trends view of sessions impacted by Average Frame Rate, displays the time series for Average Frame Rate and Ended Plays, and data bars show number of ended plays based on the interval average frame rate.
-
Select Viewer Sessions button.
-
Select a time range up to three hours.
-
Go to distribution mode and add a secondary filter by dragging on the buckets.
Select a data spike or anomaly in the time series and create a secondary filter to narrow the list of 1,500 impacted viewer sessions to only that those viewer sessions impacted by the anomaly.
You can also select a data spike or anomaly in the time series to help determine which interval contains the most impacted sessions, and apply secondary filter for additional data inspection. For example, recurring spikes in rebuffering often occur at play boundaries and may indicate issues with transitions between video assets.
Selecting a Session ID displays the Viewer Timeline details, while selecting the Viewer ID displays the Viewer Module details.
Diagnostics
Viewer Sessions feature enables you to do the second-level timeline diagnostics by analyzing the overall metric performance across sessions, and the selected spikes along with the anomalies. For more information on Session Timeline Diagnostics.
Viewer sessions Viewer sessions Viewer sessions