Conviva's DPI (Digital Product Insights) provides real-time, cohort-level insights and advanced features, connecting customer experience, engagement, and system behavior with business outcomes. DPI is powered by Conviva's high-scale, real-time, Digital Intelligence Platform that enables continuous tracking and measurement across dimensions, one-click and combinatorial instant filtering with unified insights into critical user flows and shared KPIs.
DPI performance data with real-time, real-user experience monitoring connects app front-end experiences with backend network service performance to provide Service Level Objective (SLO) values, such as engagement metrics, QoE measurements, and KPI metrics, service performance metrics, and error messages, along with Service Level Indicators (SLIs) for actual user journey success and failure rates. User timelines record user interactions for detailed activity summaries and a deep understanding of how application performance and network service health impacted user experience.
DPI monitors actual user experiences by continuously tracking specific, critical micro-journeys—called Flows. DPI flows represent critical steps in real-user journeys that enable continuous monitoring of experience and journey progress in real-time, measuring critical user journey durations, success rates, and completions. DPI continuously measures the detailed activities within each Flow and generates AI-based alerts on progress and completion issues to optimize user digital experiences.
For a summary of DPI capabilities, see Conviva DPI Overview.
DPI Workflow
|
|
|
|
|
|
|
Low code integration |
Visualize and map |
Drill-Downs and |
AI Alerts and auto |
Historical trends and |
DPI Common Tasks
| Getting Started | |||
| Perform Quick Analysis | |||
|
Activate Events/ Build Metrics |
|||
| Set Up Notifications | Setting Webhooks | ||
|
Perform Custom Data Analysis |
Common Tasks by Role
 System Admin
 (invite and manage users, create filters, setup notifications)
-
Invite and manage users
-
Manage filter settings
-
Managing notifications
-
Coordination SSO and other security settings with Conviva
Admin Task Details
| Admin Tasks | Description |
|---|---|
Invite and Setup Users
Access Pulse: Settings > User Management |
Empower the Admin to invite and manage users to engage with Conviva DPI. Oversee user accounts, permissions, and invitations, facilitating seamless interaction within DPI. For more details, see Account Setup and User Management. |
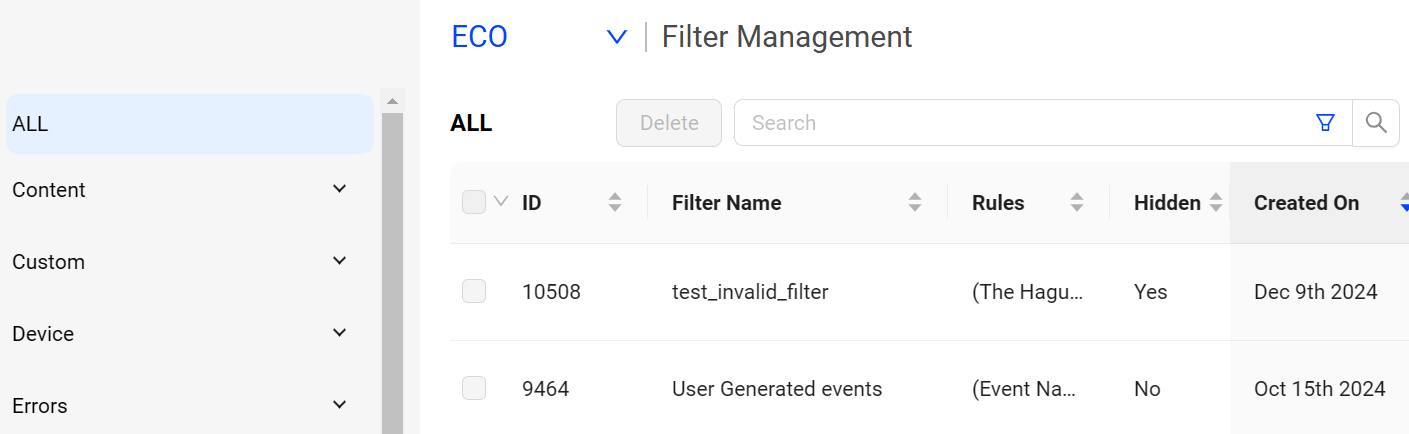
Create Custom Filters
Access Pulse: Settings > Filter Management |
Leverage the power of your data through customizable dimensions and metadata filters. The pre-defined All Traffic filter shows all traffic originating from your players. Create custom filters to focus data on your specific business requirements, including advanced filter logic options for contains, equals to, and not equal to. For more details, see Filter Management. |
Enable Notification Channels
Access Pulse:
|
Configure programmatic notifications for AI alerts using webhooks and PagerDuty. For more details, see Setting Webhook Notifications and Conviva PagerDuty Integration Guide for DPI. |

 Optimizing Customers Experiences/Product Teams
 (real-time engagement and performance, user flow metrics, historical analysis)
-
Gain a complete, real-time view of engagement, experience, and performance
-
Compute experience metrics for critical user flows
-
Seamlessly blend real-time and historical analytics
-
Discover how feature changes impact customers
| Product Manager Tasks | Description |
|---|---|
|
Get Started With Presets Dashboards
Access Pulse: Presets |
Check pre-defined dashboards as quick starting points to have access to commonly used metrics and metadata use cases from these aspects:
For more details, see Presets. |
|
Analyze Metrics and Dimension Data
Access Pulse: Trends |
Gain a complete view of customer engagement, experience, and performance in real time with the functions:
For more details, see Trends and Summary Tab. |
|
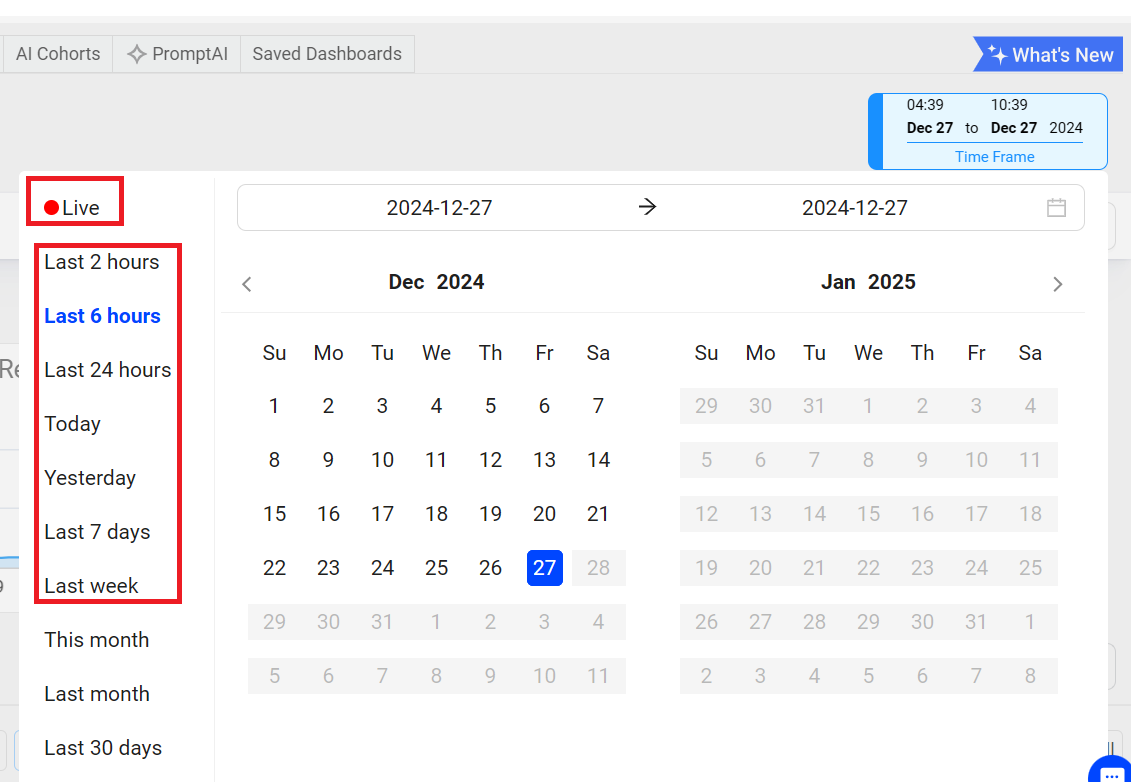
Analyze Data in Live Mode or Over a Specific Time Range
Access Pulse: Trends |
Conduct real-time and historical customer engagement analytics in a single pane of glass by selecting the Live mode or a specific time range. For more details, see Trends. |
|
Build Custom Metrics and Dimensions for Advanced Analysis
Access Pulse: Activation |
With the activation tools, set up event mappings to build customized metrics and add new dimensions to efficiently transform application events into advanced data insights. For example, map new registration events and create the Full Registration Time metric based on the registration start and completion events to gain visibility into existing registration bottlenecks and identify network requests for processing improvements. For more details, see Semantic Mapper and Metric Builder. |
|
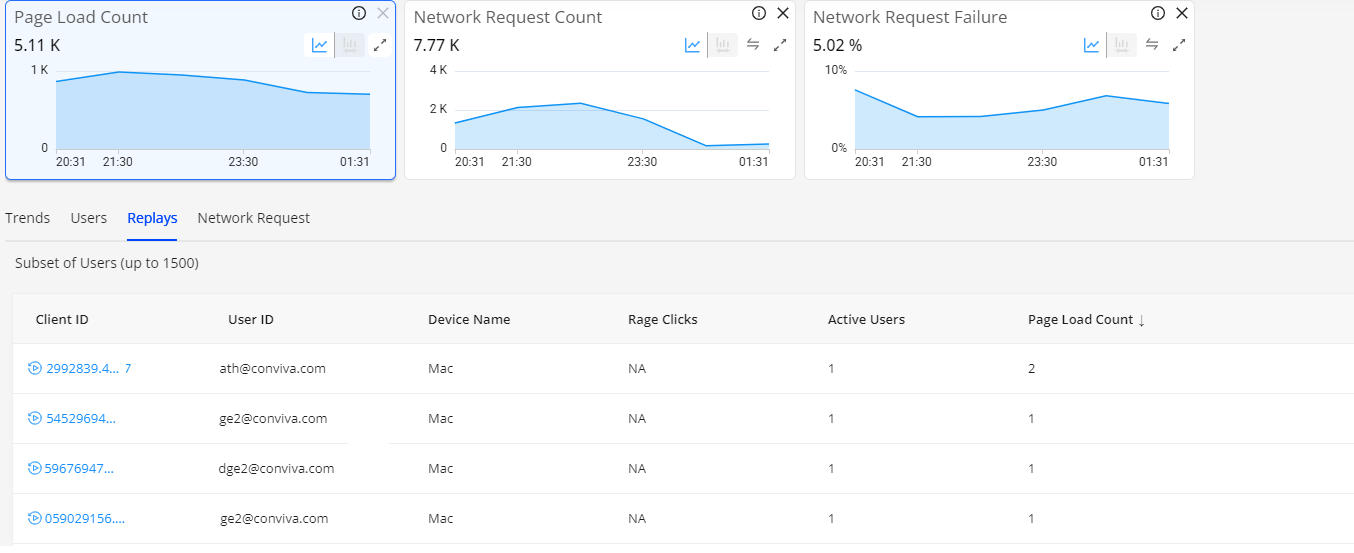
Access cohort replays of impacted sessions
Access Pulse: Cohort Replay |
In Trends, select a metric time series and then click the Cohort Replay tab to view the available sessions and access session replays. For more details, see Cohort Replays. |


 Marketing Teams
 (campaign engagement and performance, user pattern analysis)
-
Gain a complete, real-time engagement, across campaigns
-
Access pre-computed patterns and AI-driven insights on how users move through an application
| Marketing TeamTasks | Description |
|---|---|
|
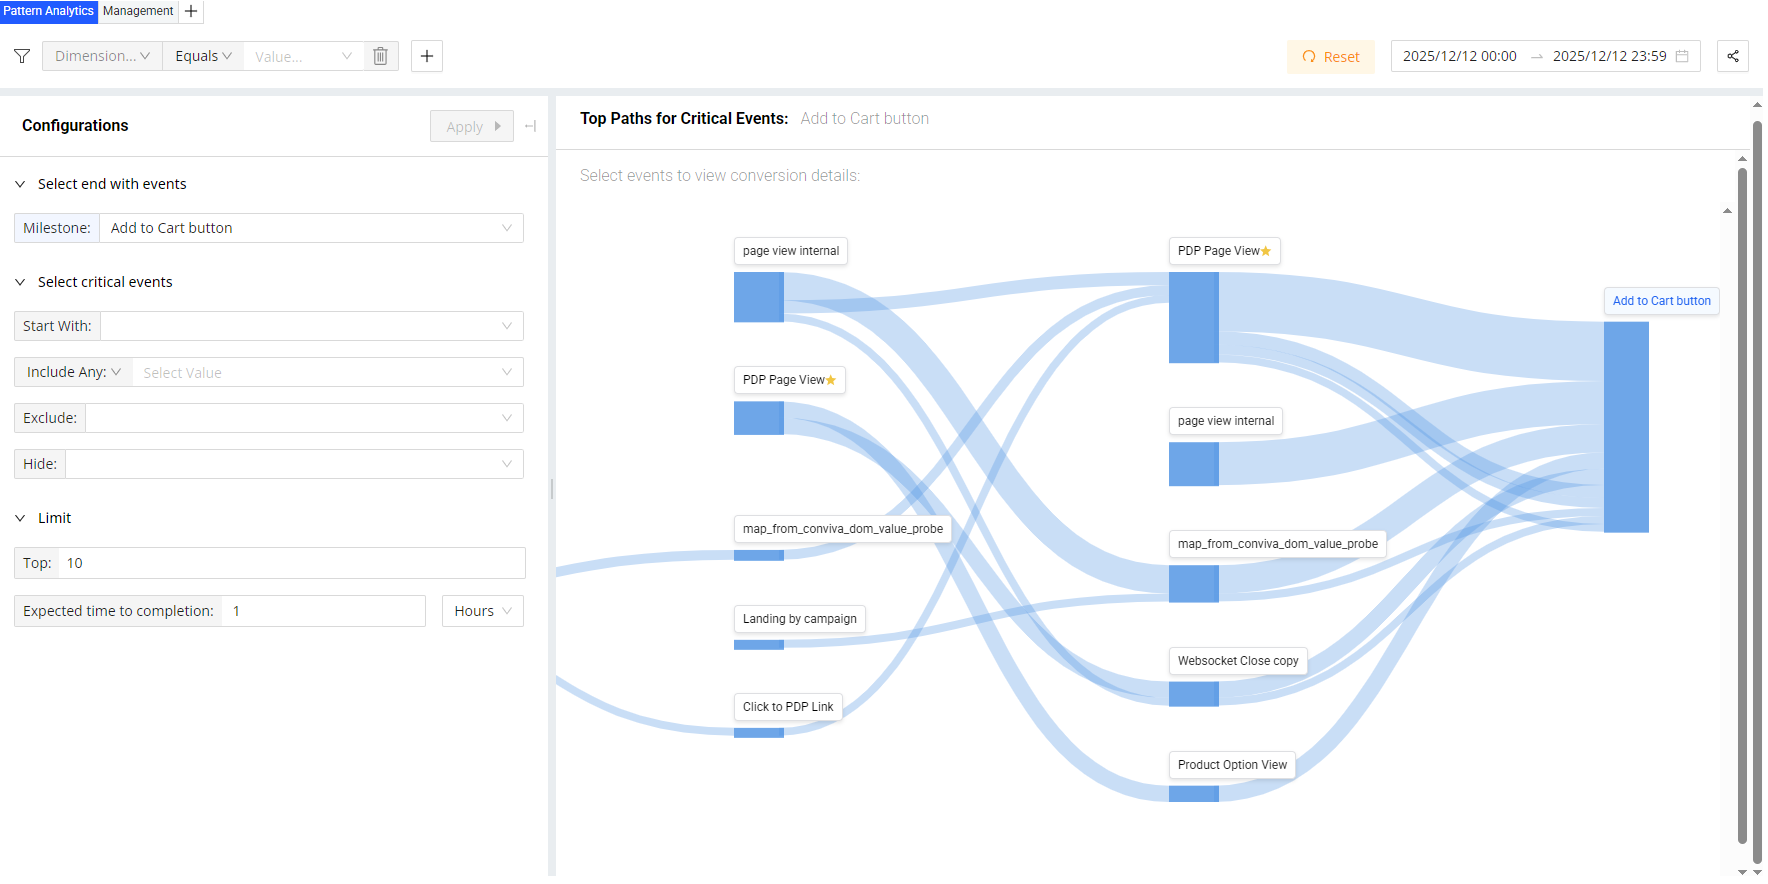
Patterns and AI-Discovered behaviors
Access Pulse: Patterns |
Use pattern analysis to explore user behavior patterns and critical blocks in task completions: For more details, see Patterns. |
|
Uset UTM Codes to Track Campaigns
Access Pulse: Trends |
Apply UTM code metadata to Flows to apply campaign analysis across all steps in user journeys. |
 Agent Teams
 (conversations to intelligence)
-
Continuous evaluation and optimization of agent conversation performance and outcomes turning every agentic conversation
-
Connect user prompts/patterns, conversational sentiment, response patterns and user follow-on actions
Agent Task Details
| Tasks | Description |
|---|---|
|
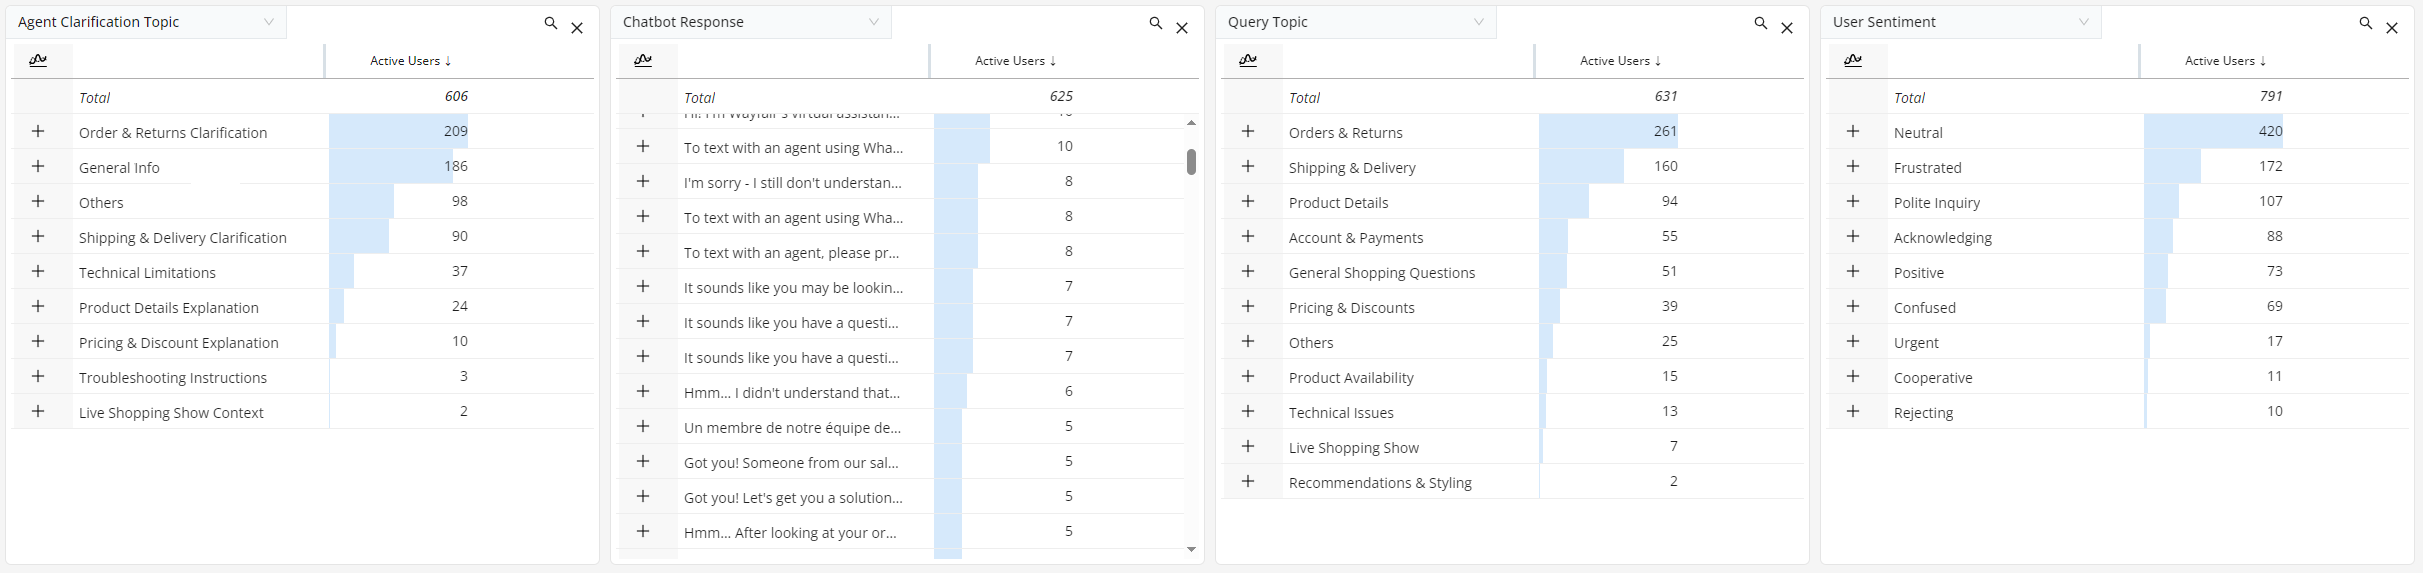
Agentic Dimensions in Trends Dashboard
|
AI Teams focus on agent use cases, linking user follow-on actions with optimized business outcomes. For more details, see Agent Intelligence. |
 Fixing App and Customer Issues/Operation Teams and Customer Support Teams
 (issue resolution, continuous improvements, pinpoint impacts)
-
Perform issue resolutions and continuous improvements
-
Monitor overall operational performance metrics
-
Drill down to discover impacts and analyzing impacted session timelines and viewer experiences.
-
Access historical and real-time data with customized granularity.
-
Easily monitor overall app performance along with specific details for each user.
-
View detailed user and event timelines to pinpoint experience impacts
Operation and Customer Support Teams Task Details
| Tasks | Description |
|---|---|
|
Check Notifications from AI Alert and Do Analysis in AI Alert Dashboard
Access Pulse: AI Alerts |
For more details, see AI Alerts. |
|
View Presets Dashboards
Access Pulse: Presets |
For more details, see Presets. |
|
Analyze Metrics and Dimension Data
Access Pulse: Trends |
Operation Teams and Customer Support Teams use these functions to do deep analysis:
For more details, see Trends and Summary Tab. |
|
Build Custom Metrics and Dimensions for Advanced Analysis
Access Pulse: Activation |
With the activation tools, set up event mappings to build customized metrics and add new dimensions to efficiently transform application events into advanced data insights.
For more details, see Semantic Mapper and Metric Builder. |
|
Do Real-Time Analysis
Access Pulse: |
|
|
View User Timelines
Access Pulse: Users |
Customer Support Teams view detailed messages of an event time stamp and all events within that time stamp by clicking the time stamp in the User Timeline Index. In the User dashboard, leverage AI-generated summaries of customers' quality of experience to make it easier for agents to engage with them. For more details, see User Dashboard. |


 Analyzing and Reporting/Data Teams
 (custom metrics and dimensions, app ecosystem performance)
-
Easily create custom metrics and dimensions to analyze the most critical performance areas
-
Monitor detailed metrics and related dimensions to determine the health of the app ecosystem
|
Data Science Tasks |
Description |
|---|---|
|
Ingest Data
Access Pulse: Integration Tools |
With the Conviva DPI sensor, collect data automatically. For more details, see DPI Integration. |
|
Create Custom Dashboard
Access Pulse: Custom Dashboards |
Create personalized dashboards and discover new insights by combining widgets and display options to emphasize key insights.
For more details, see Custom Dashboards. |
|
Integrate AI alerts with PagerDuty
Access Pulse: Settings > PagerDuty |
Integrate AI alerts with PagerDuty to enhance DPI AI alerts with PagerDuty escalation management and notifications. You need a PagerDuty account with configured services to integrate Conviva alerts with the configured PagerDuty services. For more details, see Conviva PagerDuty Integration Guide for DPI. |
|
Set AI Alerts Email Subscriptions
Access Pulse: Settings > Email Subscriptions |
Sets up email notifications for prompt updates when performance issues meet AI alert conditions.
For more details, see AI Alert Email Subscription. |
|
Build Custom Metrics and Dimensions for Advanced Analysis
Access Pulse: Activation |
With the activation tools, set up event mappings to build customized metrics and add new dimensions to efficiently transform application events into advanced data insights. For example, map new live video attempt events and create the Live Video Attempt to Play Time metric based on the live video attempt and live video play events to identify user engagement with video content and facilitate analysis of any underlying factors contributing to delays in playback. For more details, see Semantic Mapper and Metric Builder. |


Trending Topics
This section contains information about how to use and troubleshoot DPI, along with tips on best practices and latest feature updates.
-
API Usage Breakdown and Application Management
Sensor Remote Control for Android and iOS(Beta)
Overview: New Events Section with Preset (Beta)
AI Alert Notification: Google Chat Notifications for AI Alerts (Beta)
Metric Builder: Adds an Option for Additional Dimensions in Flows and Custom Metrics Settings
Trends: Percentile Aggregation for Duration Metrics (Beta)
Trends: Percentile Aggregation for Flow-Duration and Custom Metrics (Beta)
Flow Builder: Adds an Abandoned Flows Metric
Metrics: Adds Avg Soft Navigation Time as a new Web User Experience Metric (Beta)
Activation: Enables Management Data Downloads
Dimensions: Adds Designated Market Area (DMA) as a Dimension
AI Alerts: Supports AI Alerts for Mins With High Network Response Duration
Metrics: Adds Mins With xxx Network Request Response Code
-
Success Plans
Conviva DPI Success Plans help guide customers to meet and exceed key business and operational goals using DPI features.
Diagnosing Performance Impacts
Monitoring Software Release Quality
Monitor and Track Service Levels
DPI DPI Performance DPI Performance DPI Performance