Use this list of DPI terms and concepts to become familiar with DPI terminology and features. See DPI Overview for a high-level summary for DPI capabilities.
A
_________________________________________________________________________________
Account Details
|
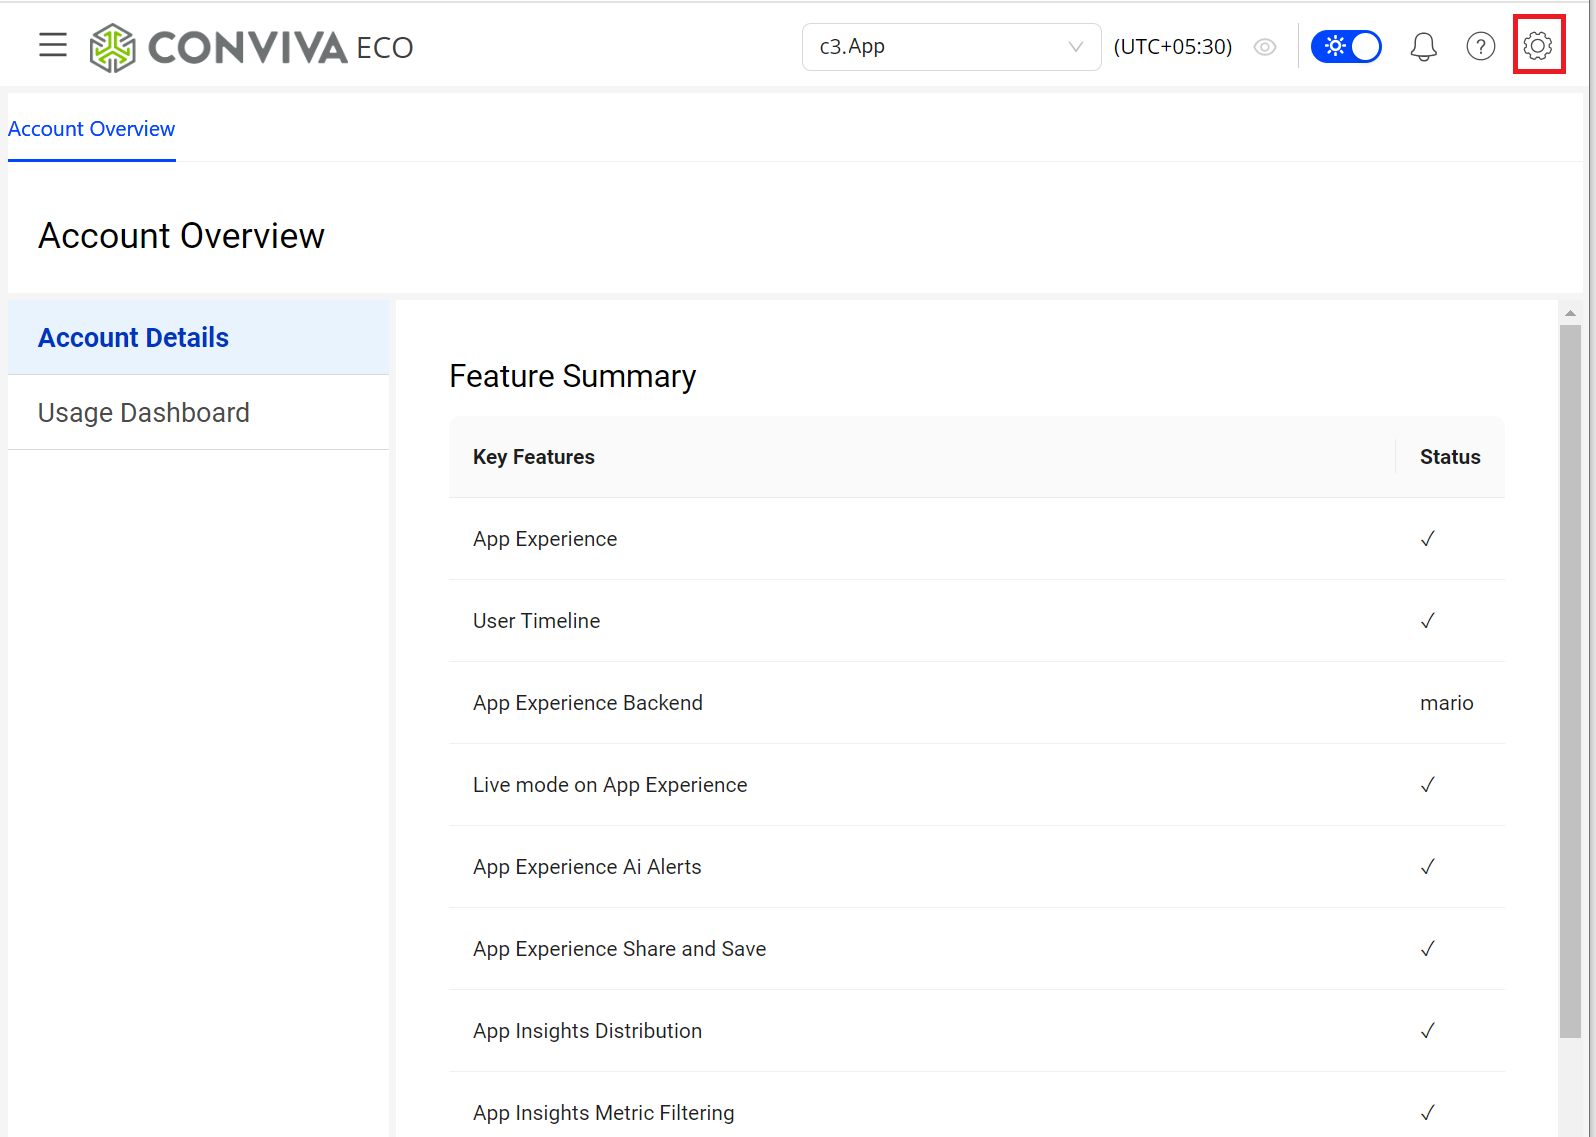
Provides a detailed feature summary of enabled features and feature limits. For more details, see Account Details. Access Account Details from the DPI Settings icon in the Main Tool Bar. |
|
Activation
|
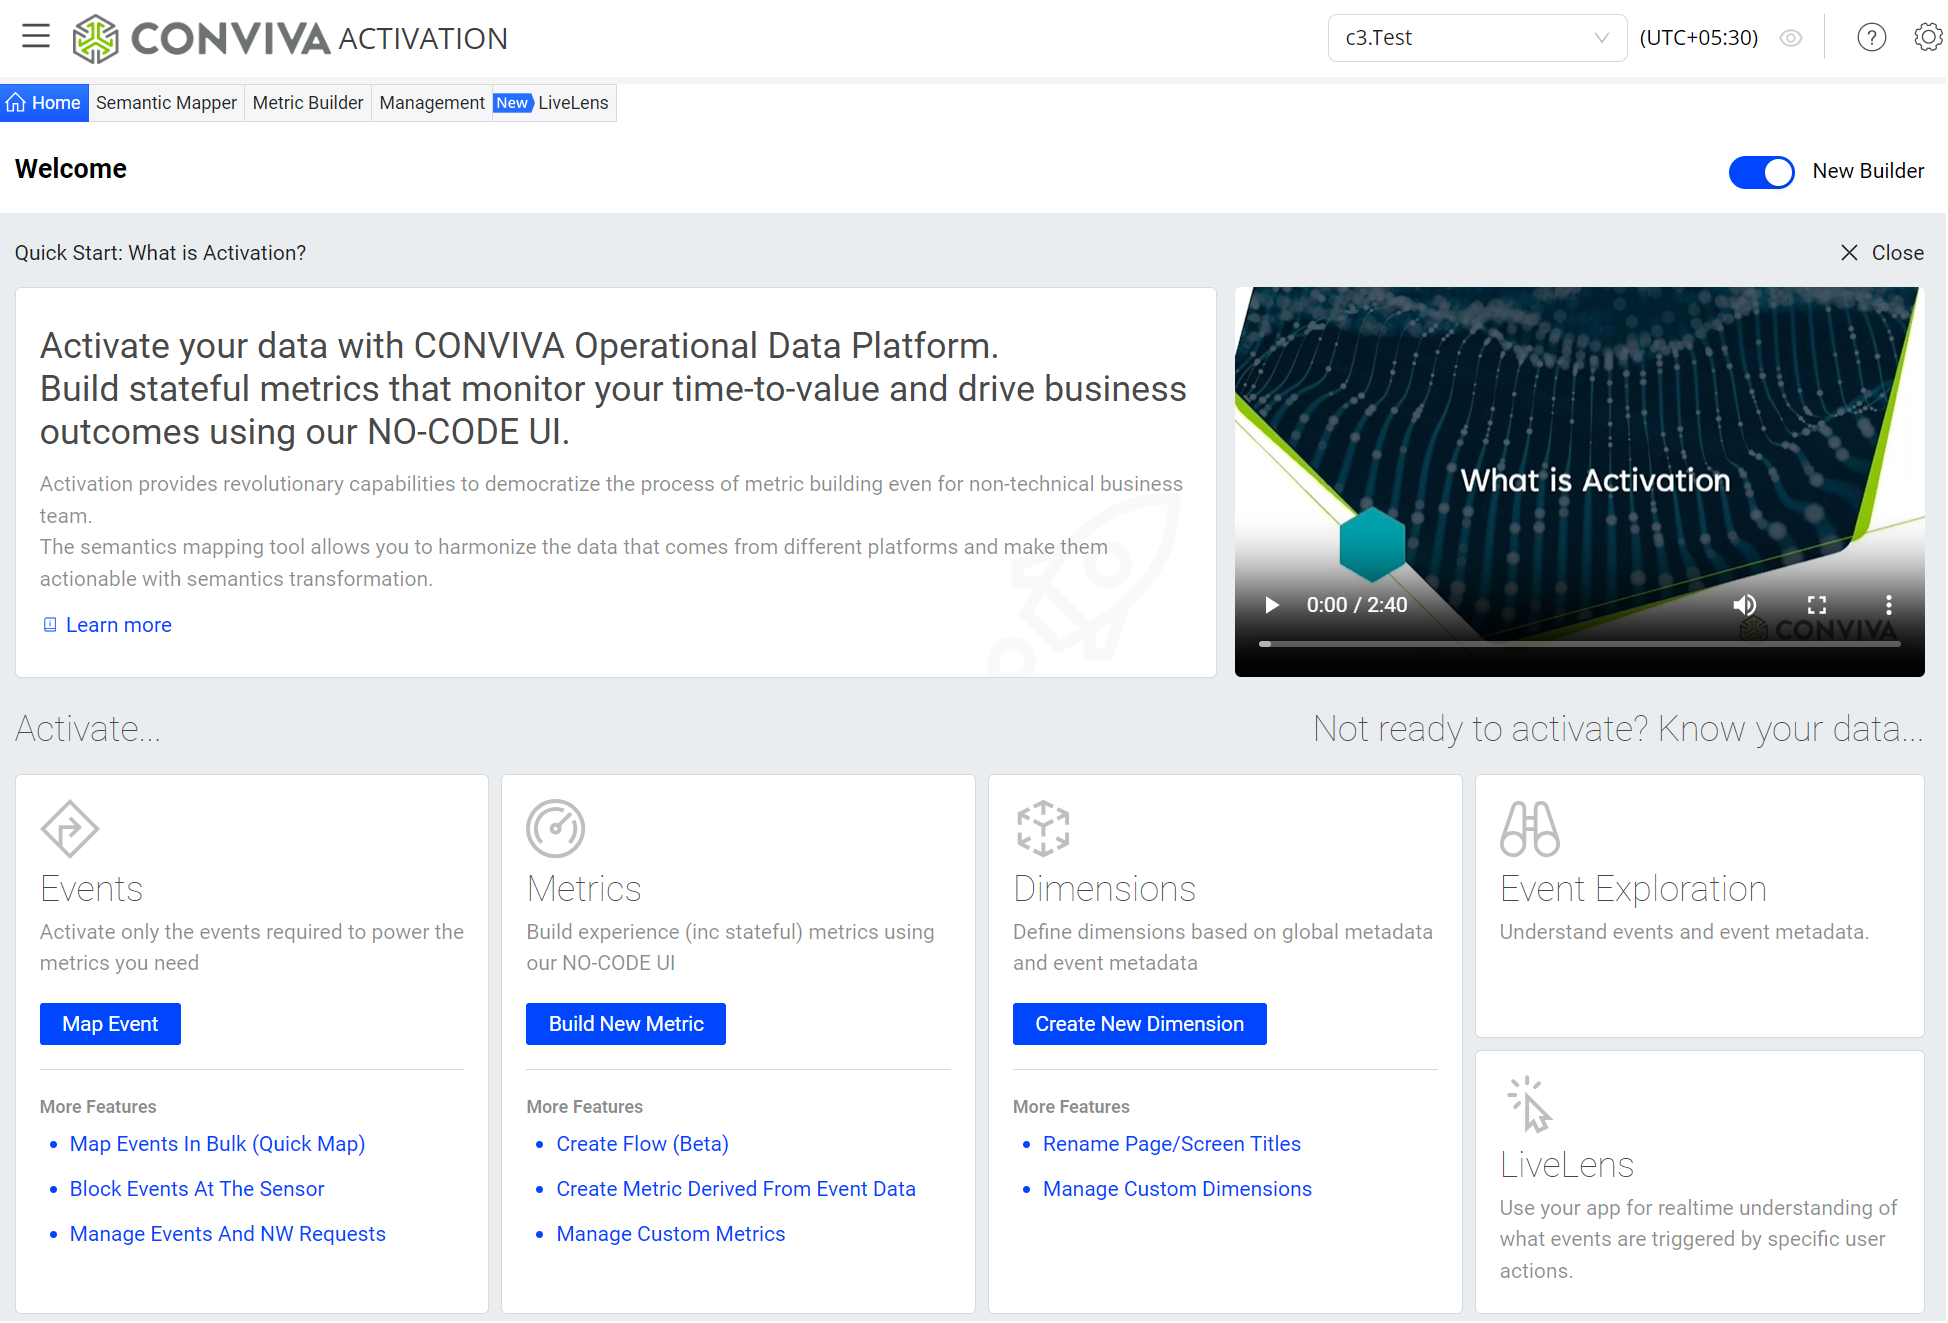
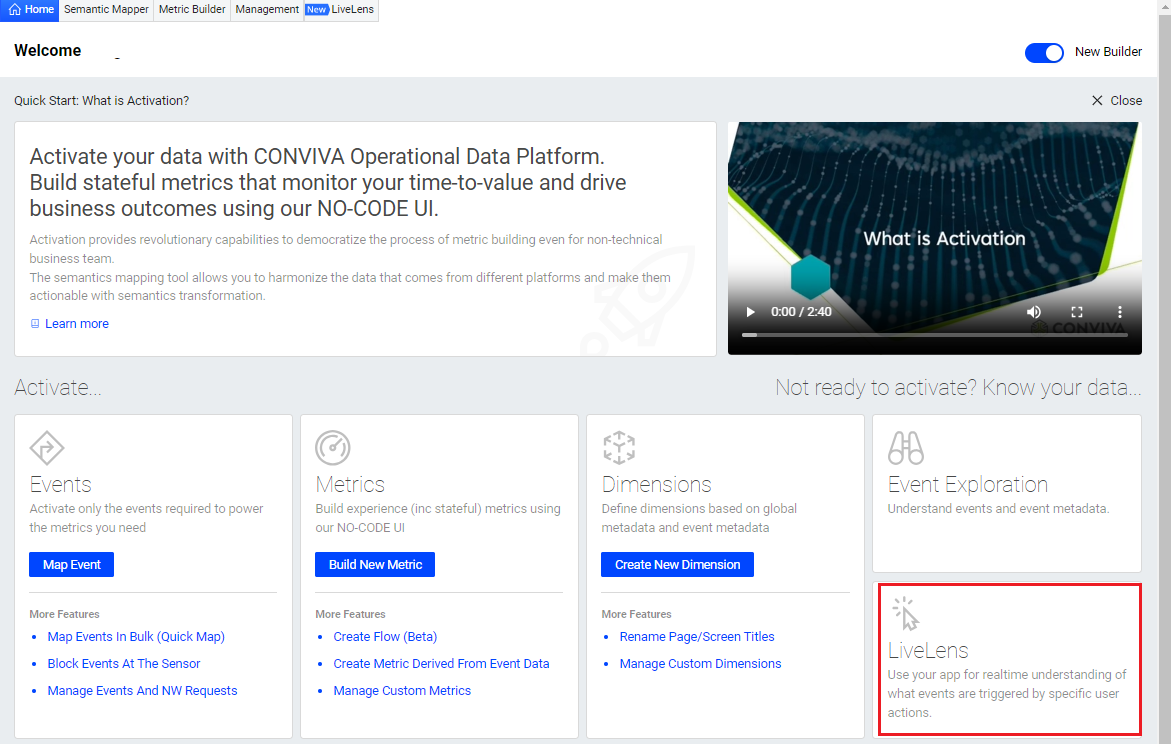
Activation simplifies event organization and identity mapping within your application to efficiently set up mapping rules, such as mapping login activities across multiple application platforms to a single login event. Based on these mappings, build experience-centric metrics to efficiently explore and manage app user experiences for enhanced experience insights and flow analysis. Also, manage/block events and network requests in the Activation Management tab. For more details, see Activation. Launch Activation from the main DPI menu. |
|
Aggregation Metrics
|
Activation simplifies event organization and identity mapping within your application to efficiently set up mapping rules, such as mapping login activities across multiple application platforms to a single login event. Based on these mappings, build experience-centric metrics to efficiently explore and manage app user experiences for enhanced experience insights and flow analysis. Also, manage/block events and network requests in the Activation Management tab. For more details, see Activation. Launch Activation from the main DPI menu. |
|
AI Alerts
|
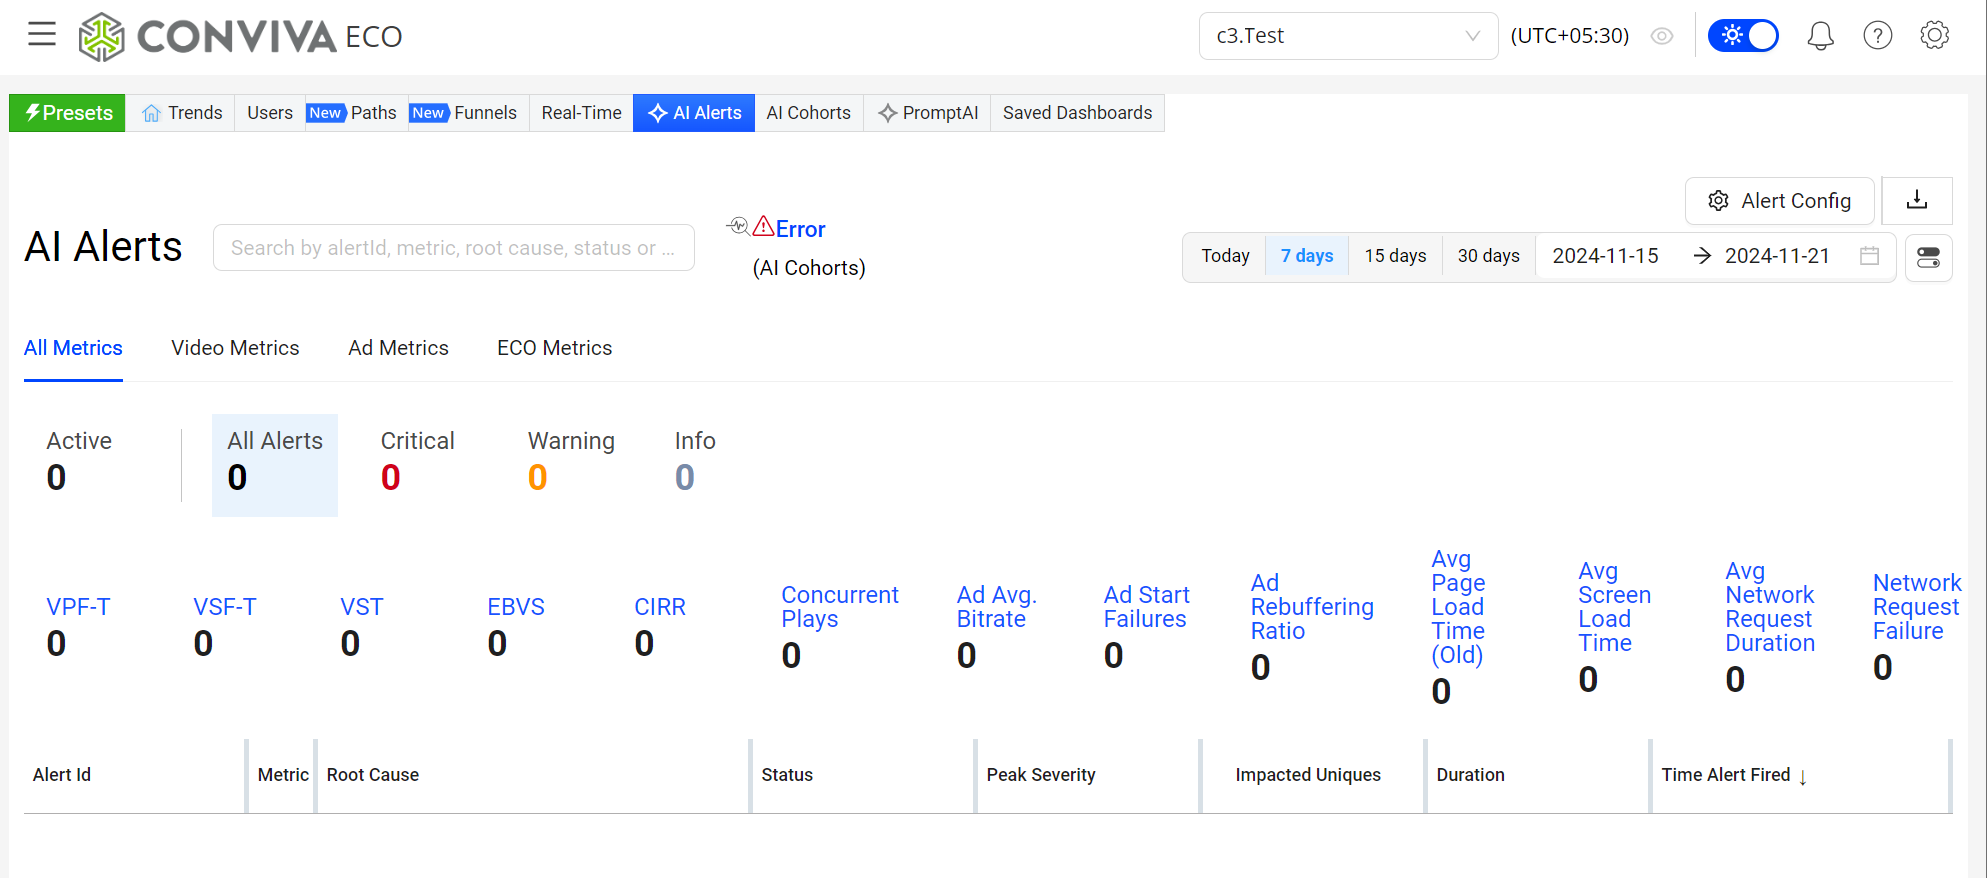
AI Alerts combine user actions with app and system responses to give your technology, business, and operations teams AI-powered insights into issues impacting user experience and engagement. Based on the configured AI alert metrics, the AI alerting system continuously checks for anomalies and computes a baseline along with a range of variation across dimensional root-cause groups, resulting in near-instantaneous notification of anomalous events and insights, pointing out issues and likely root causes. For more details, see AI Alerts. Launch AI Alerts from the main DPI menu and application tab. |
|
AI Cohorts
|
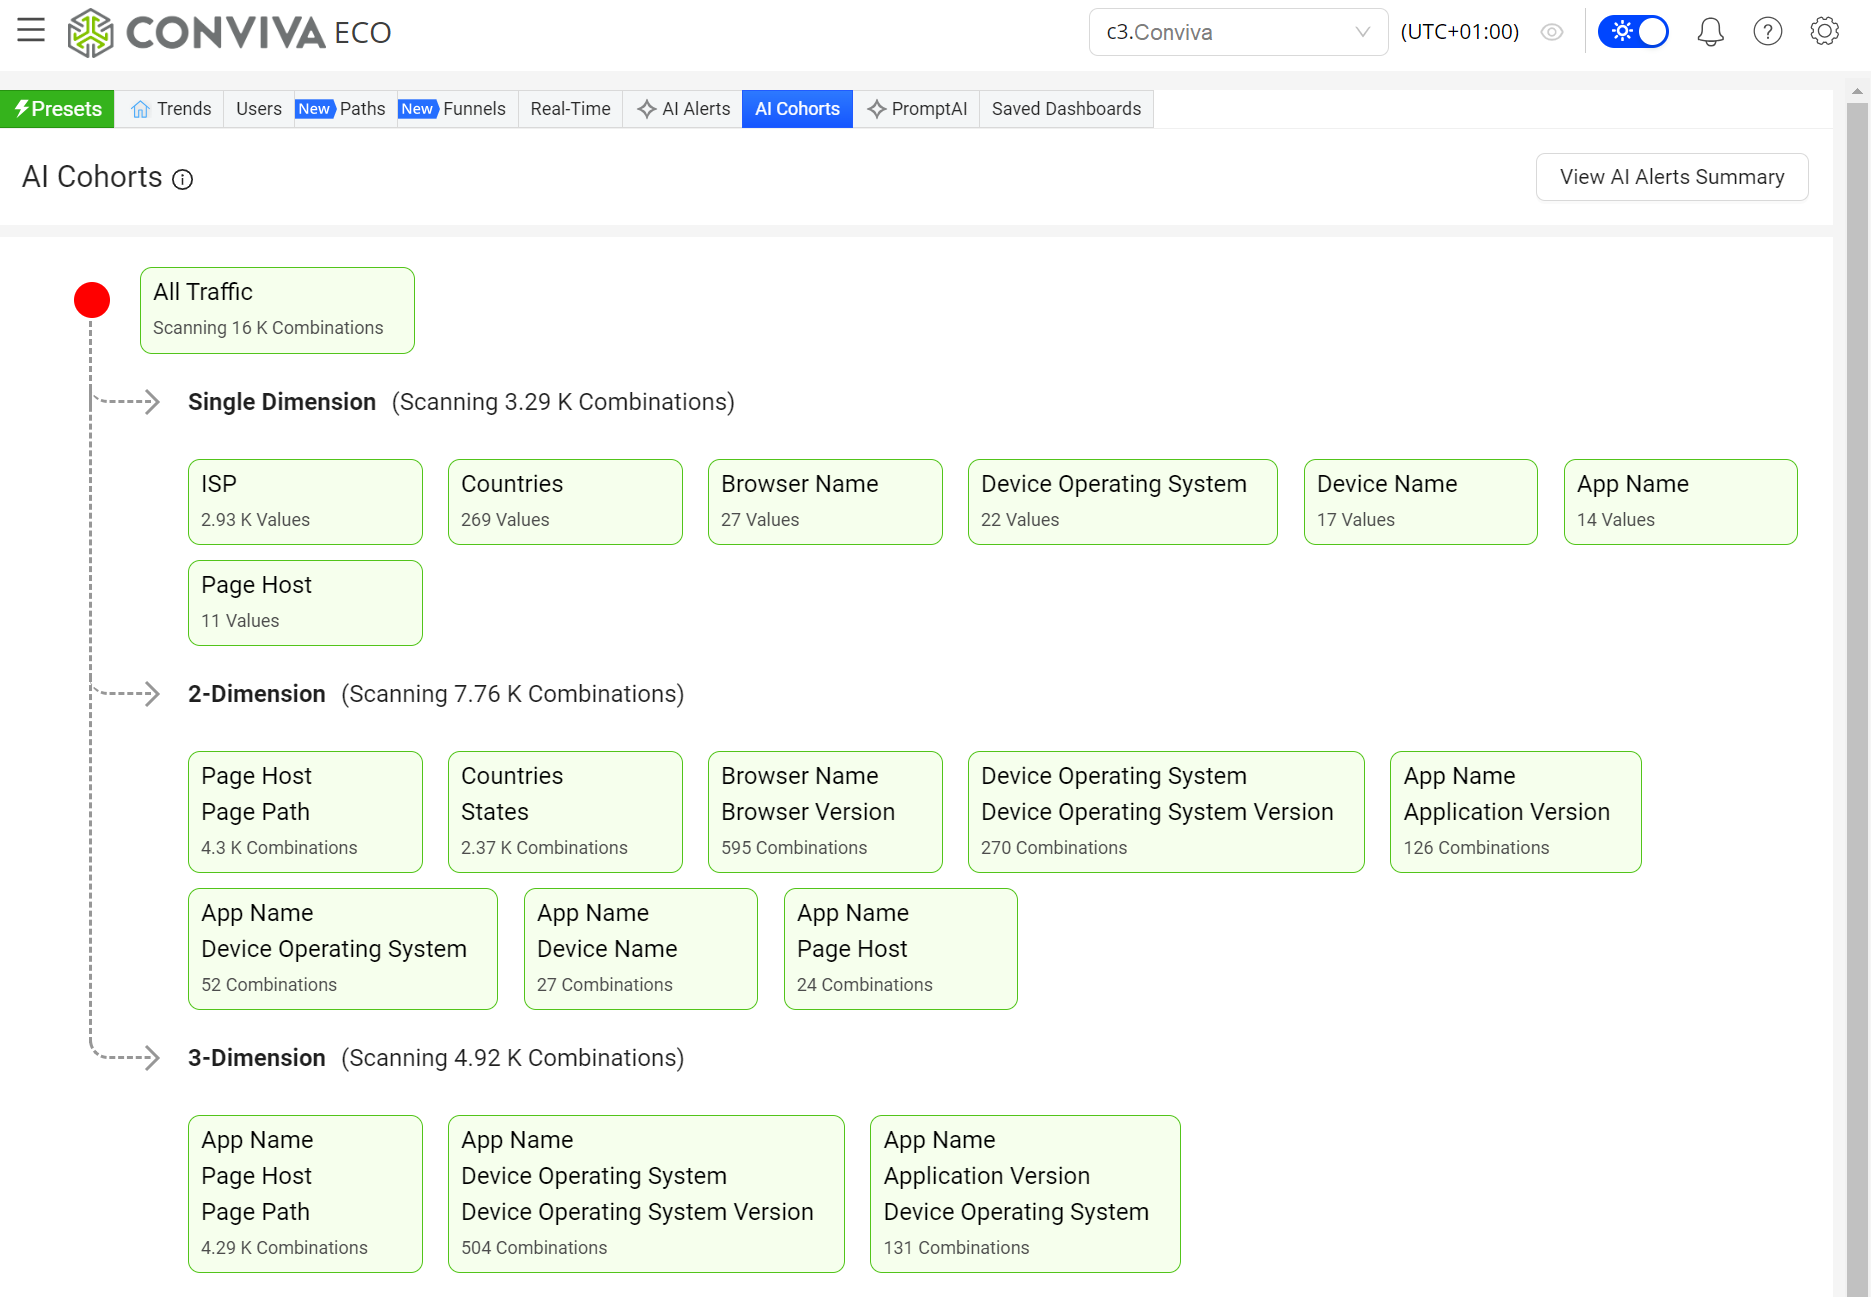
AI Alert processing scans dimension groups or alert cohorts to narrow alert impacts for quick actionability. Customize alert cohorts for single dimensions or groups of up to 4 dimensions. For more details, see AI Cohorts. Launch AI Cohorts from the main DPI menu and application tab. |
|
Analysis Tab
|
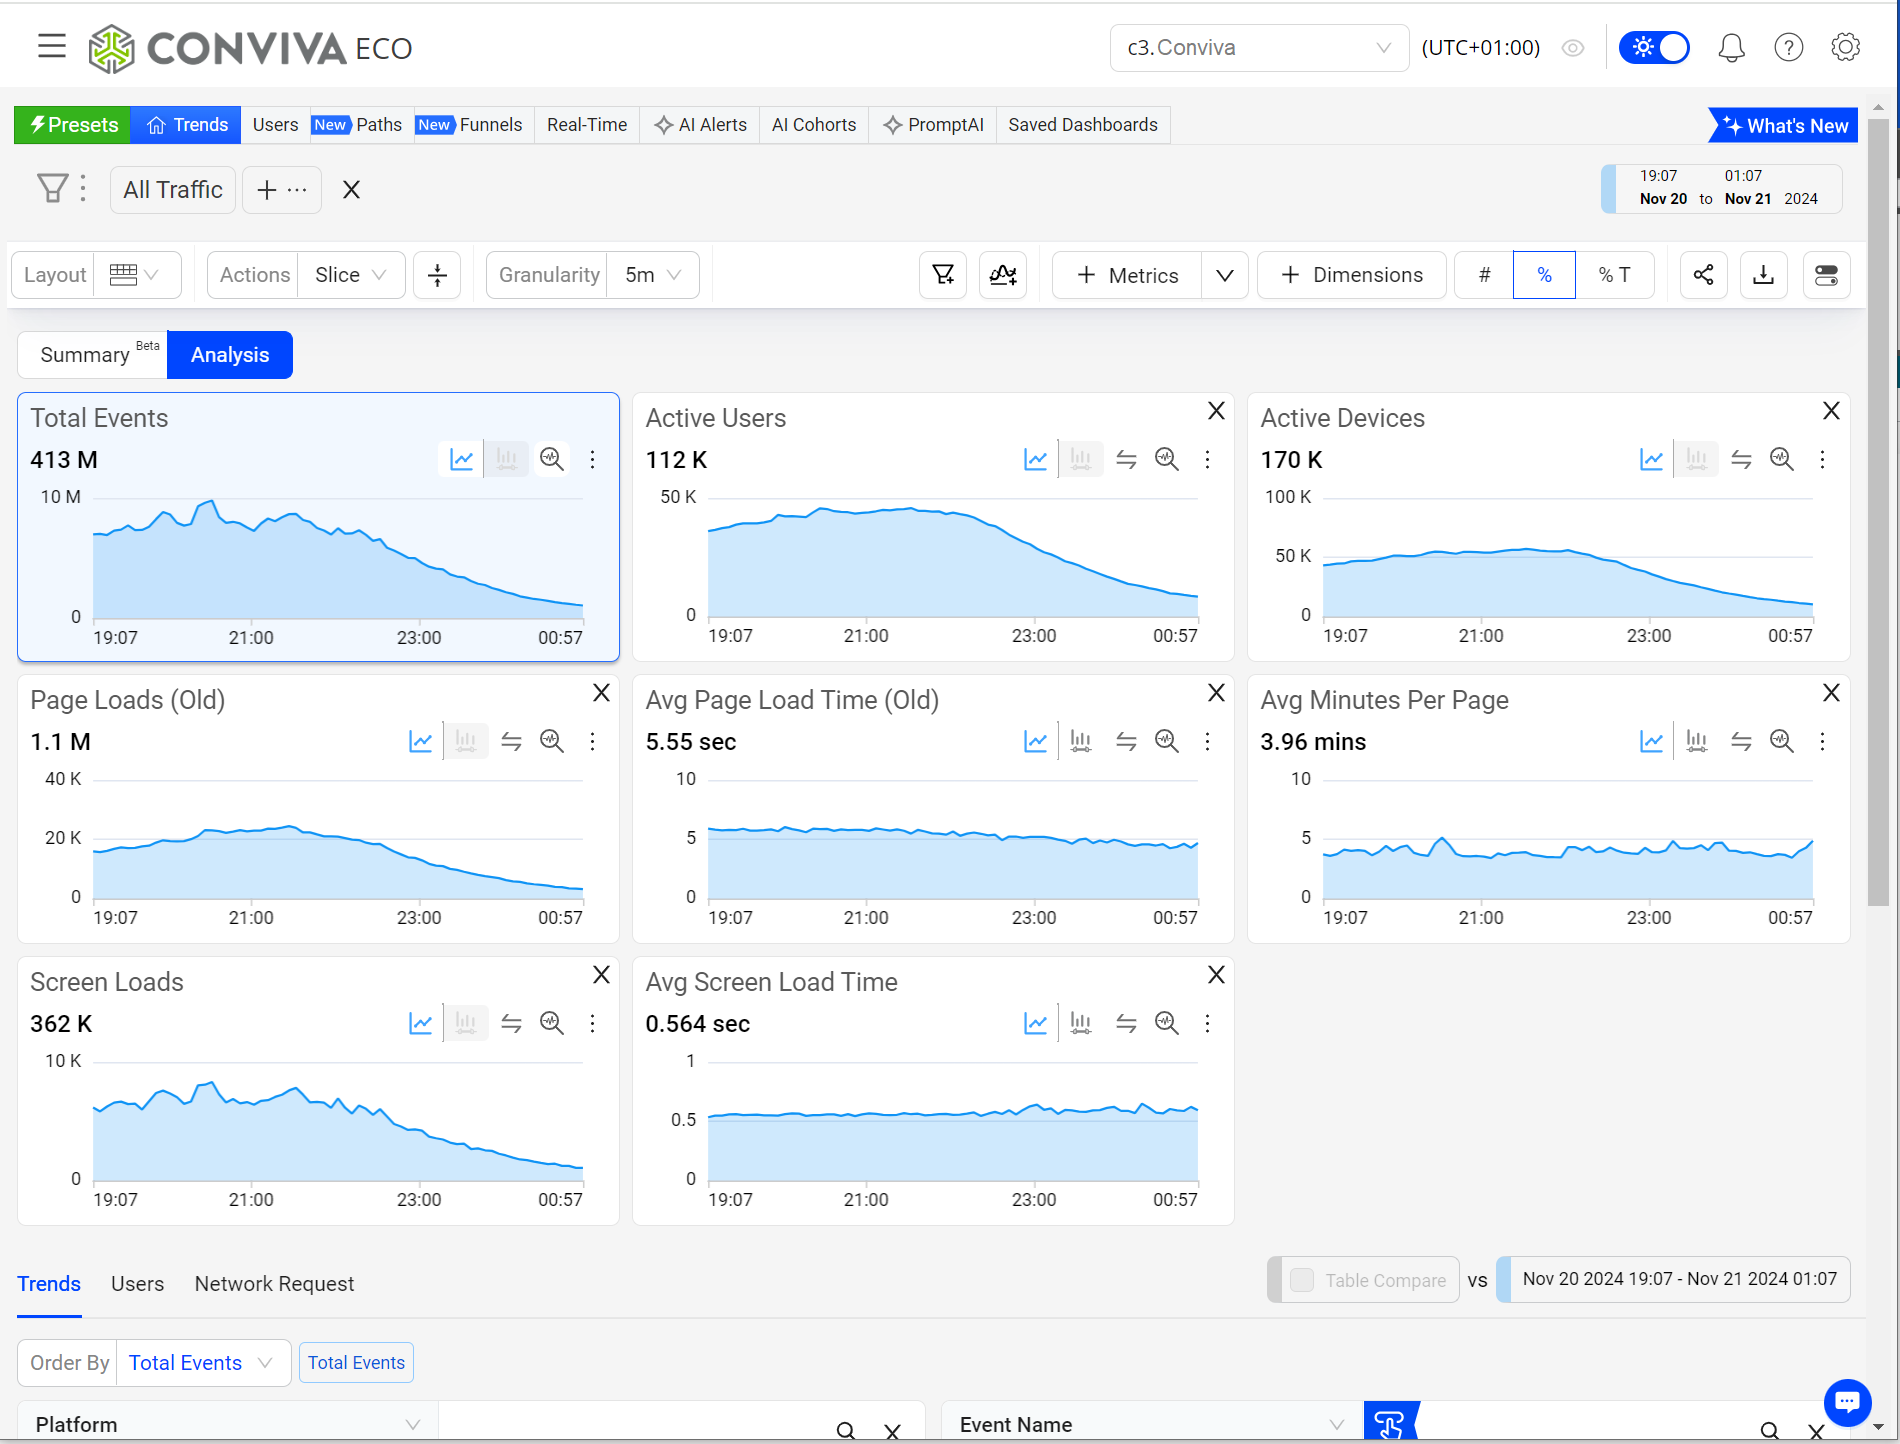
In Trends, one of the main tabs for displaying metric time series and distributions along with dimension tables for targeted drill-down analysis. This tab also contains options for users and network requests analysis. Trends also provides a main Summary tab high-level performance analysis. For more details, see Trends. Launch Trends from the DPI menu. |
|
Annotations
|
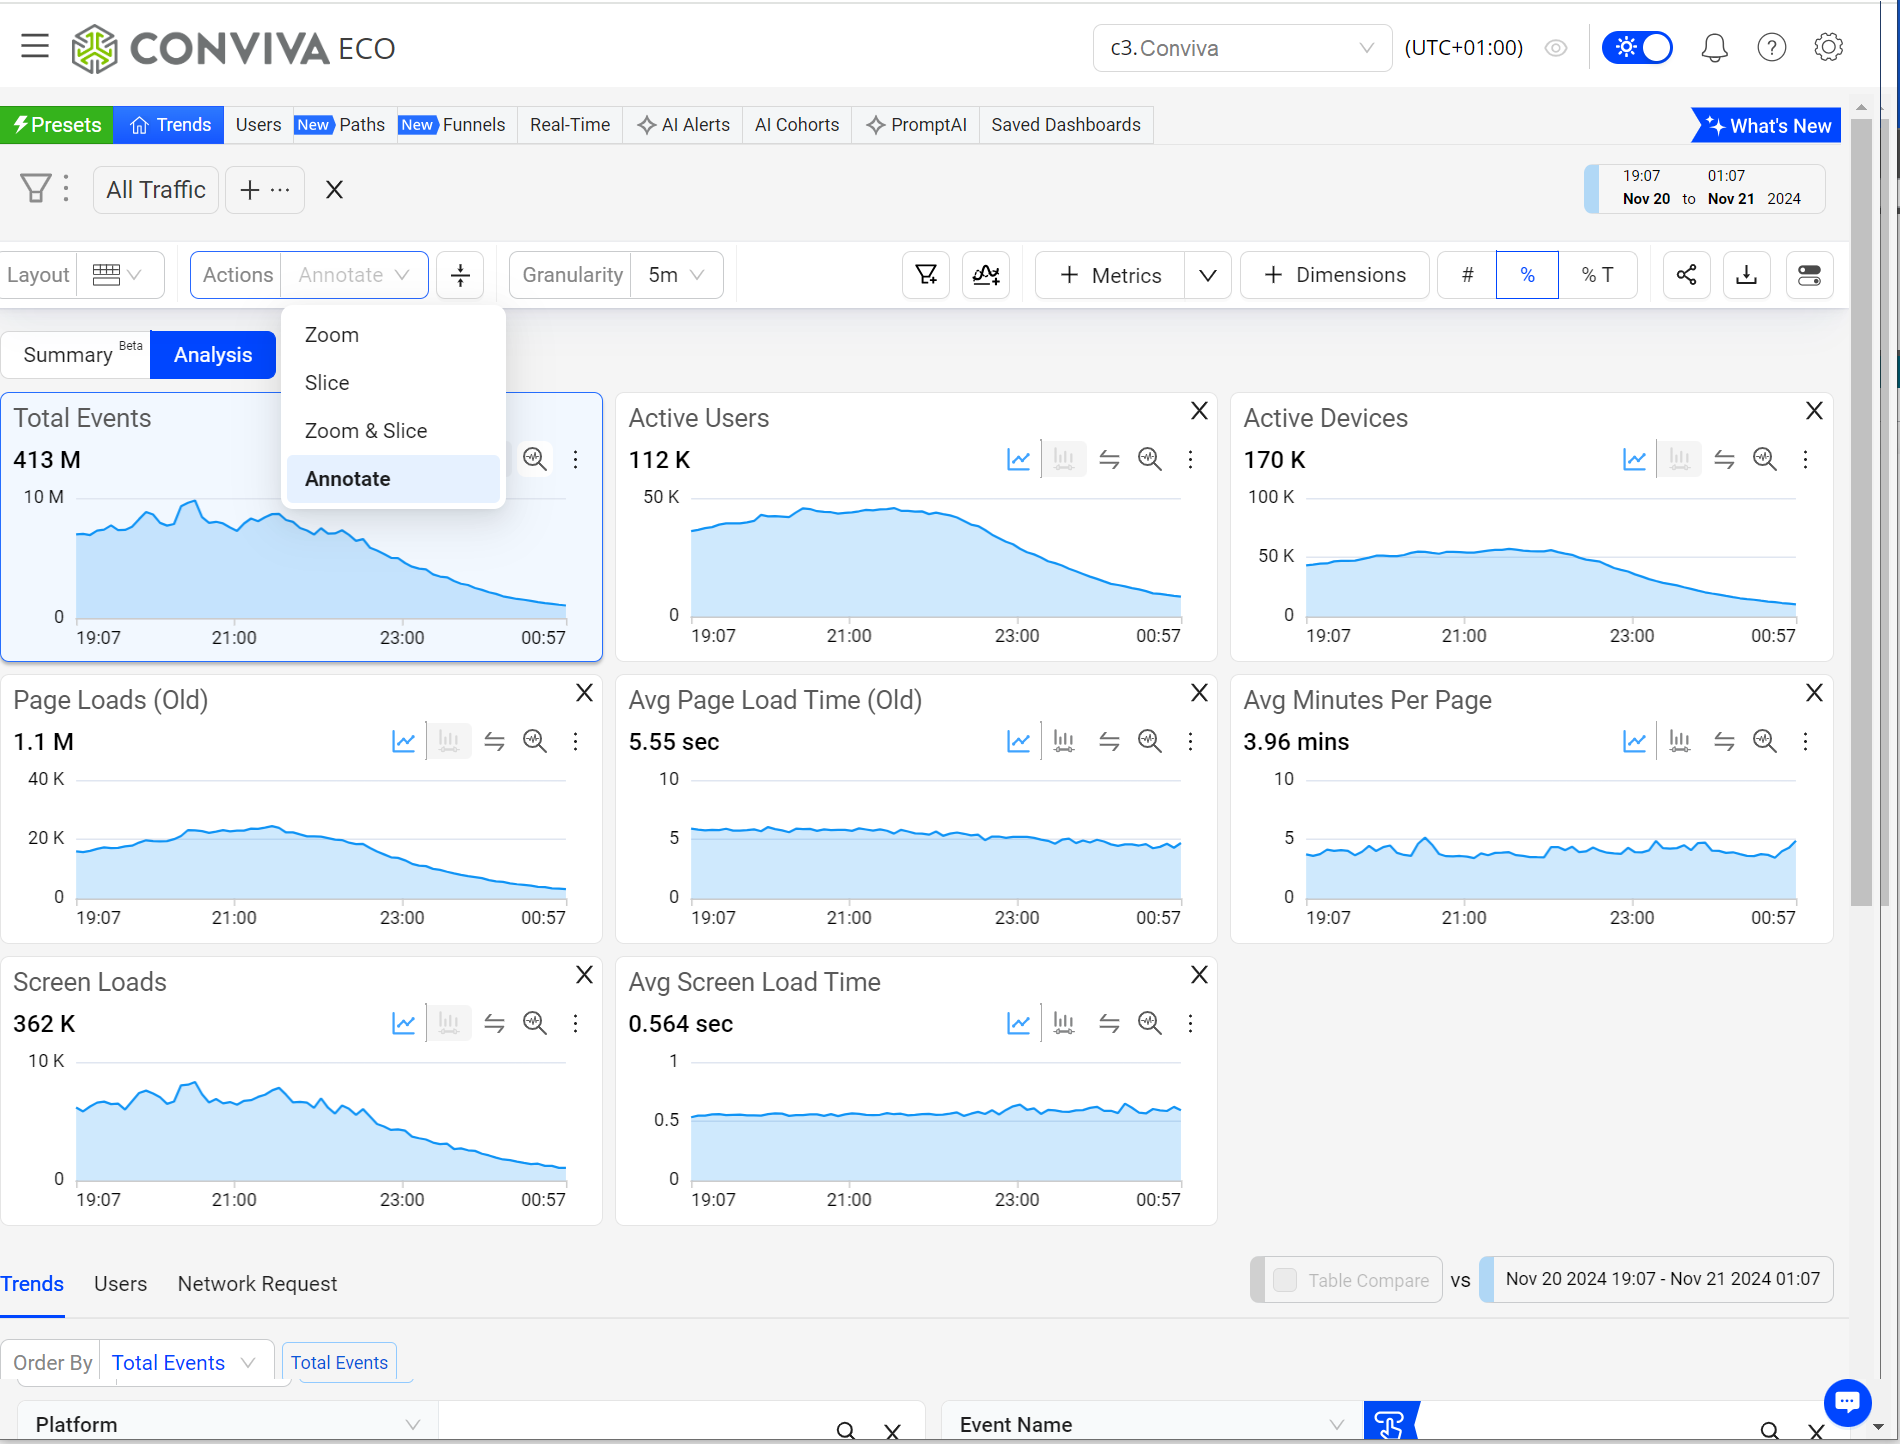
Customized notes and visual indicators added to metric time series and distribution widgets to highlight key data points and share collaborative descriptions with other users. For more details, see Annotations. Lanuch Annotations from the Action menu in the Trends Tool Bar. |
|
C
_________________________________________________________________________________
Compare
|
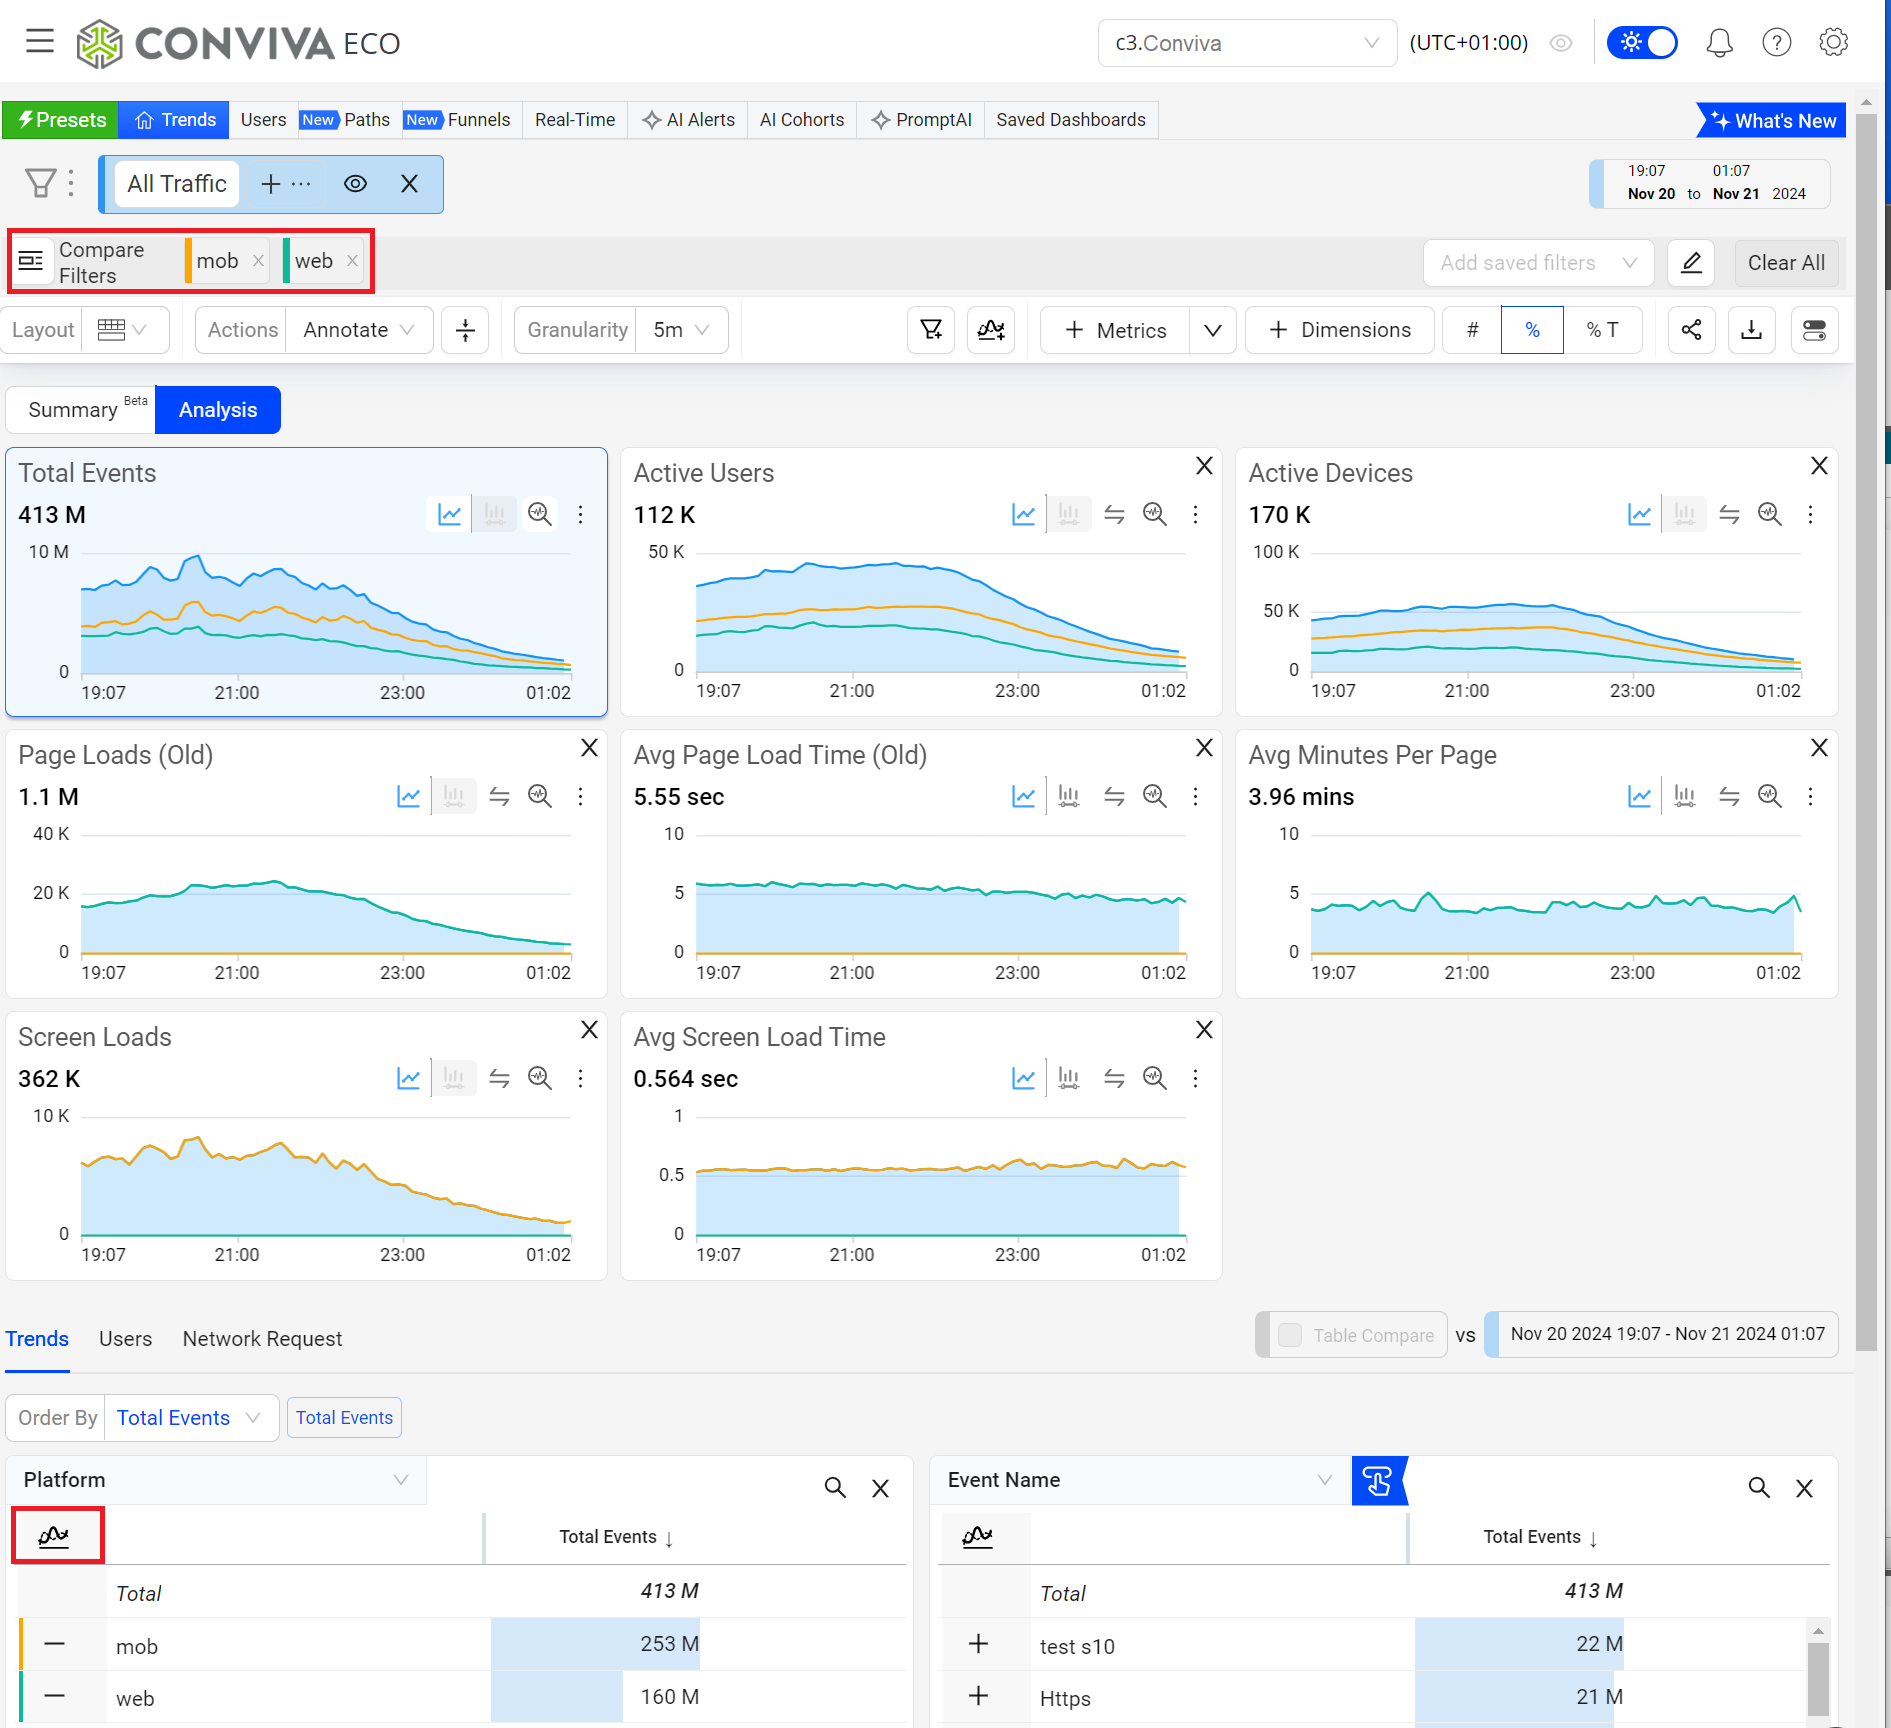
Extend Trend analysis with advanced comparative analysis. With a single click quickly display the top 10 dimension comparisons for performance juxtaposition highlights. Add comparative percentage values in the dimension tables to directly identify which dimension values contributed most to a spike or drop. With advanced compare, build custom comparisons across complex dimension combinations for expanded cross-dimensional impact correlation. For more details, see Compare Top Filters icon and Advanced Compare icon. Perform quick comparisons with the Compare Top Filters icon in the Trends dimension tables. Build advanced comparisons using the Advanced Compare icon in the Trends Tool Bar. |
|
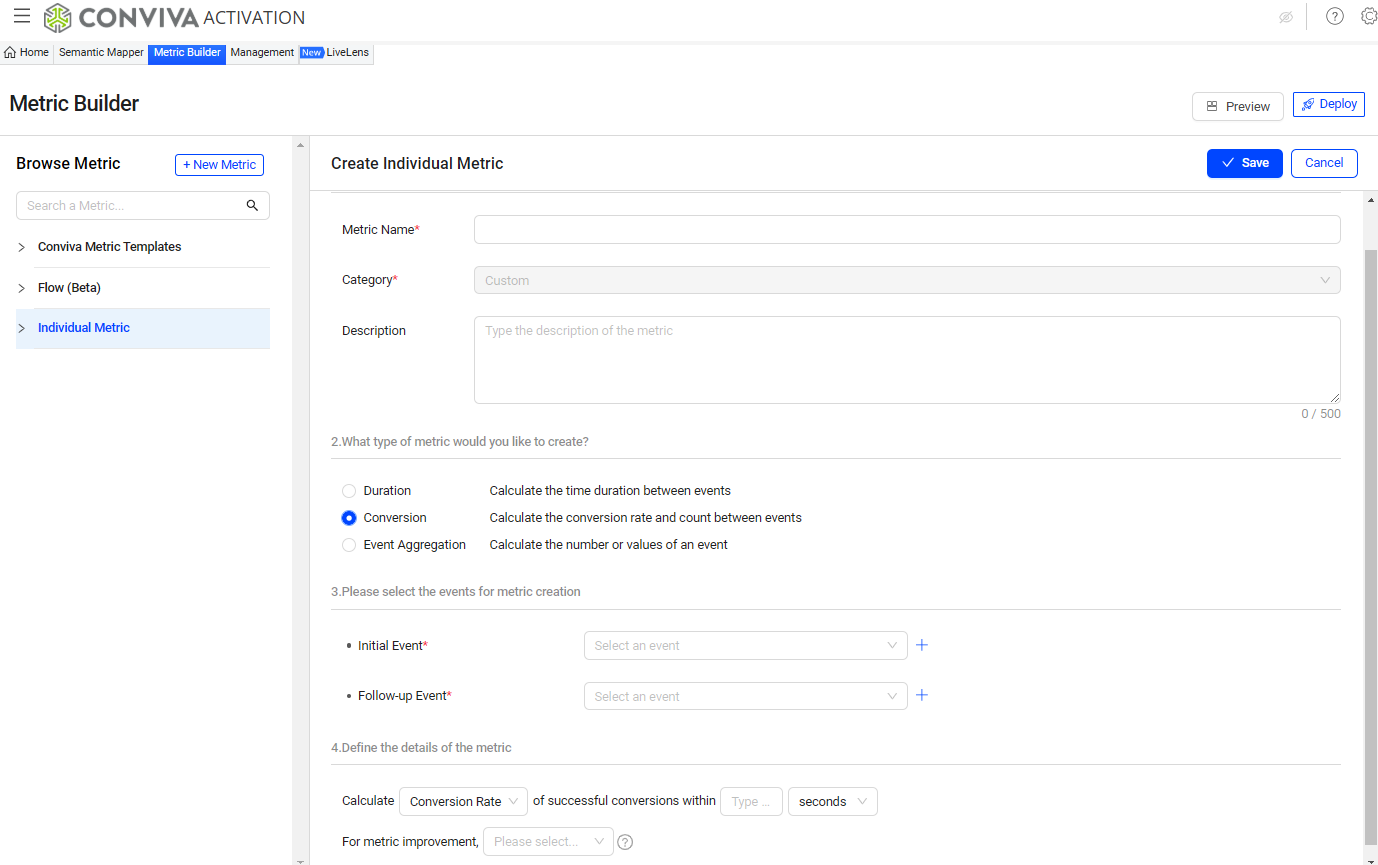
Conversion Metrics
|
A type of DPI Custom metric associated with initial and follow up events that measures the count or conversion rates of events from one stage to another, such as the count of sessions with successful login after opening the login screen. See also, Custom Metrics. For more details, see Metric Builder. Create conversion metrics using Metric Builder from the DPI Activation menu. |
|
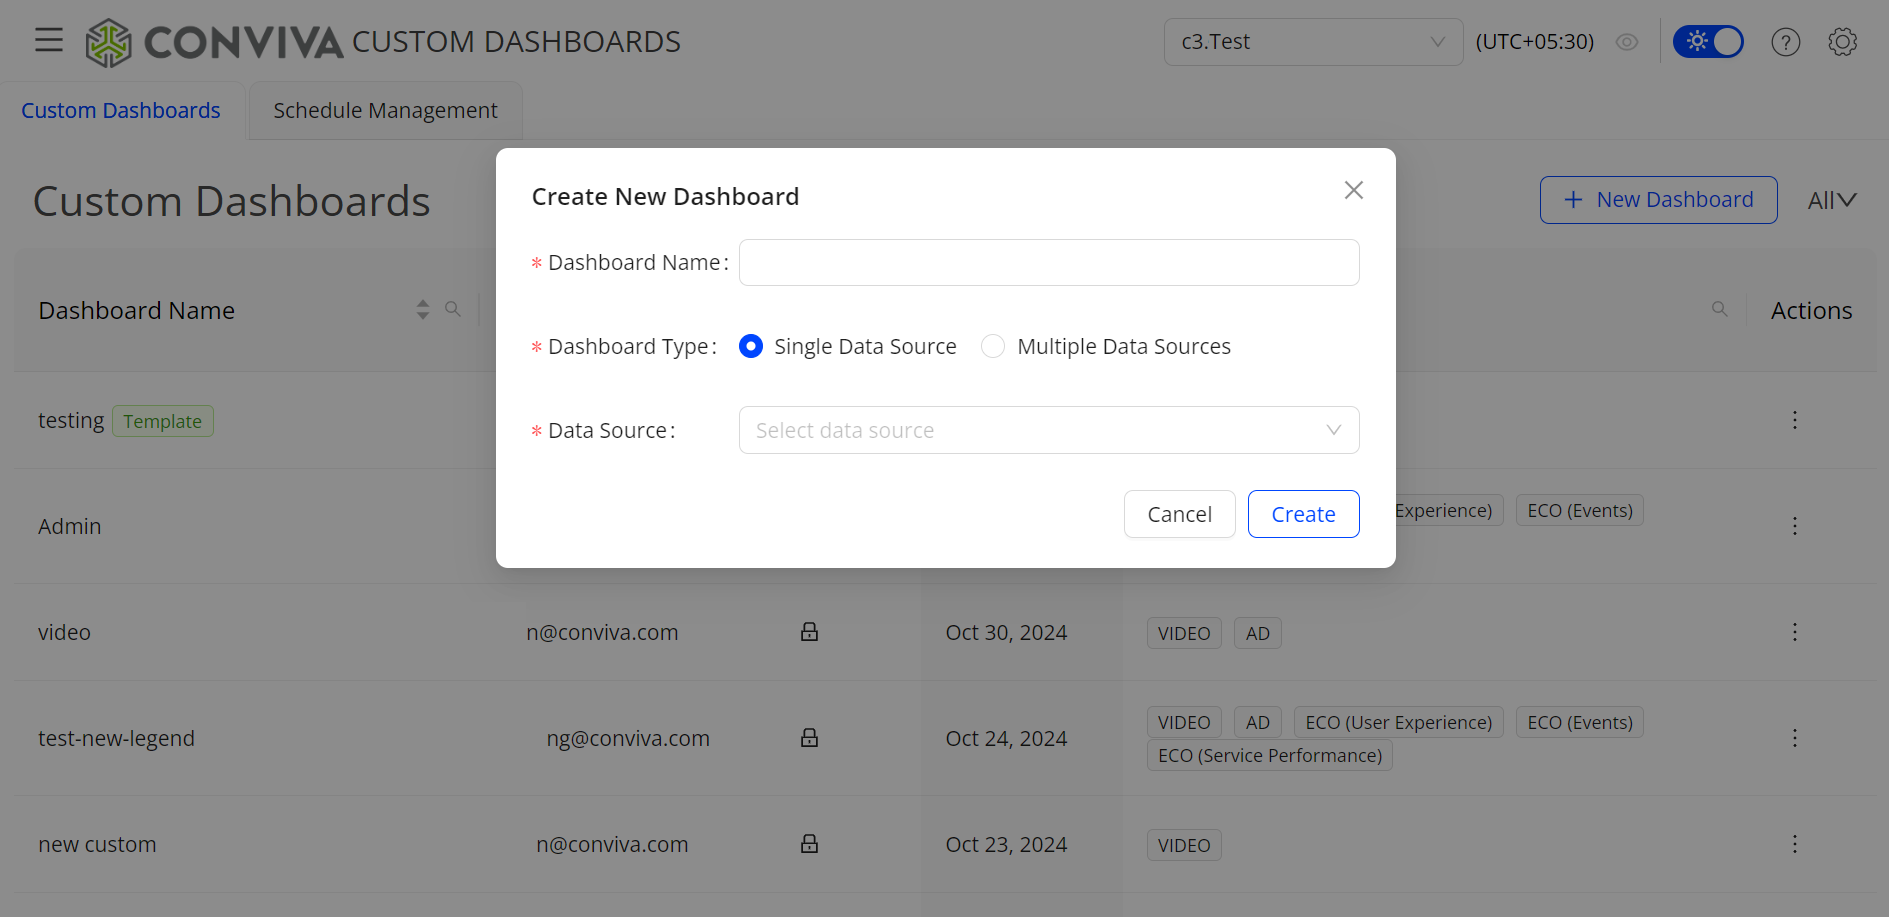
Custom Dashboards
|
Configured dashboards that enable the combination of widgets and display options to highlight the insights in summary, table, and distribution formats across DPI and Video data. Filter settings allow targeting specific types of app sessions, such as page views on Windows 8 apps viewed in San Jose, California United States during the last 30 days. For more details, see Custom dashboards. Create Custom dashboards from the DPI menu. |
|
Custom Dimensions
|
Custom dimensions are extracted from event keys to provide enhanced levels of dimensional analysis in Trends dimension tables and AI alerts. With custom dimensions, analyze application performance and user behaviors more efficiently and flexibly. Create custom dimensions with values extracted from events to enhance your analysis of application performance and user behaviors, such as a dimension value extracted from only the play start and play end events. Manage custom dimensions along with events in the Management page. For example, create a custom dimension based on the Player Name event tag key and select mapped events to determine the dimension values. This new dimension enable the analysis of application player performance across different player dimensions in the Trends dashboard. For more details, see Create Custom Dimension. |
Custom Metrics
|
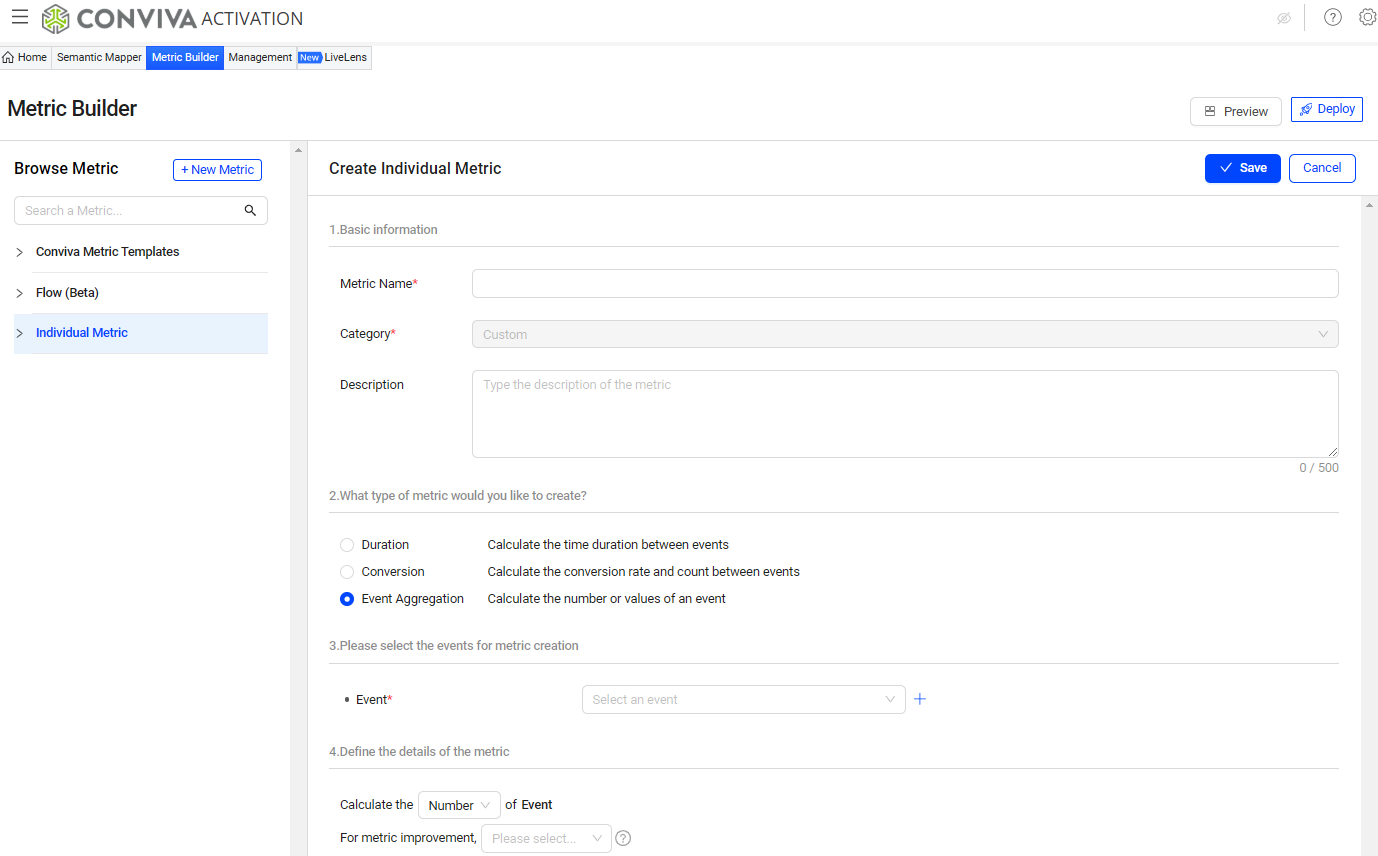
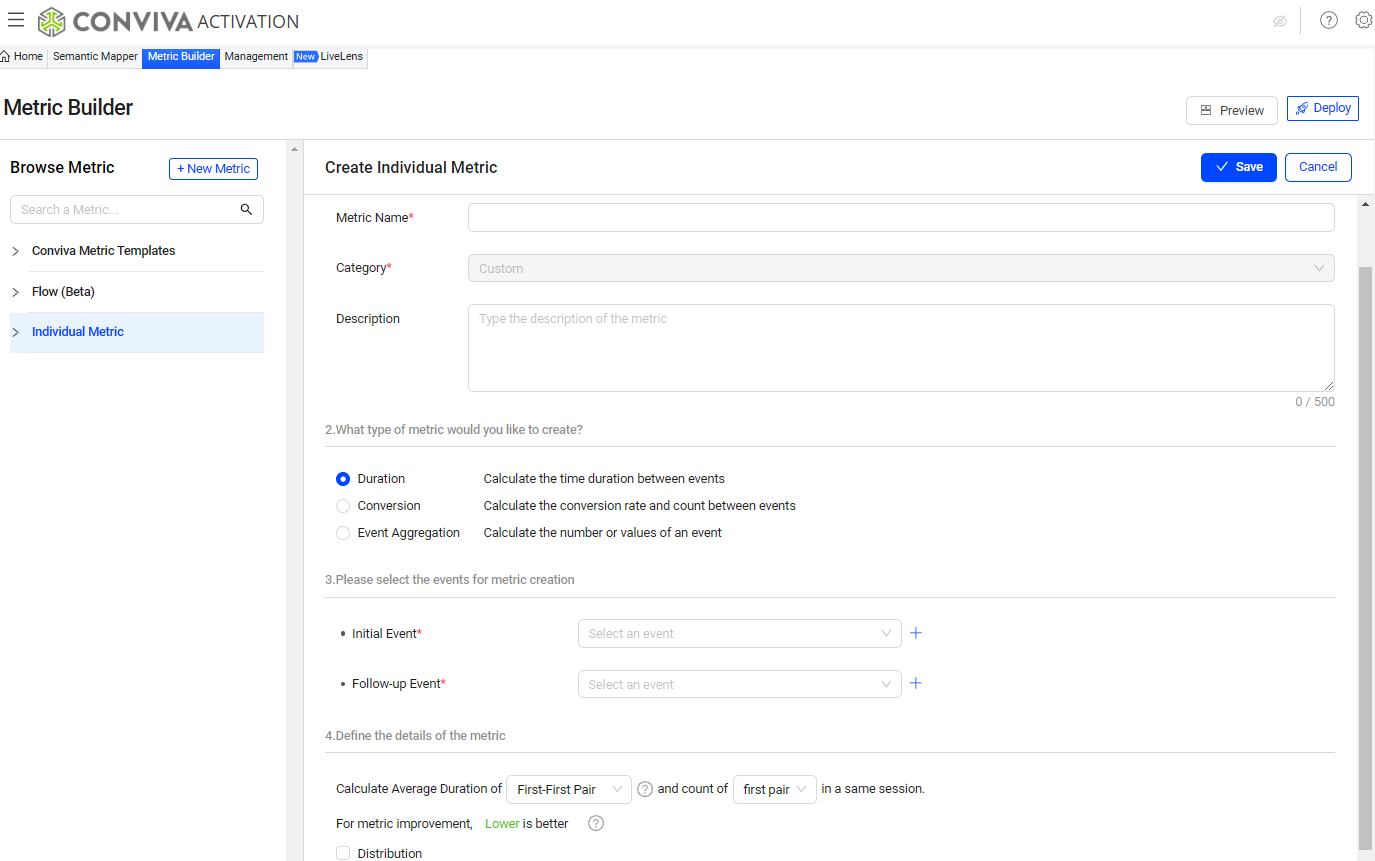
Custom metrics are associated with initial and follow up events. DPI enables three types of custom metrics--Duration Metrics that measure the time interval between two events, Conversion Metrics that measure the count or conversion rates of events from one stage to another, and Event Aggregation Metrics that measure the number of events or calculate the value of event attributes. For more details, see Metric Builder. Create custom metrics using Metric Builder from the DPI Activation menu. |
|
D
_________________________________________________________________________________
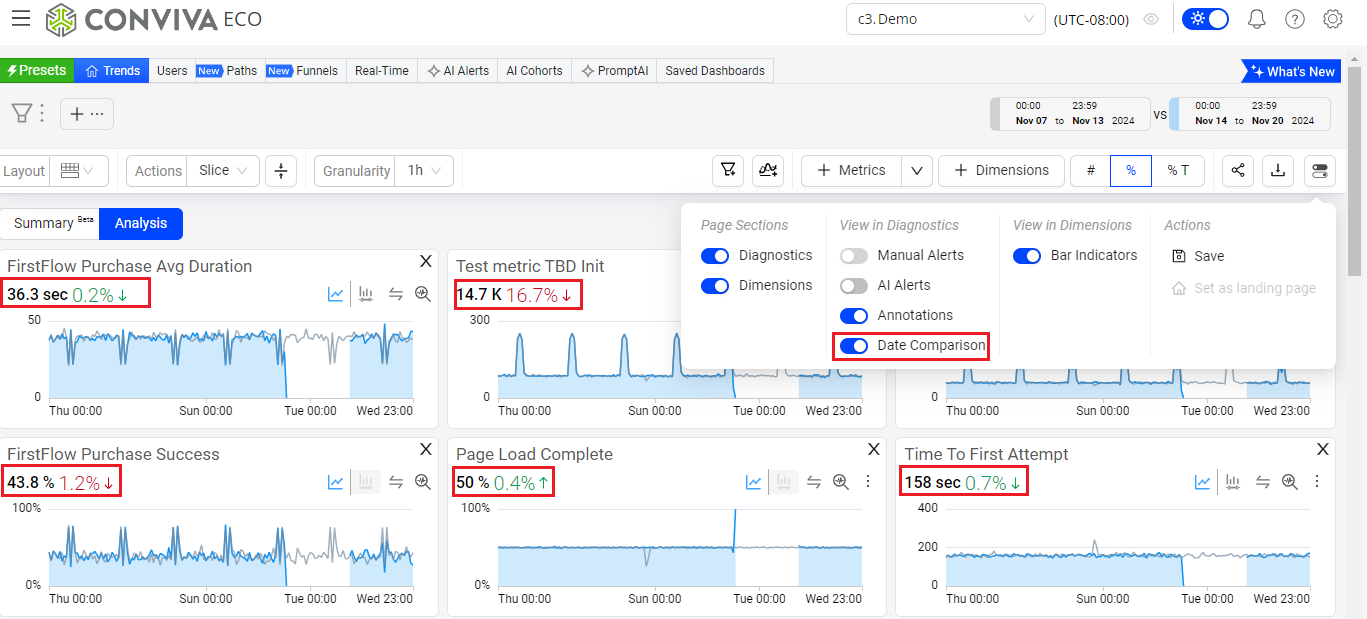
Date Comparison
|
A Trends option for displaying comparative percentages next to metric time series values for quick analysis of changes between past and current periods. For more details, see Date Comparison. Access Date Comparison in the Trends Options menu. |
|
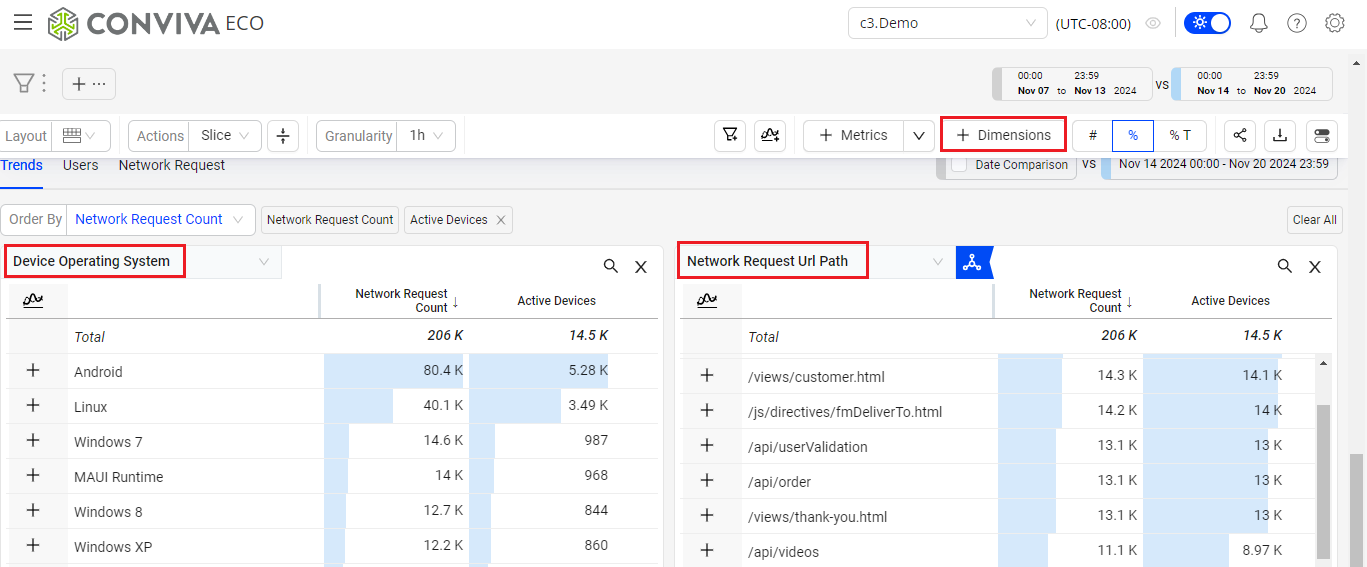
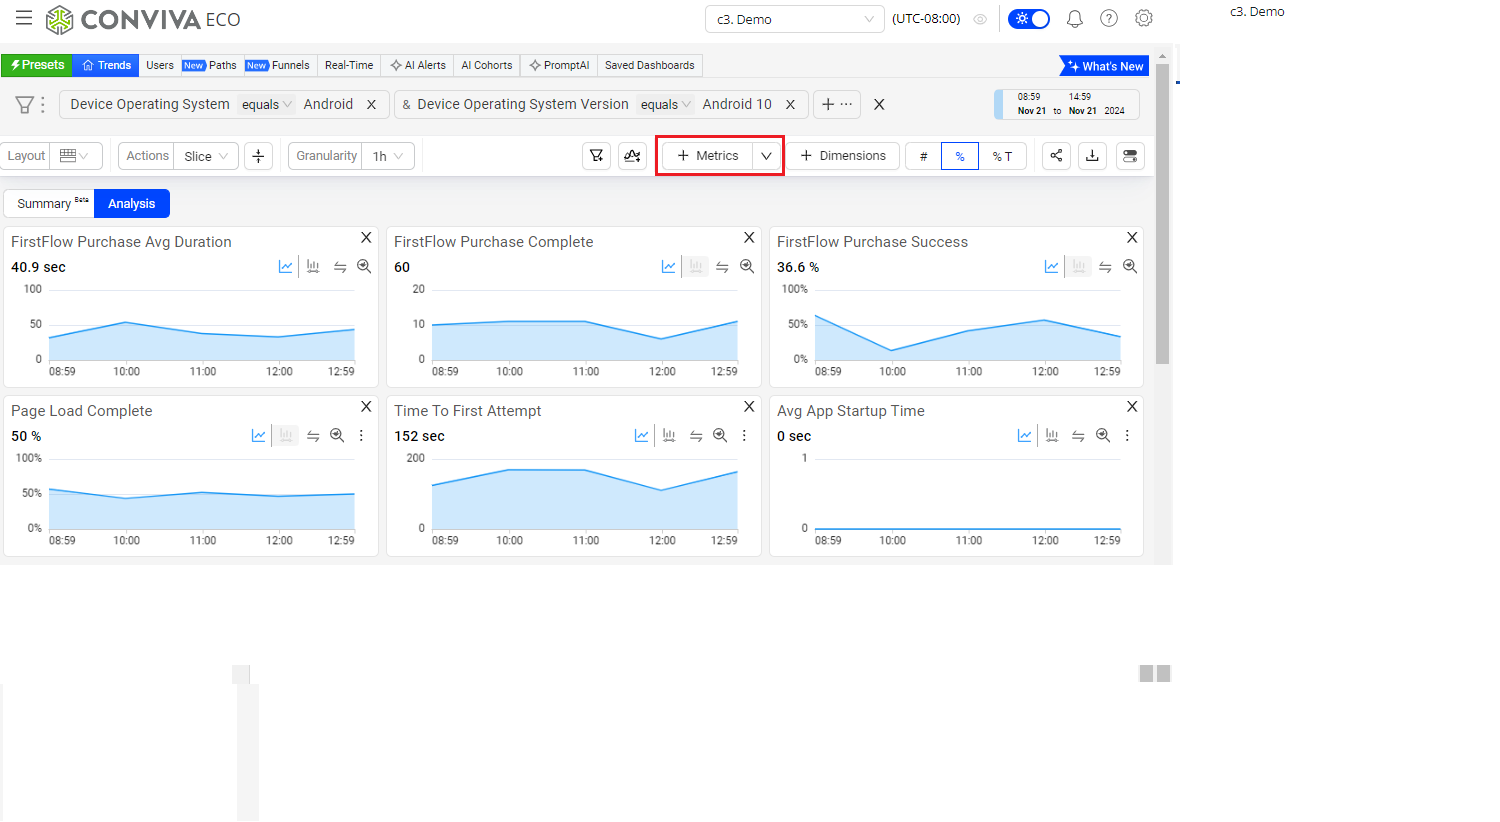
Dimensions
|
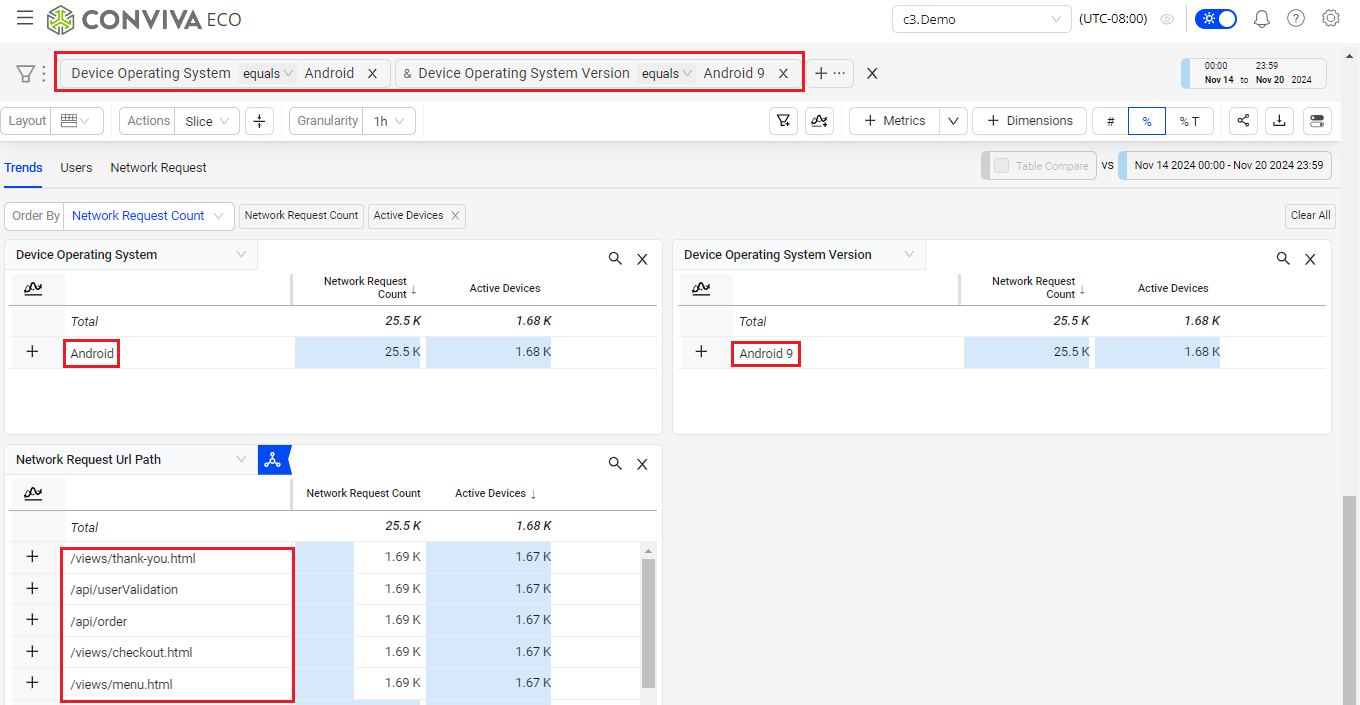
Categories of metadata used for analysis of metrics and performance data across dimensional entities, such as Linux, Android, macOS entities in the Device Operating System dimension and views/menu.html, views/checkout.html entities in the Network Request URL Path dimension. Clicking dimension entities in Trends enables instant filtering for cross-dimensional drill-down analysis. For more details, see Metric Builder. Add and remove dimensions using the Dimensions button in the Trends Tool Bar. Build custom dimensions using Metric Builder in the DPI Activation menu. |
|
Drill-downs
|
A key feature of Trends and other instances of dimension tablesin which data filter in metric time series and distributions is combined with cross-dimensional selection to narrow the scope and impact of experience issues. For more details, see Trends. Perform drill-downs in Trends dimension tables. |
|
Duration Metrics
|
A type of DPI Custom metric associated with initial and follow up events that measures the time interval between two events, such as the duration between the login screen event and the login success event. For more details, see Metric Builder. Create duration metrics using Metric Builder from the DPI Activation menu. See also: Custom Metrics. |
|
E
_________________________________________________________________________________
Email Subscriptions
|
Enables configuration and update of AI alert email notifications by metric and severity level. Setting these notification levels can filter AI alert notifications based on only the most urgent metrics and severities. For more details, see Email Subscriptions. Access Email Subscriptions from the DPI Settings icon in the Main Tool Bar. |
Event Tags
|
Used for the specific action of a given event that applies to only that single event instance. Especially useful for payment analysis with specific event values for tracking of each payment transaction. Example Event-Specific Tags: Order_ID, Revenue_Amount, Currency, Payment_Method For more details, see Event-Specific Tag and Global Tag. |
Event Management, Blocking/Unblocking
|
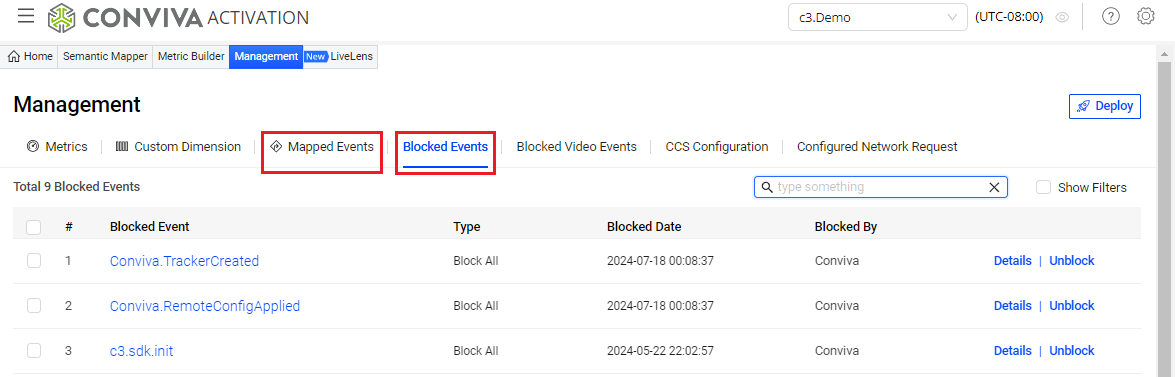
Manage event ingestion to optimize your data model and customize the events available for metrics. This optimization includes managing event ingestion, reviewing mapped and blocked events, and deploying/undeploying specific events to support your app performance monitoring. For more details, see Event Management. Access event management from the DPI Activation menu. |
|
Event Mapping
|
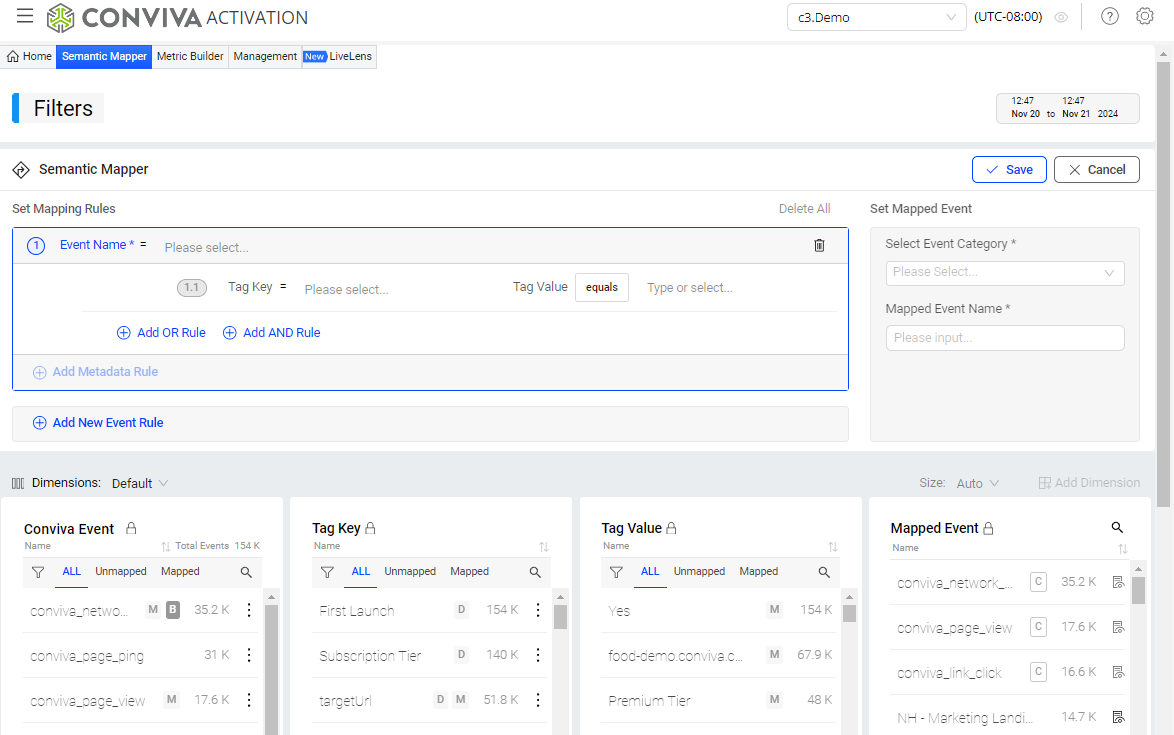
After event ingest, use Semantic Mapper to assign raw events to clearly identifiable events associated with application behaviors, block unnecessary events from the sensor, create custom dimensions with values extracted from events, and semanticize page/screen titles. For example, map raw events to tag key/values, such as the screen_view raw event with tag key screen_name and tag value login_page, to build meaningful specific events for mobile app activity metrics, and create custom dimensions to track user types or device categories. Use mapped events to build custom metrics and flows. For more details, see Event Mapping. Access event mapping from the DPI Activation menu. |
|
F
_________________________________________________________________________________
Filters
|
Focus the displayed data to spotlight critical performance areas, such as geo locations, app player versions, and low-performing assets. Use instant-filters for quick cross-dimensional analysis, secondary filters to overlay an additional filter layer on top of the main filter-derived data, and advanced Filter Builder for complex selections. For more details, see Trends Filter Bar and Filter Management. Launch filters from the Trends Filter icon in the Tool Bar, or inline from the Trends Filter Bar. Access Filter Management from the DPI Settings icon in the Main Tool Bar. |

|
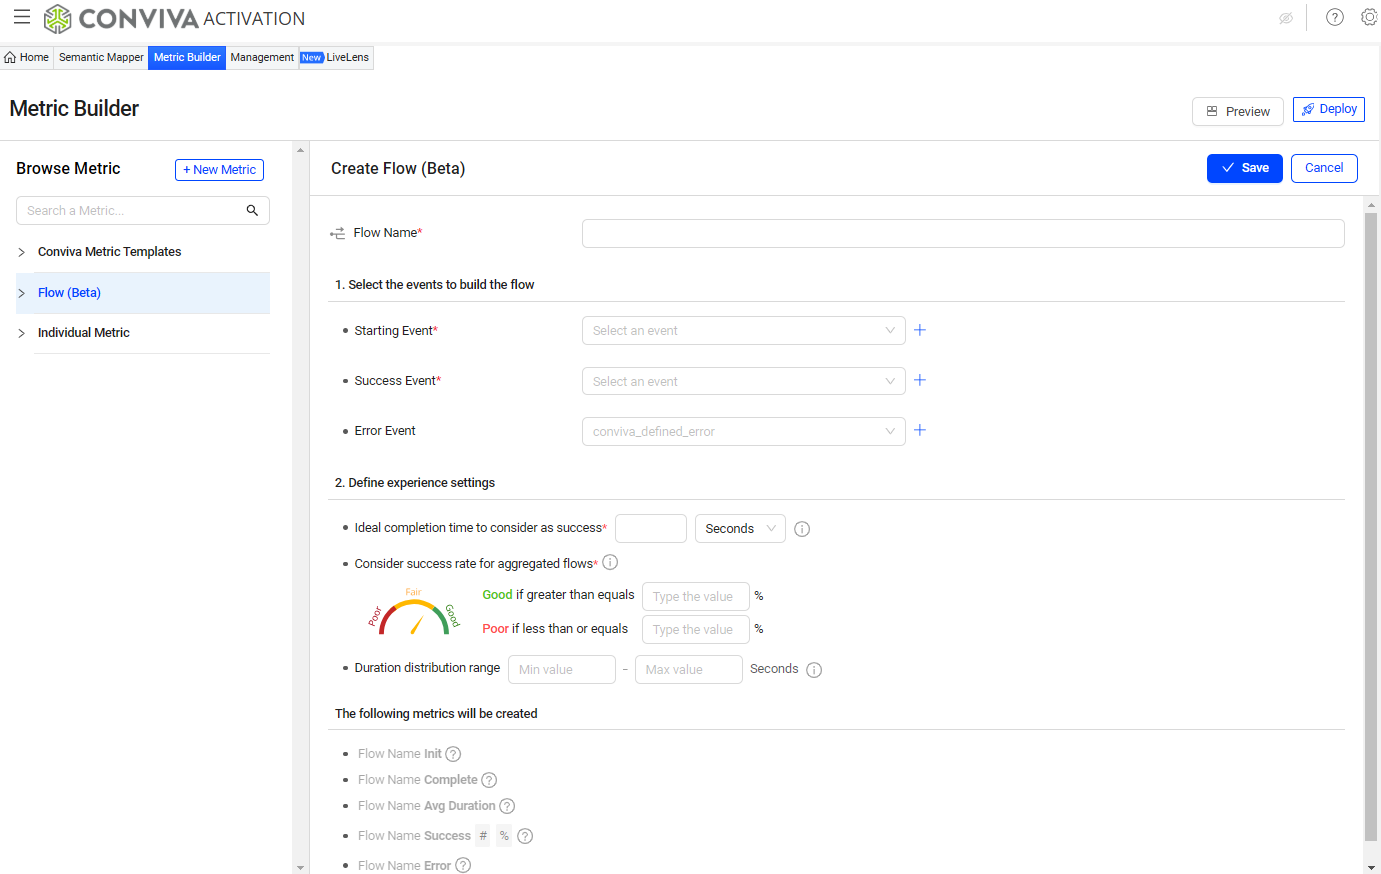
Flows
|
DPI user activities delimited by based start and complete events, along with time constraints, that encompass critical user actions within an application. Example flows critical to E-commerce applications include login start to login completion, checkout start to payment completion, and item search to item add to cart. DPI auto-generates flow metrics for flow start, flow completion, flow success, average flow duration, flow errors. For more details, see Flows. Launch Flows from the DPI Activation menu. |
|
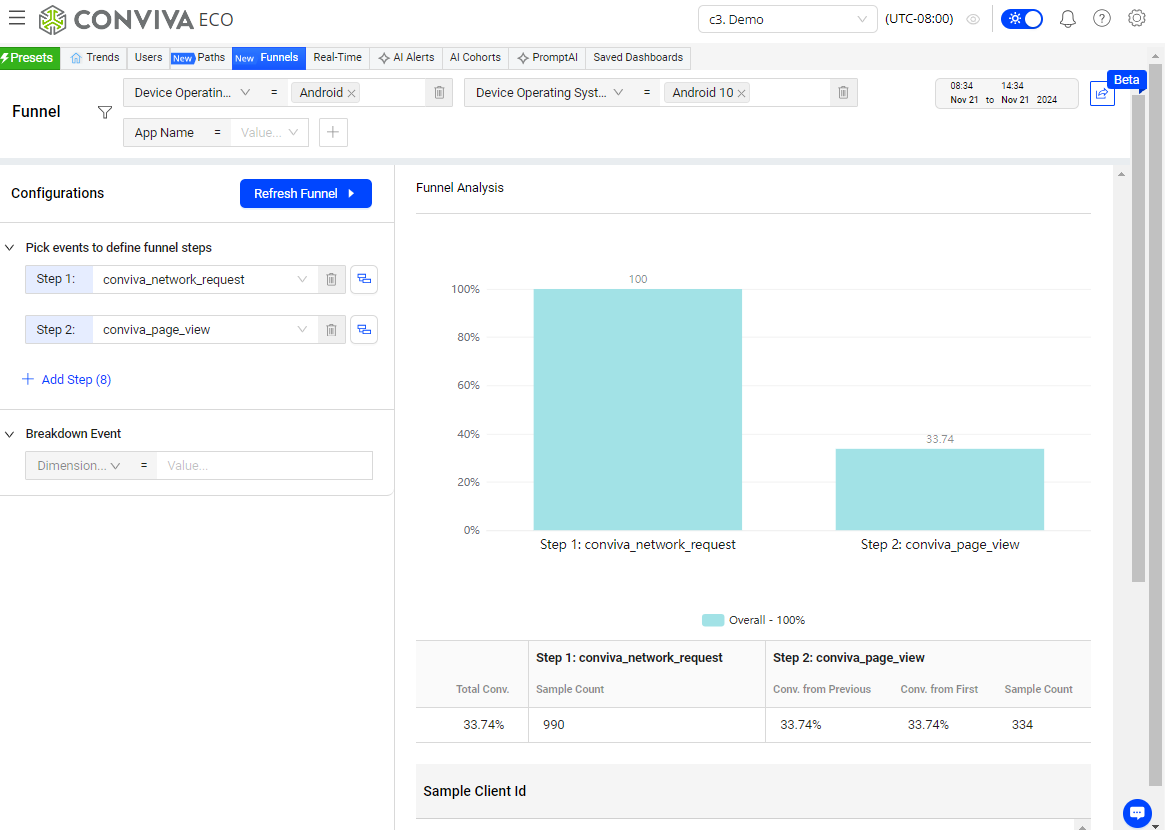
Funnels
|
With Funnel charts, display visual tracking of app event conversion rates based on key event progress across selected dimensions, such as the rate of users starting login process to successful completing login, helping provide insights into event conversion rates and potential issue identification. For more details, see Funnels. Launch Funnels from the DPI menu bar. |
|
G
_________________________________________________________________________________
Global Tag
|
Commonly used for user-level or contextual data whose value remains the same across the current session and applies to all future events until updated or cleared by the session or Flow instance. Example Global User-level Tags: First_Visit_Date, User_ID, Acquired_Channel, Customer_Segment, Campaign_Source Example Contextual Tags: Page_Type, Page_Title, cust_Device_OS, cust_App_Name For more details, see Event-Specific Tag and Global Tag. |
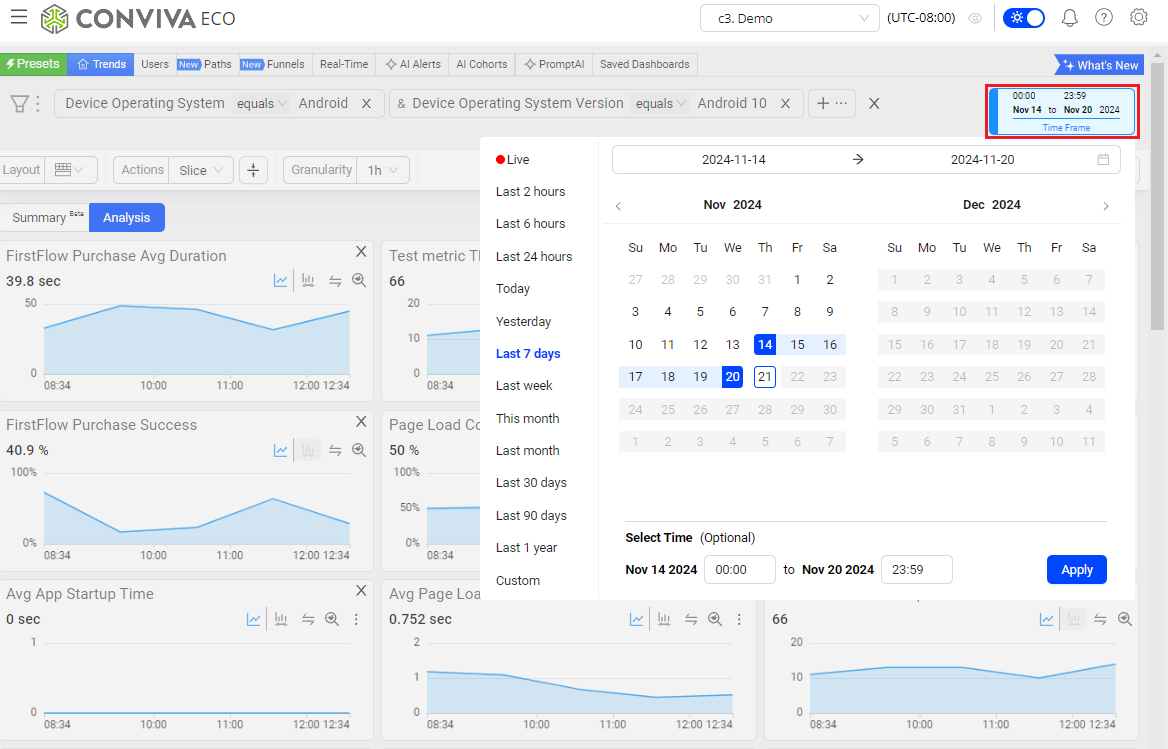
Granularity
|
In data displays, DPI supports a wide-range of data display options, typically:
For more details, see Time settings. Access Time settings in the Time Picker. |
|
L
_________________________________________________________________________________
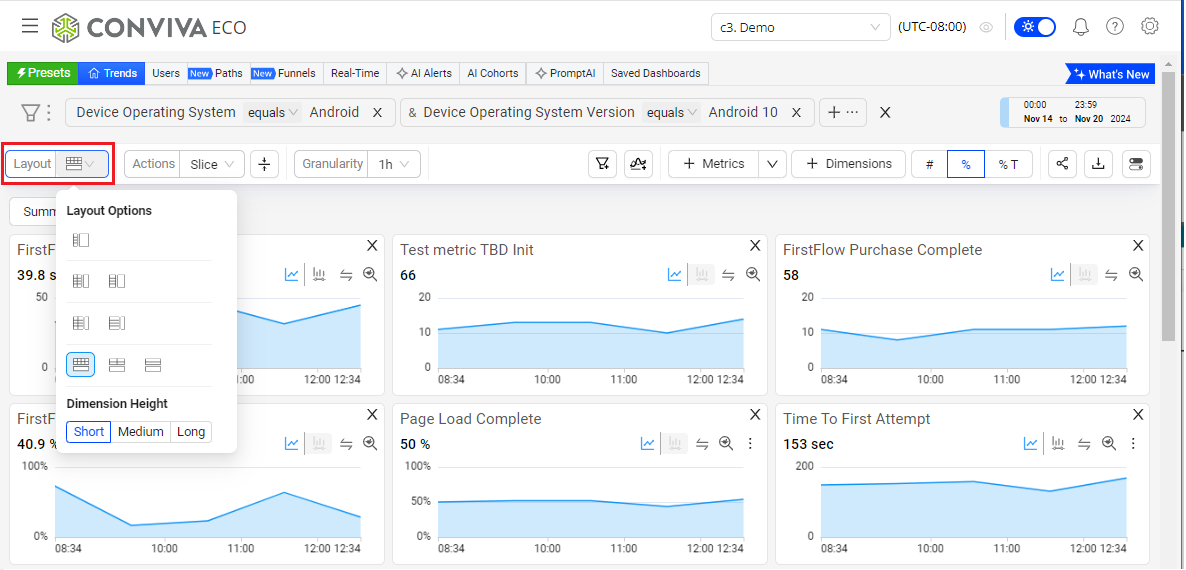
Layout Options
|
Flexible display options in Trends with different positioning options for metric widgets and dimension tables, allowing customized data display to align data with your analytic preferences. Layout options include:
For more details, see Layout Options. Access the Layout Options from the Layout Menu in the Trends Menu Bar. |
|
LiveLens
|
An in-app DPI tool for efficiently exploring up to 5 mins of application events based on application actions to monitor the event flows (initial and follow up events) for efficient and accurate metric creation. For example, setting up LiveLens and performing an app login displays the raw events that occur during web application login, such as authentication API calls, login button clicks, or success tokens. Using Semantic Mapper, these raw events can then be mapped to create metrics for monitoring login duration. For more details, see LiveLens. Launch LiveLens from the DPI Activation page and when building metrics. |
|
M
_________________________________________________________________________________
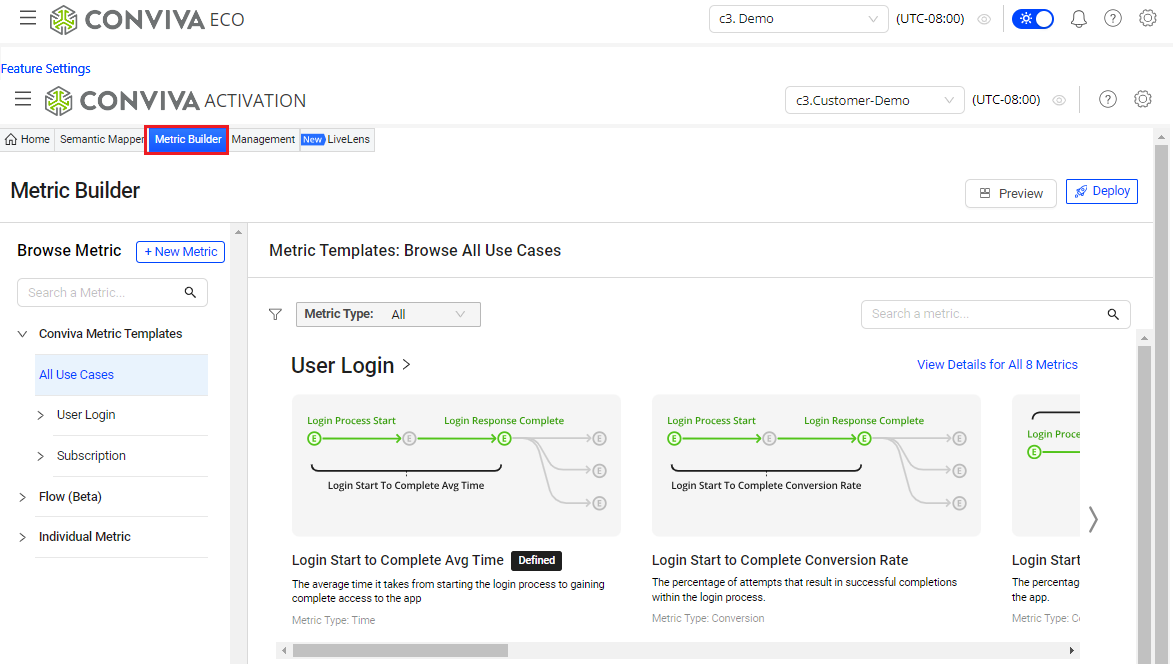
Metric Builder
|
The DPI tool for building metrics as either flow metrics associated with specific start and success events within user journeys or custom metrics based on specified initial/follow-up events. Based on mapped events, Metric Builder enables metric building to analyze data for complex user actions and app performance scenarios, such as analyzing the amount of time spent between viewer login and the start of video playtime and the success rate of cart uploads to completed purchase. For more details, see Metric Builder. Launch Metric Builder from the DPI Activation page. |
|
Metrics, DPI
|
DPI metrics provide a robust set of metrics to enable application performance monitoring and user behavior analysis across your web and native applications. Metric values appear as time series and distributions in metric widgets, and alongside dimensional values in the dimension drill-down tables. Types of DPI metrics include:
Use DPI metrics for a holistic view of web and mobile app health, performance, and real user experience, unifying real-time performance analysis with user journey optimization. DPI performance and user experience metrics enable Service Level Indicators (SLIs), such as engagement metrics, QoE and KPI metrics, and service performance metrics, along with defined Service Level Objectives (SLOs) for critical user journey success rates. User timelines record user interactions for detailed activity summaries and deep understanding of how application performance and network service health impacted user experience. Display metrics in Trends time series widgets and dimension table using the Metrics button in the Trends Menu Bar. |
|
MyProfile
|
Configure personal information, notification and subscription perferences, and annotation visibility, along with viewing your device and application access. For more details, see My Profile. Access My Profile from the DPI Settings icon in the Main Tool Bar. |

|
N
_________________________________________________________________________________
Network Requests, Impacted
|
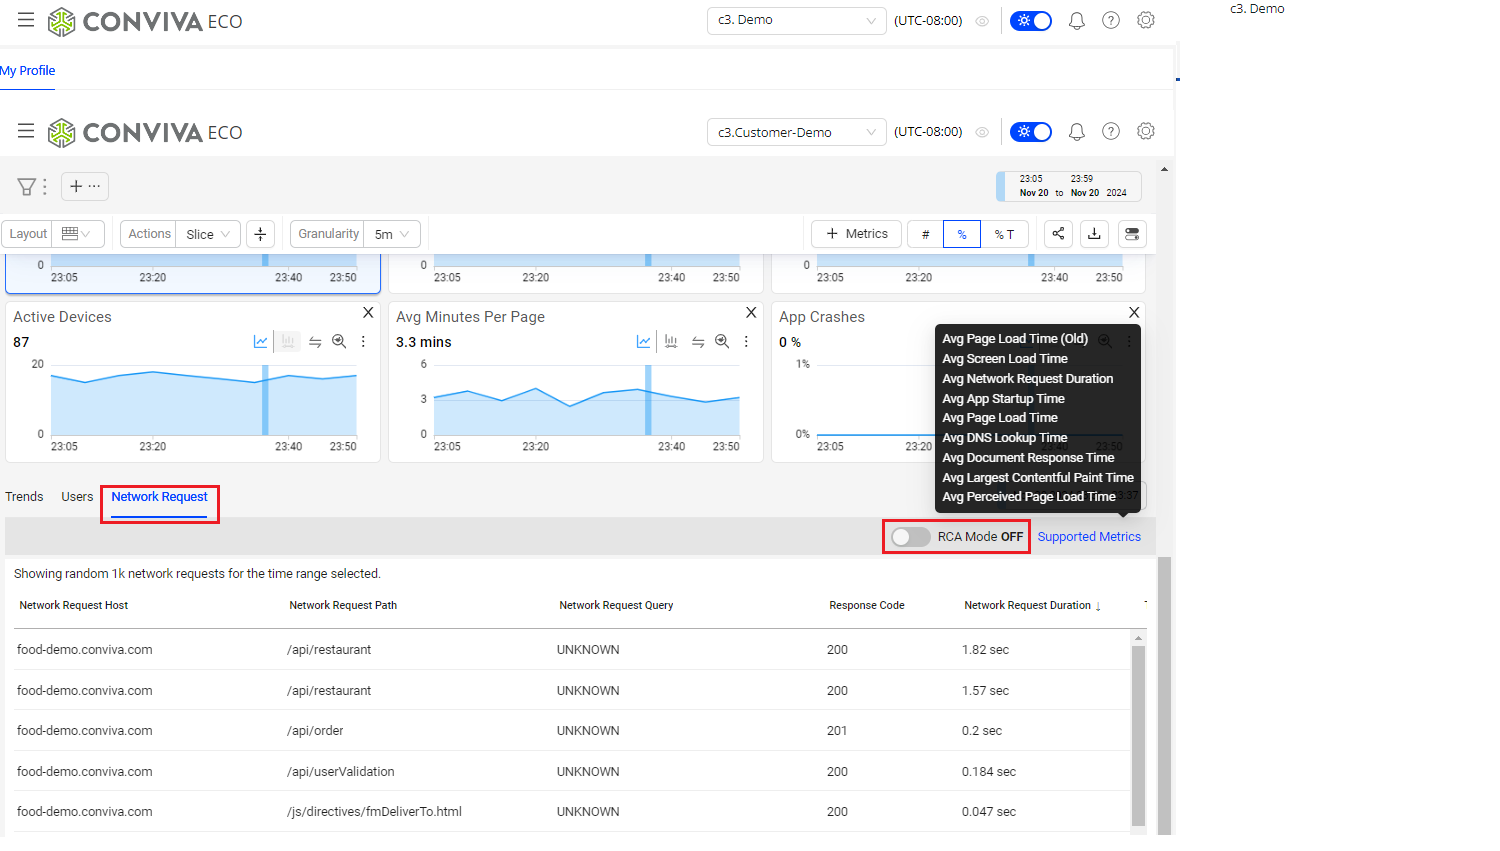
A tab within Trends Analysis that lists the network requests impacted by the selected performance data. Slicing spikes in metric widget time series, or target distribution values narrows the network request list to those impacted by the performance issue. Clicking request data, such as host, path, or query, filters the displayed metric time series and other data for further analysis. For more details, see Network Requests Tab. Access the Network Requests tab in Trends from the DPI Menu and DPI Menu Bar. |
|
P
_________________________________________________________________________________
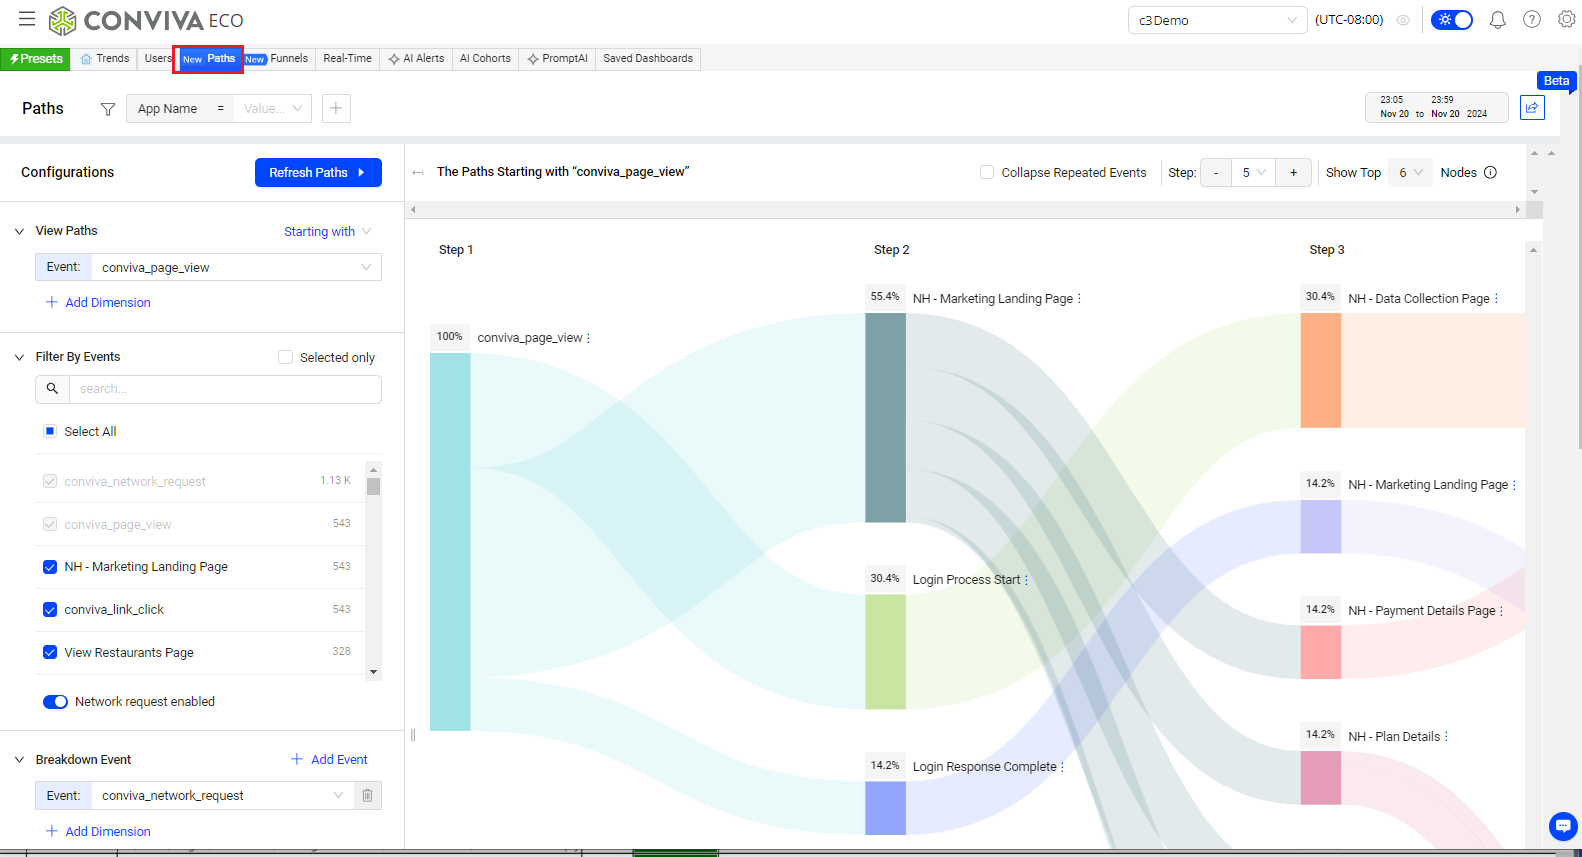
Paths
|
With Path charts, understand the sequence of app events and the composition of event flows, helping gain insights for metric creation and potential issue identification. For more details, see Paths. Launch Paths from the DPI menu bar. |
|
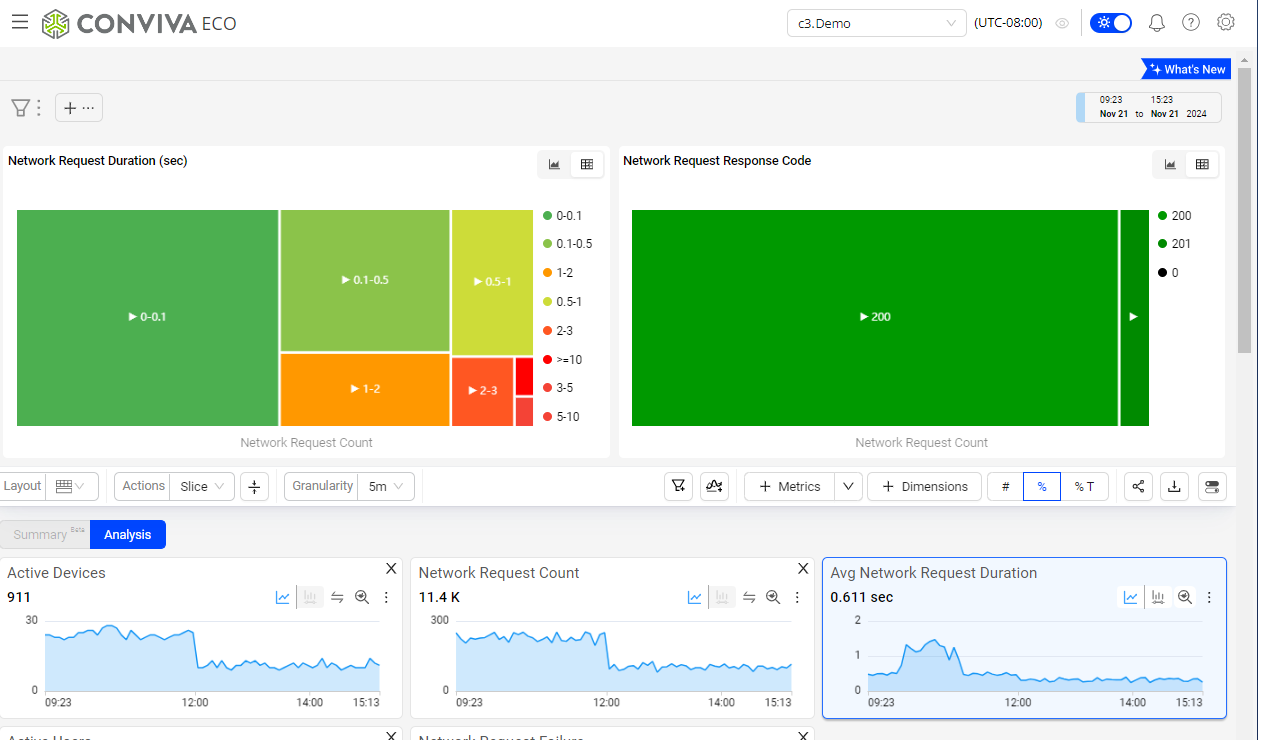
Presets
|
Pre-defined dashboards with targeted metrics and dimensions to facilitate getting started with key DPI features, such as user experience analysis, service performance monitoring (shown) and root cause analysis, and event tracking. For more details, see Presets. Launch Presets from the DPI menu bar. |
|
R
_________________________________________________________________________________
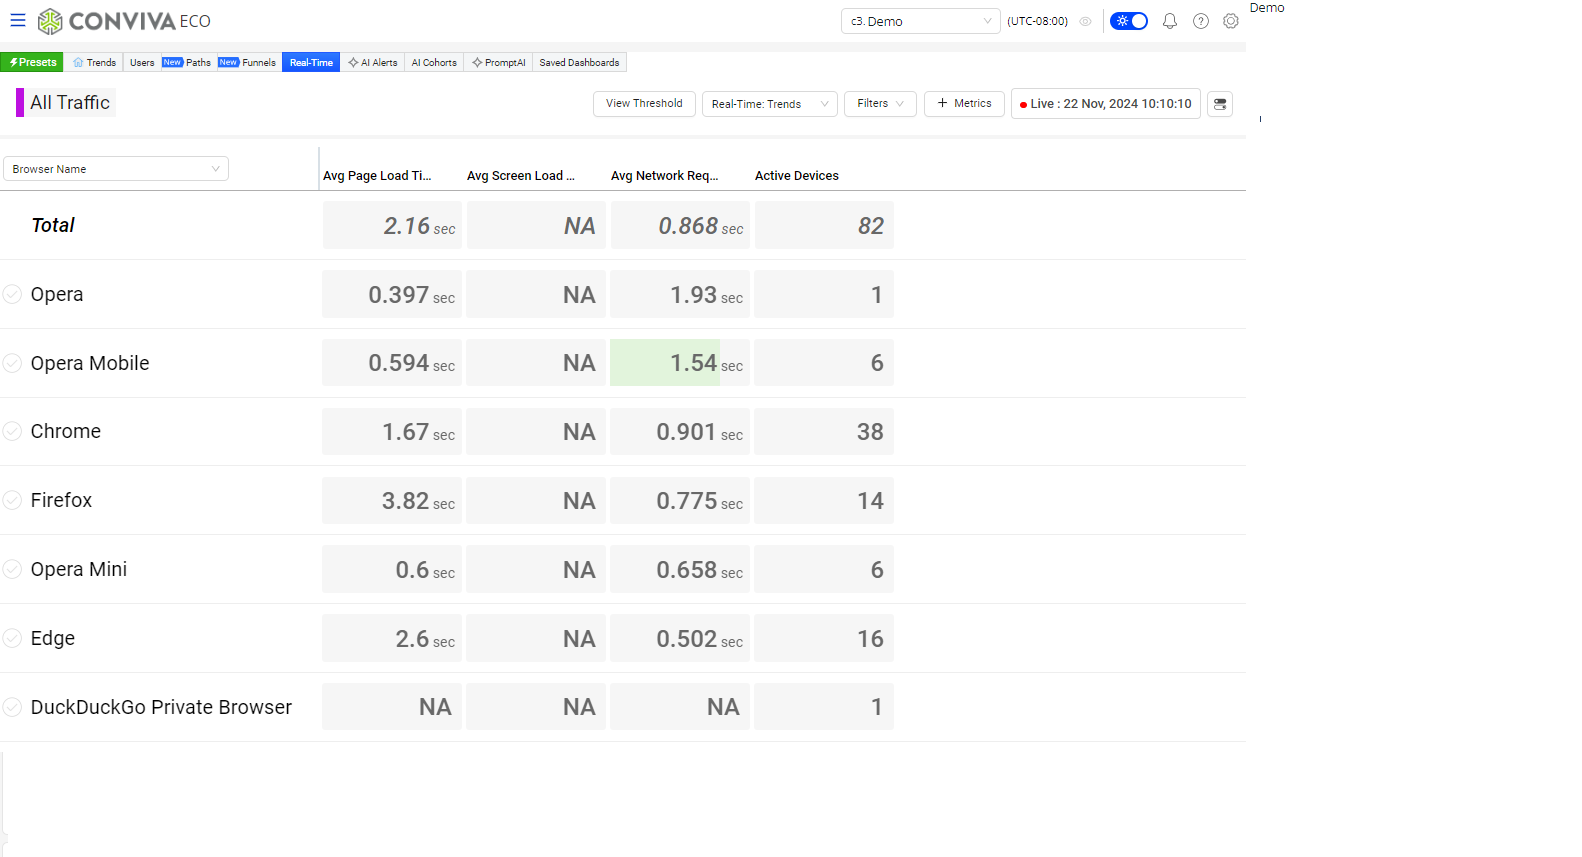
Real-Time
|
In Trends and Real-Time displays, quickly analyze and drill down to identify real-time issues that negatively impact experience and engagement metrics, with full context for deep root cause analysis. Set performance and engagement thresholds to get customized visual threshold-crossing notifications when real-time user experience is impacted. For more details, see Real-Time Dashboard. Launch the Real-Time dashboard from the DPI menu and DPI menu bar. |
|
Root Cause, Auto-detect Network Request
|
In the Trends Network Request tab, RCA mode enables easy detection and quick analysis of network response root causes within up to 24-hour periods. The Root Cause Hypothesis table displays the network API calls with the longest durations among the sessions. This mode also displays other analysis data related to the API calls such as network request count and active devices percentages. The RCA mode is enabled only when using one of the supported metrics as a secondary filter (slicing the metric distribution), including Avg App Startup Time, Avg Network Request Duration, Avg Screen Load Time, and Avg Page Load Time. For more details, see Network Requests. Access Network Requests from the Network Request tab in the Trends dimension table. |
|
S
_________________________________________________________________________________
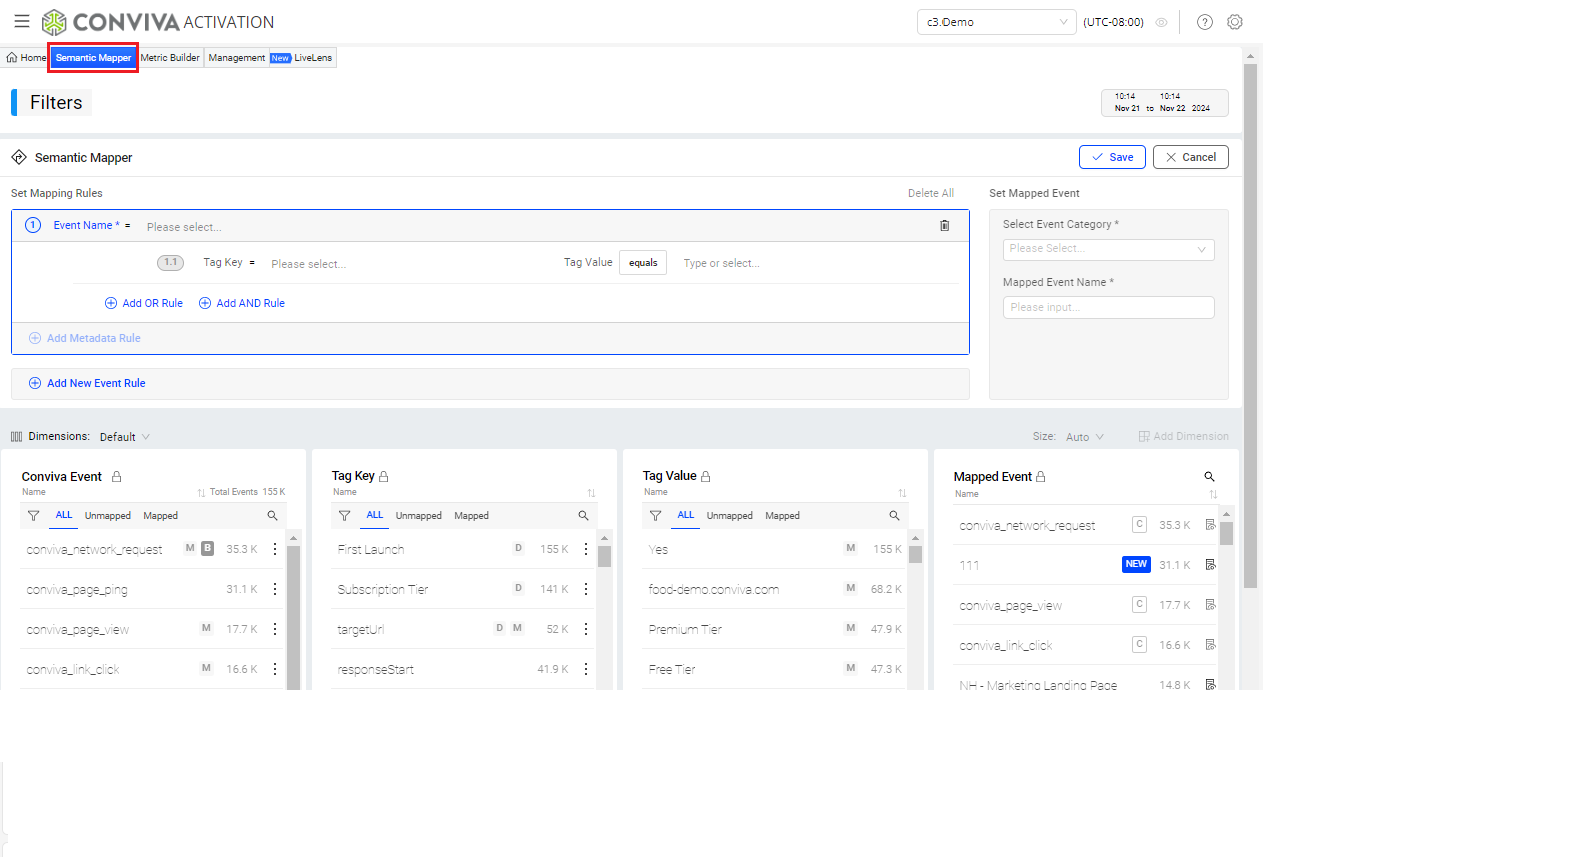
Semantic Mapper
|
Prior to building events, Semantic Mapper enables raw event mapping--turning raw events into mapped events based on selected tag keys and tag values or using quick mappings based on event category and name. Semantic Mapper also enable blocking unneeded events and creating new custom dimensions. For more details, see Semantic Mapper. Access Semantic Mapper using Metric Builder from the DPI Activation menu. |
|
Sensor, GitHub Links
|
Lightweight integration of Conviva DPI sensor enables automatic, semantic-less data collection. DPI sensor module consists of several basic scripts accessible from the Conviva GitHub Repositories with basic README instructions and the related script files for each the supported DPI application platforms.
Reach out to your technical dev team to coordinate the integration of the Conviva sensor. Most integrations complete within several developer hours using the README page instructions in the repositories. Download Conviva DPI scripts in Conviva GitHub Repositories. |
-- |
Session
| An DPI session starts when any system or user-defined event is received and ends when the app terminates or after 90 seconds of inactivity (e.g., app backgrounding or no events). A new session is initiated if a new event is received after 90 seconds of inactivity. | -- |
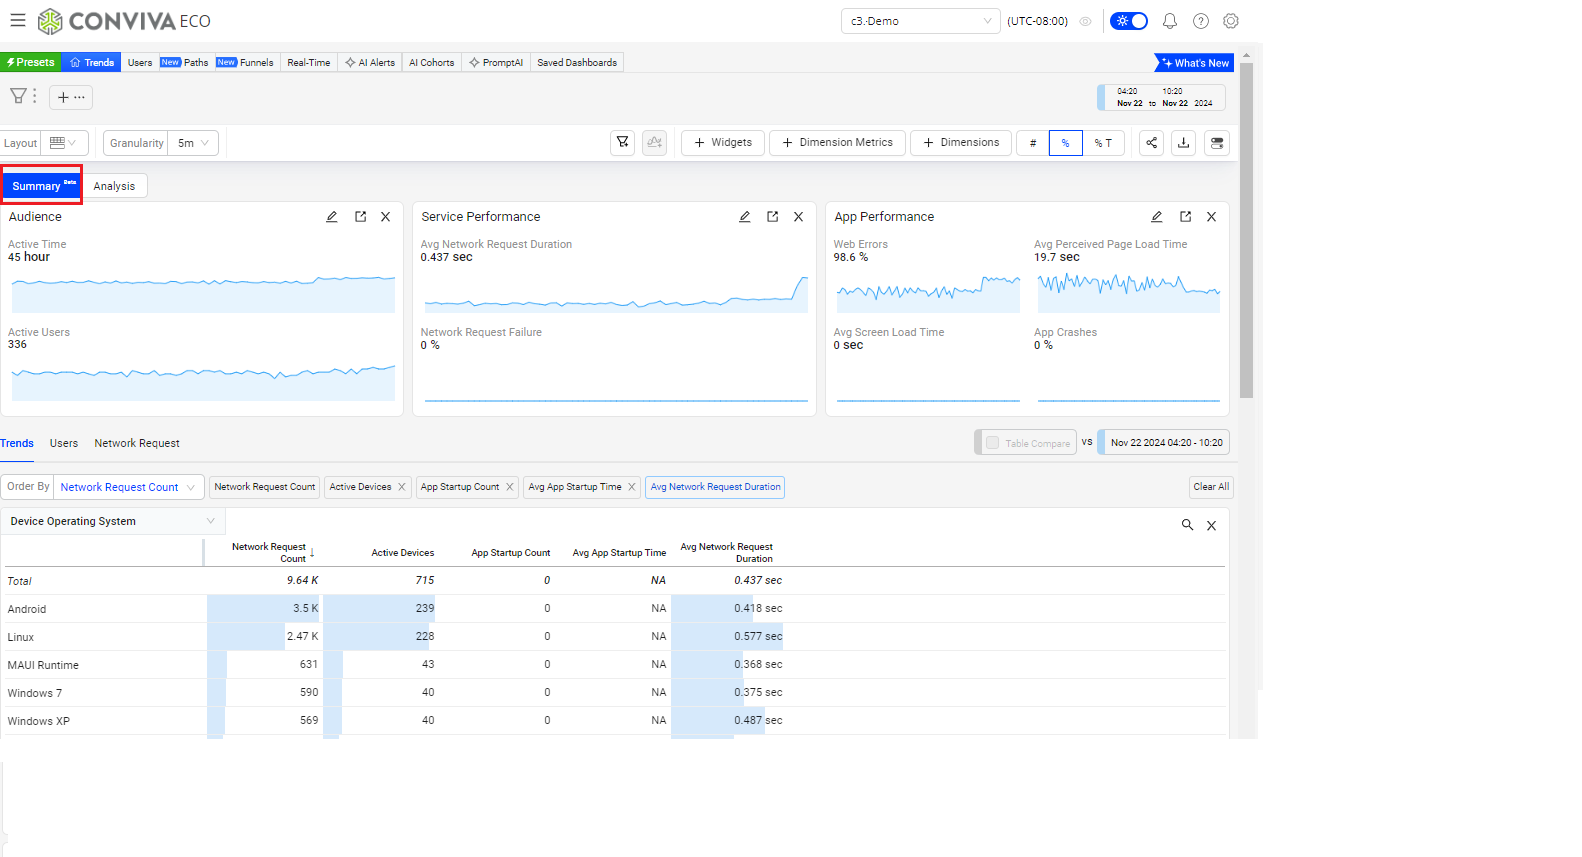
Summary Tab
|
In Trends, one of the main tabs for displaying high-level metric time series and distributions along with dimension tables for targeted drill-down analysis. This tab also contains options for users and network requests analysis. Trends also provides a main Analysis tab focused performance analysis. For more details, see Summary Tab. Access the Summary tab in Trends from the DPI menu and DPI Menu Bar. |
|
T
_________________________________________________________________________________
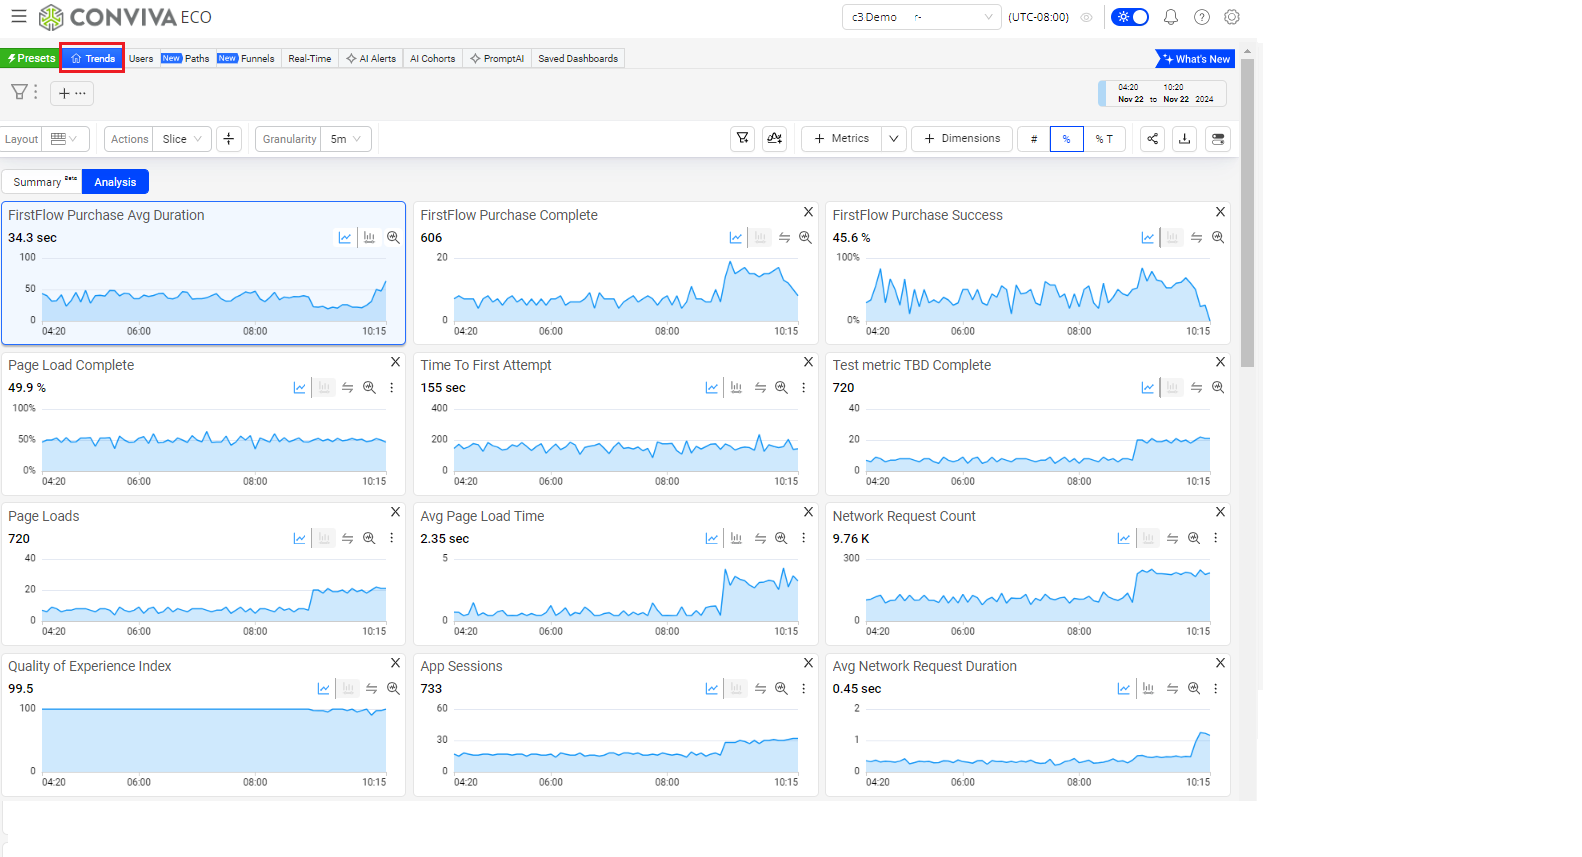
Trends
|
Trends provides metric widgets and dimension tables to quickly analyze real-time and historical experiences of your entire customer base across every dimension, metric, and user session; all in a few clicks. No queries required, no massive compute costs across data warehouses. Also, analyze metric widget time series for visual performance patterns across metrics and time intervals leading to enhanced anomaly detection and actionable insights. For more details, see Trends. Access Trends from the DPI menu and DPI Menu Bar. |
|
U
_________________________________________________________________________________
Usage Dashboard
|
Confirm your account usage with a snapshot of key metrics that are used for billing your Conviva account, such as viewer hours, concurrent plays, plays, and ended plays. Work with your Conviva Customer representative to add or remove metrics as needed to align the page with your Conviva contract. For more details, see Usage Dashboard. Access Usage dashboard from the DPI Settings icon in the Main Tool Bar. |
-- |
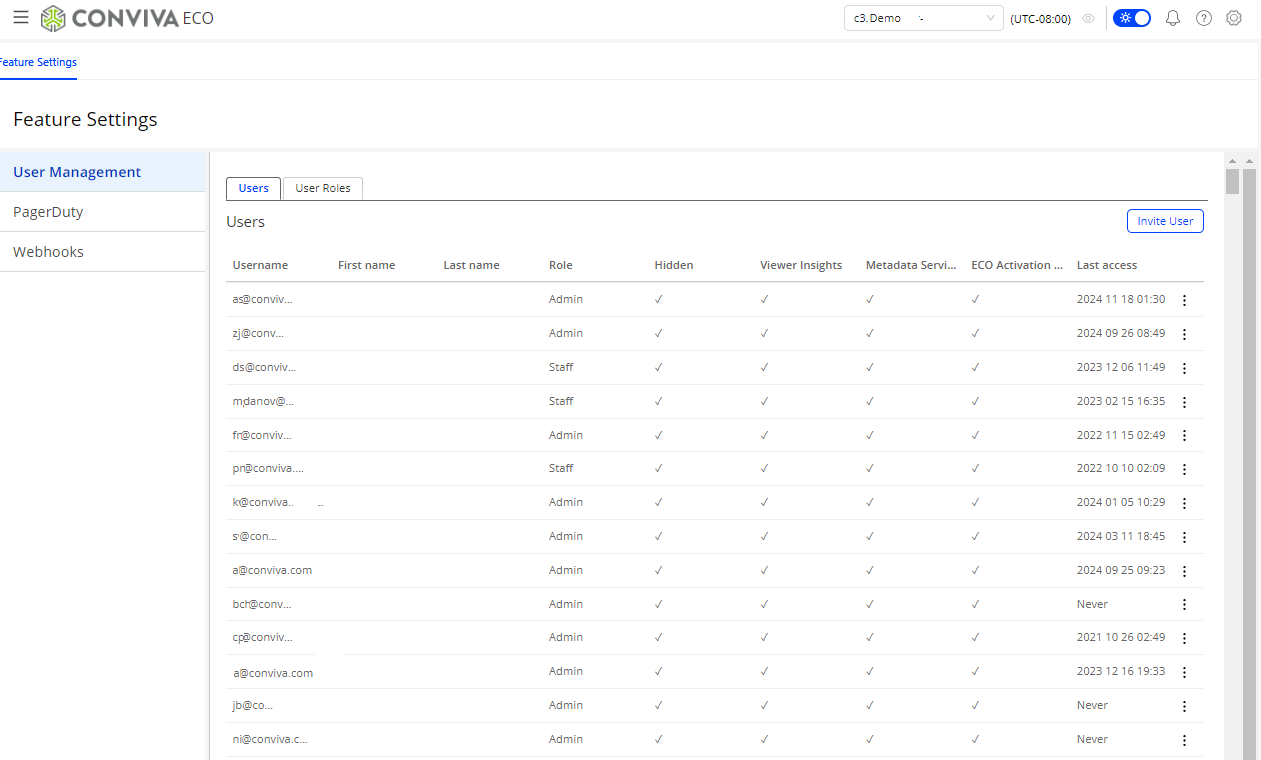
User Management
|
As an Admin, invite new users, manage existing users, and update defined user roles. For more details, see User Management. Access User Management from the DPI Settings icon in the Main Tool Bar. |
|
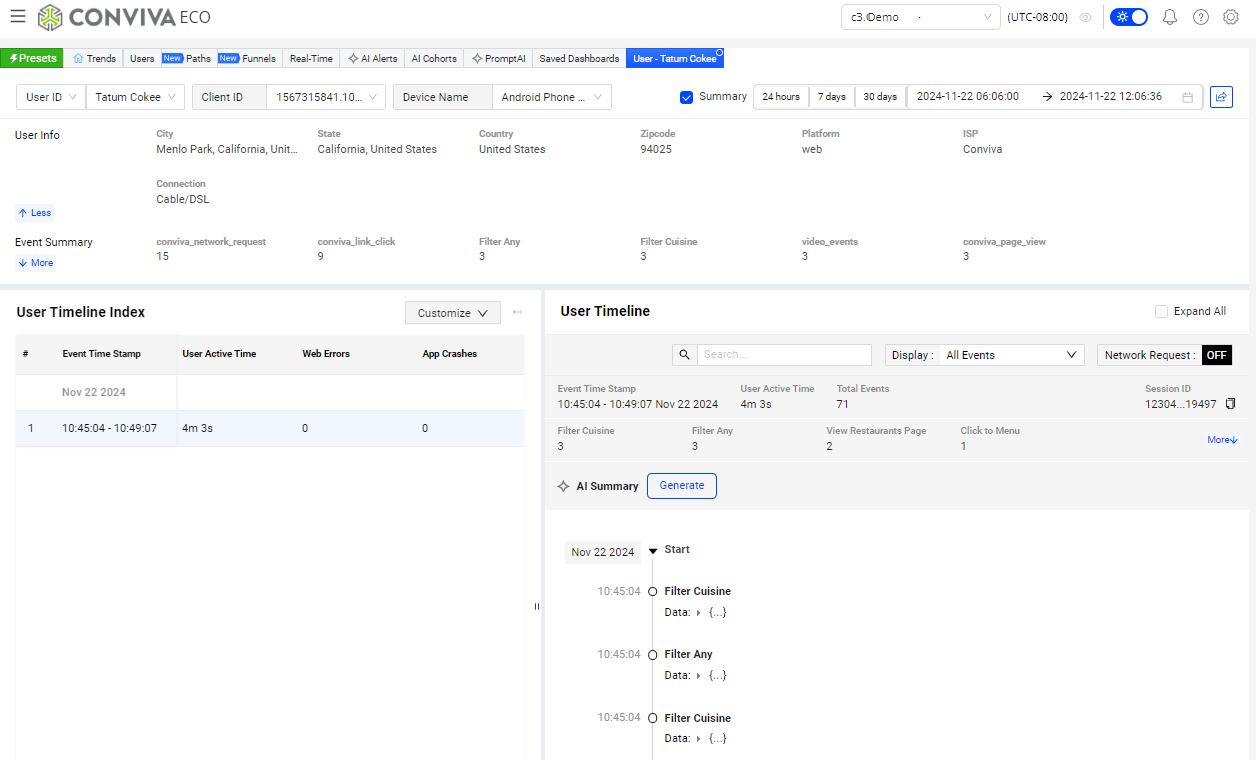
User Timeline and Index
|
Users page displays detailed user timeline data for event and timeline analysis, along with an index of user events. For more details, see Users. Access Users from the DPI menu and DPI Menu Bar. |
|
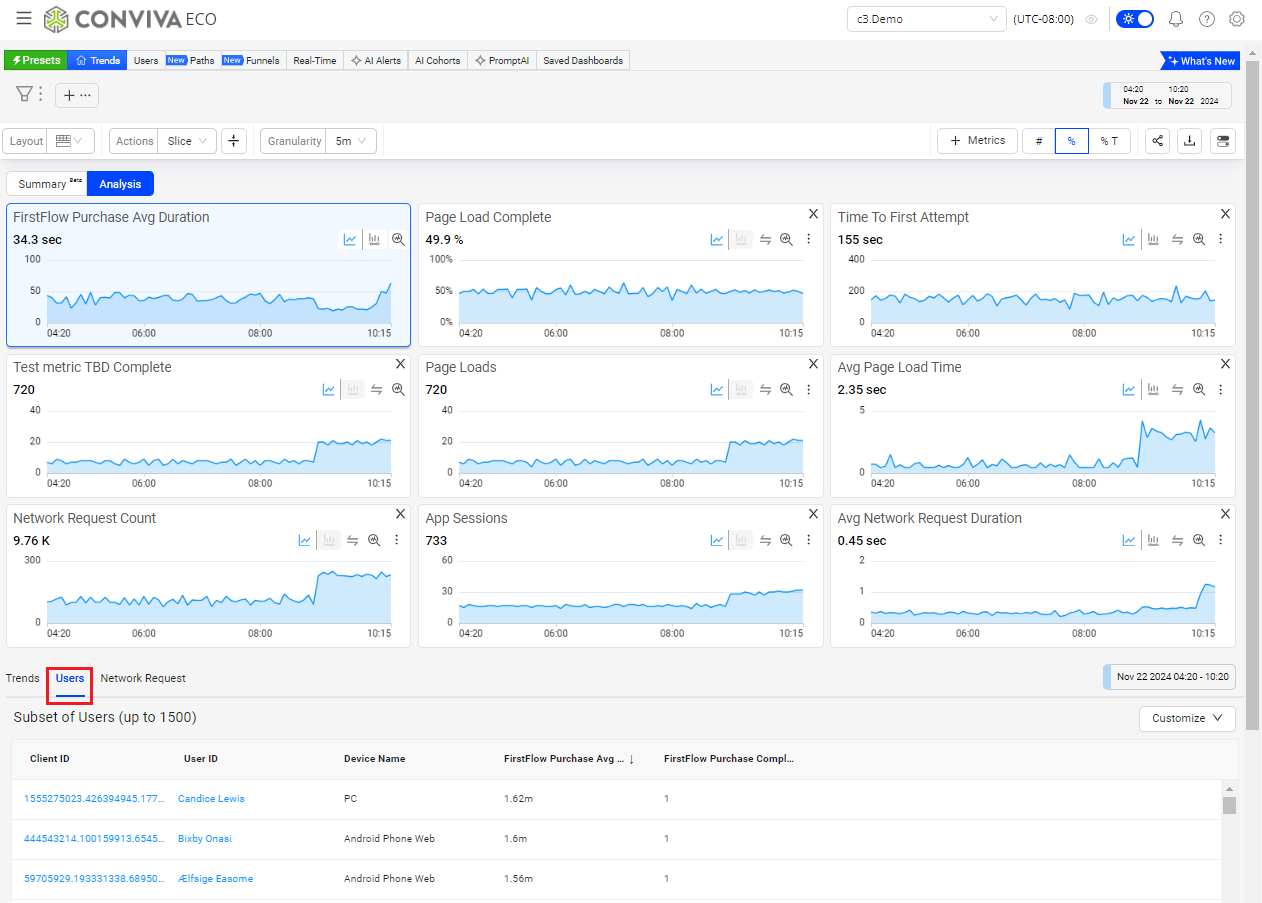
Users, Impacted
|
A tab within Trends Analysis that lists the users impacted by the selected performance data. Slicing spikes in metric widget time series, or target distribution values narrows the user list to those impacted by the performance issue. Clicking a client or user ID opens a new tab with detailed user timeline data for event and timeline analysis. The User Experience Preset also provides select data for user activity and impact analysis. For more details, see Impacted User. Access the Impacted User tab in Trends from the DPI Menu and DPI Menu Bar. |
|
W
_________________________________________________________________________________
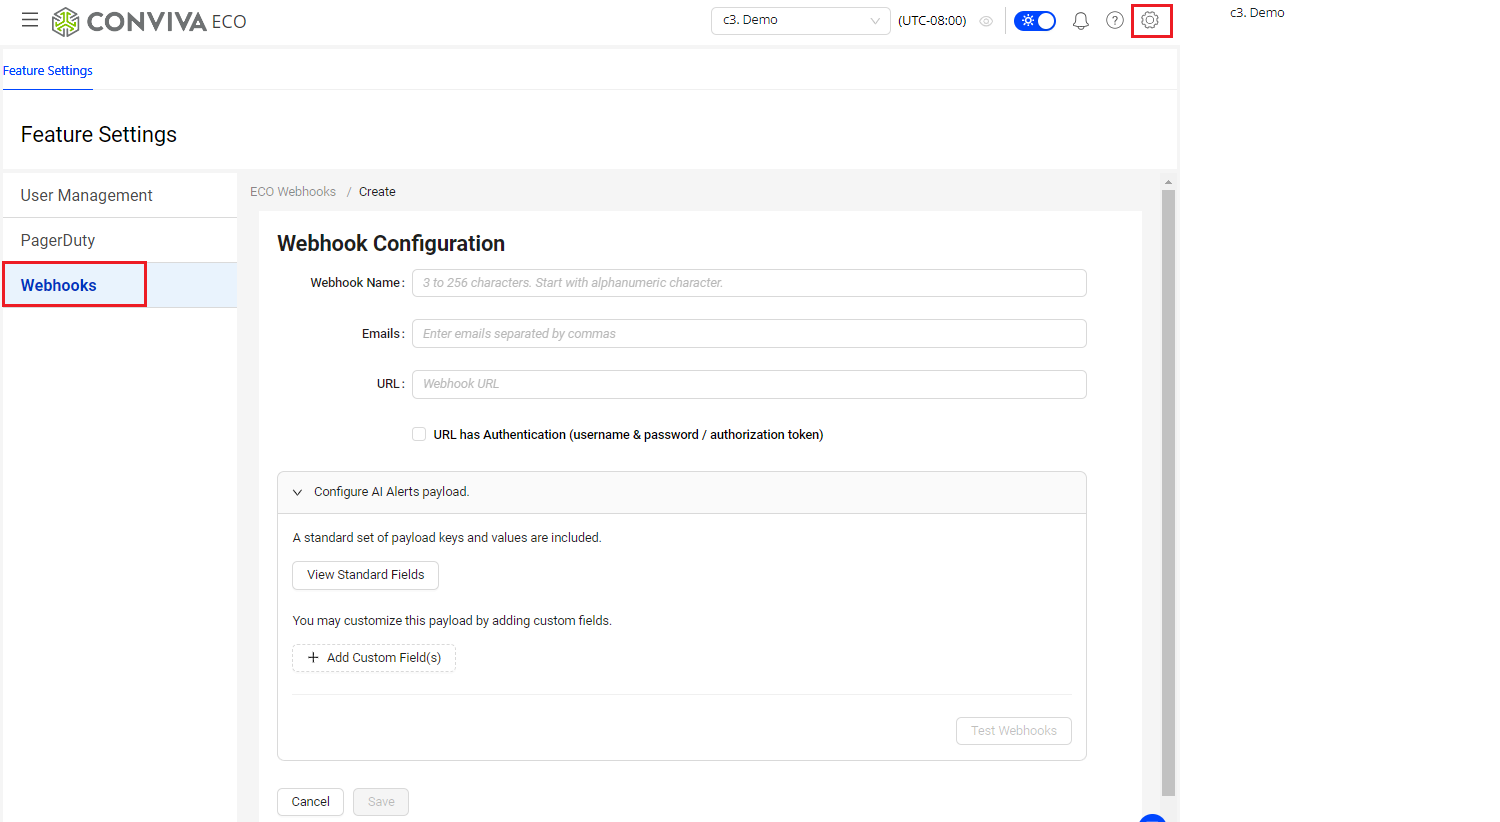
Webhooks
|
A standard event-driven communication tool for sending HTTP data between applications based on source event triggers. Webhooks boost AI alert response times by routing Conviva AI alerts to other alert notification application workflows, such as PagerDuty, to accelerate issue alert collaboration and time to resolution. For more details, see Webhooks. Access Webhooks from the DPI Settings icon in the Main Tool Bar. |
|
Glossary Glossary Terms DPI