The Paths dashboard enables you to create a Paths chart that visualizes the sequential pattern of user events based on a starting event and subsequent filtered events.
The created Paths chart allows you to understand the sequence of events and the composition of events, helping you gain insights for metric creation and potential issue identification.
You can use Conviva events to create a Paths chart that uses Conviva defined events, such as conviva_page_view, conviva_button_click, conviva_application_error, and conviva_link_click, as nodes for detailed user journey insights. For example, to visualize multiple application entry points, use conviva_application_startup as the starting event, along with conviva_screen_view as a filtered event. To learn more about DPI capabilities, see Conviva DPI Overview.
Creating Paths Charts
This section introduces how to create a Paths chart with full functions step by step and uses an example of creating a Paths chart that shows the event sequence after opening the Video application trends page.
-
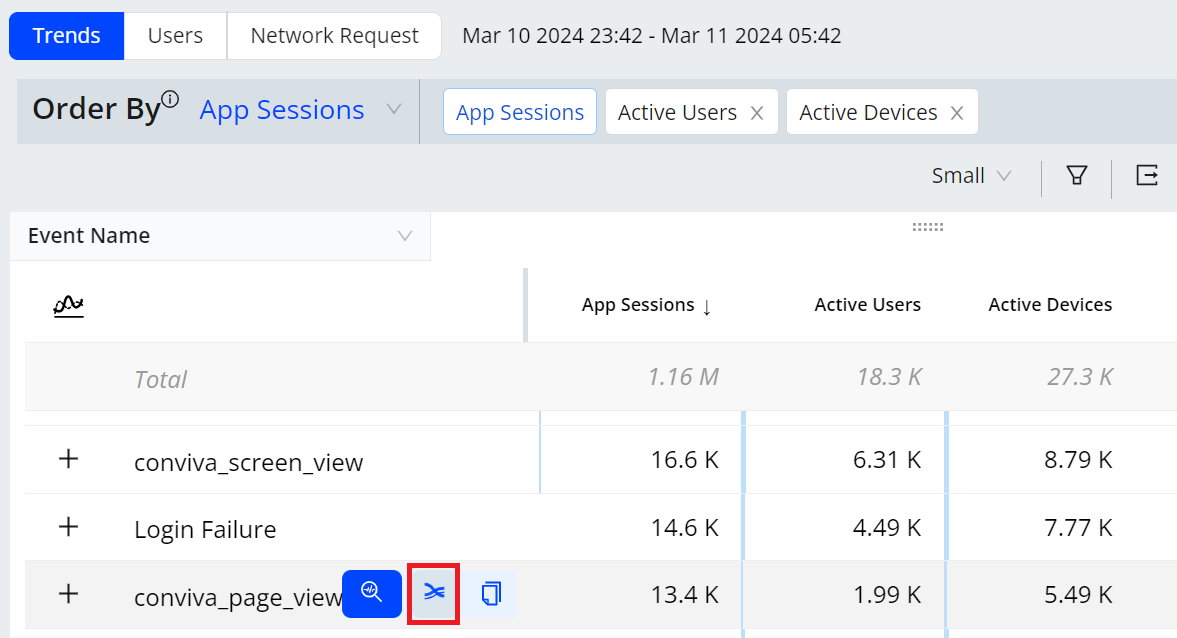
Select either of the options to open the Generate Paths chart window.
-
Hover over an event name from the Event Name list of the Dimensional table on the Trends dashboard, and click the Paths Creation icon.
-
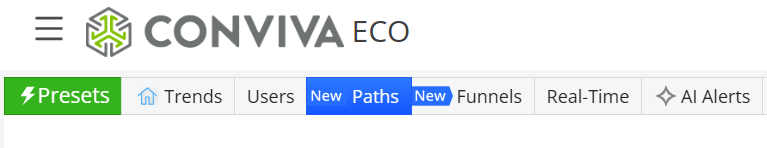
Click the Paths dashboard menu.
-
-
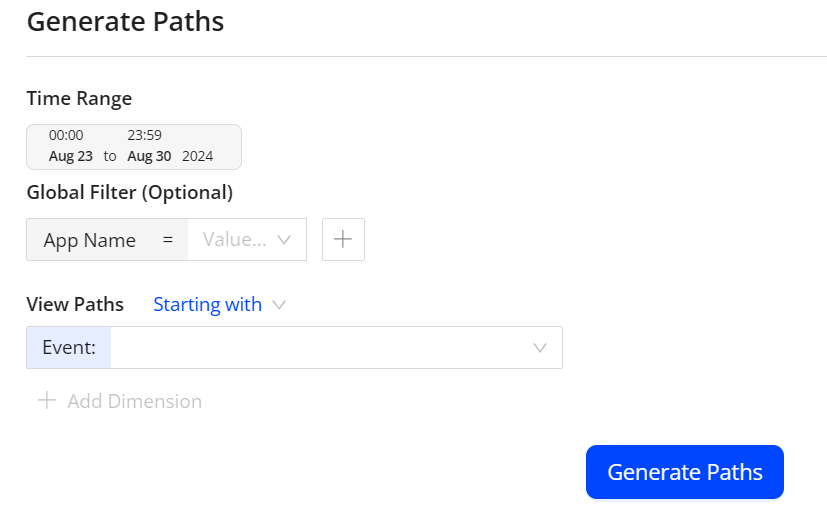
On the Generate Paths chart window, configure the Paths chart.
-
Set the time range. By default, the time range for Path creation is set to the Trends time range, and must not exceed 15 days.
-
(Optional) Select the application name from the App Name list of the global filter. For example, select Pulse5.
Note: For more refined data selection, click the add dimension icon and select dimensions and values from the drop-down list. For example, select countries as the dimension and United States as the value.
-
Configure the Paths chart starting or ending point.
-
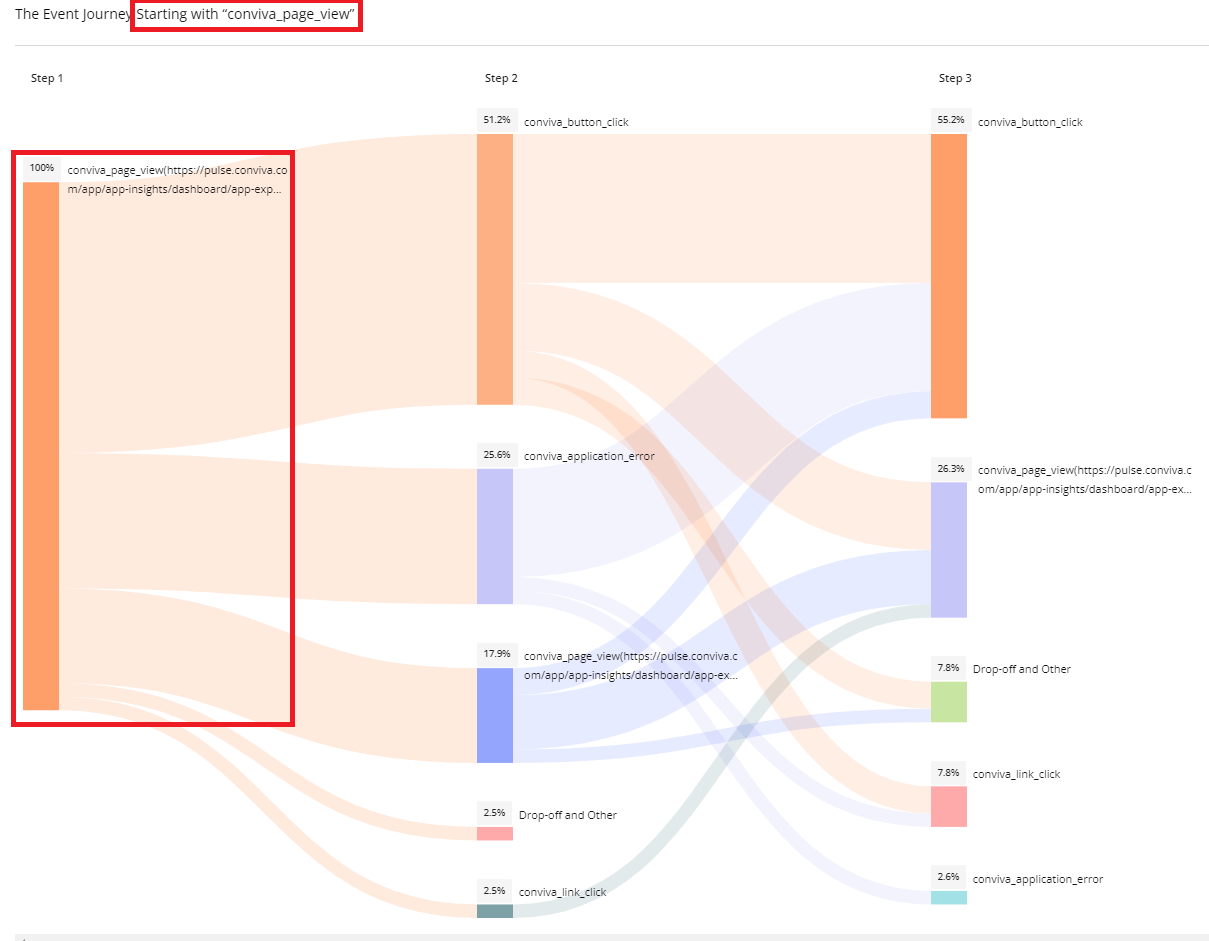
Select either of the options based on your requirements. In the example, selecting Starting with.
-
Starting with: specify which event is used as a starting point for creating a Paths chart
-
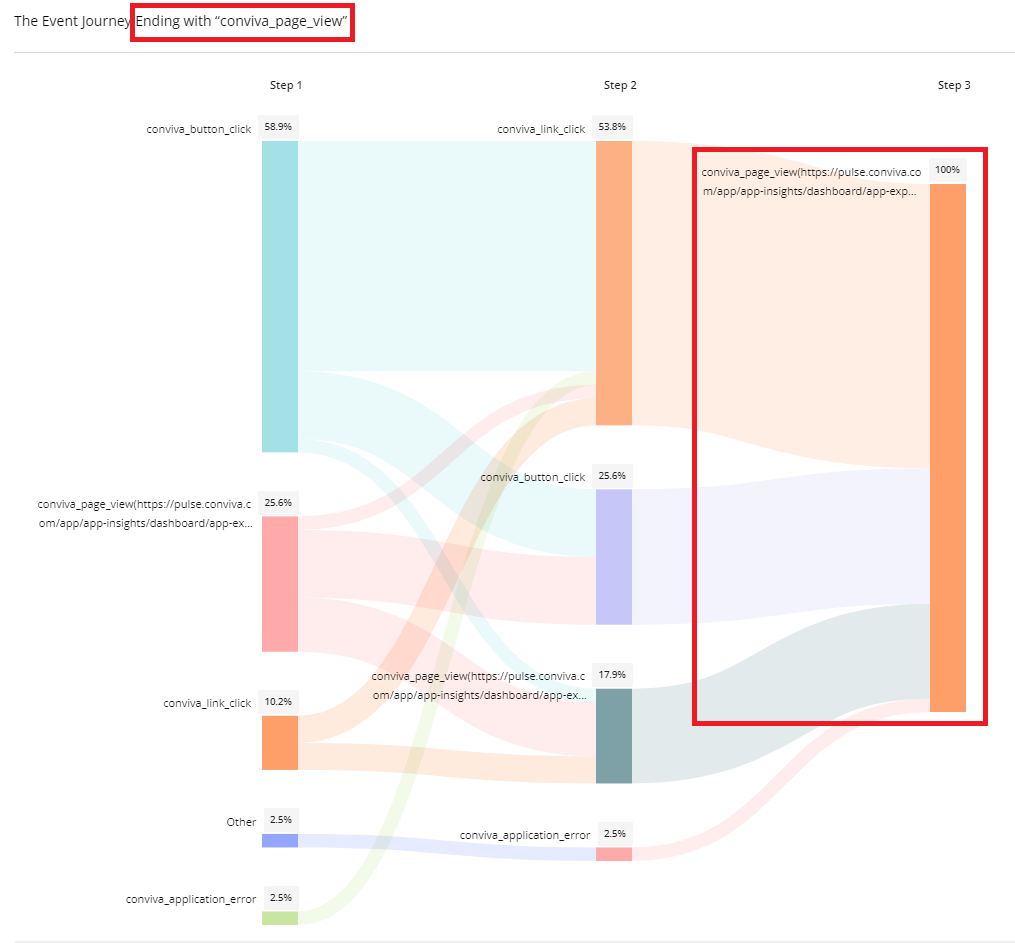
Ending with: specify which event is used as a ending node for creating a Paths chart
-
-
Specify an event as the point. You can narrow down the scenario by clicking + Add Dimension. For example, select conviva_page_view as the starting event, Page Url as the dimension, and https://pulse.conviva.com/app/experience-insights/dashboard/trends as the value.
Note: Other events are selected by default. If you want to specify events you want to explore, select the events on the Filter By Events list. For more details, see Updating Paths Charts.
-
-
-
Click Generate Paths Chart.
-
Check the Paths chart output. For more details, see Checking Paths Chart Outputs.
-
(Optional) Update the Paths chart configurations. For more details, see Updating Paths Charts.
Updating Paths Charts
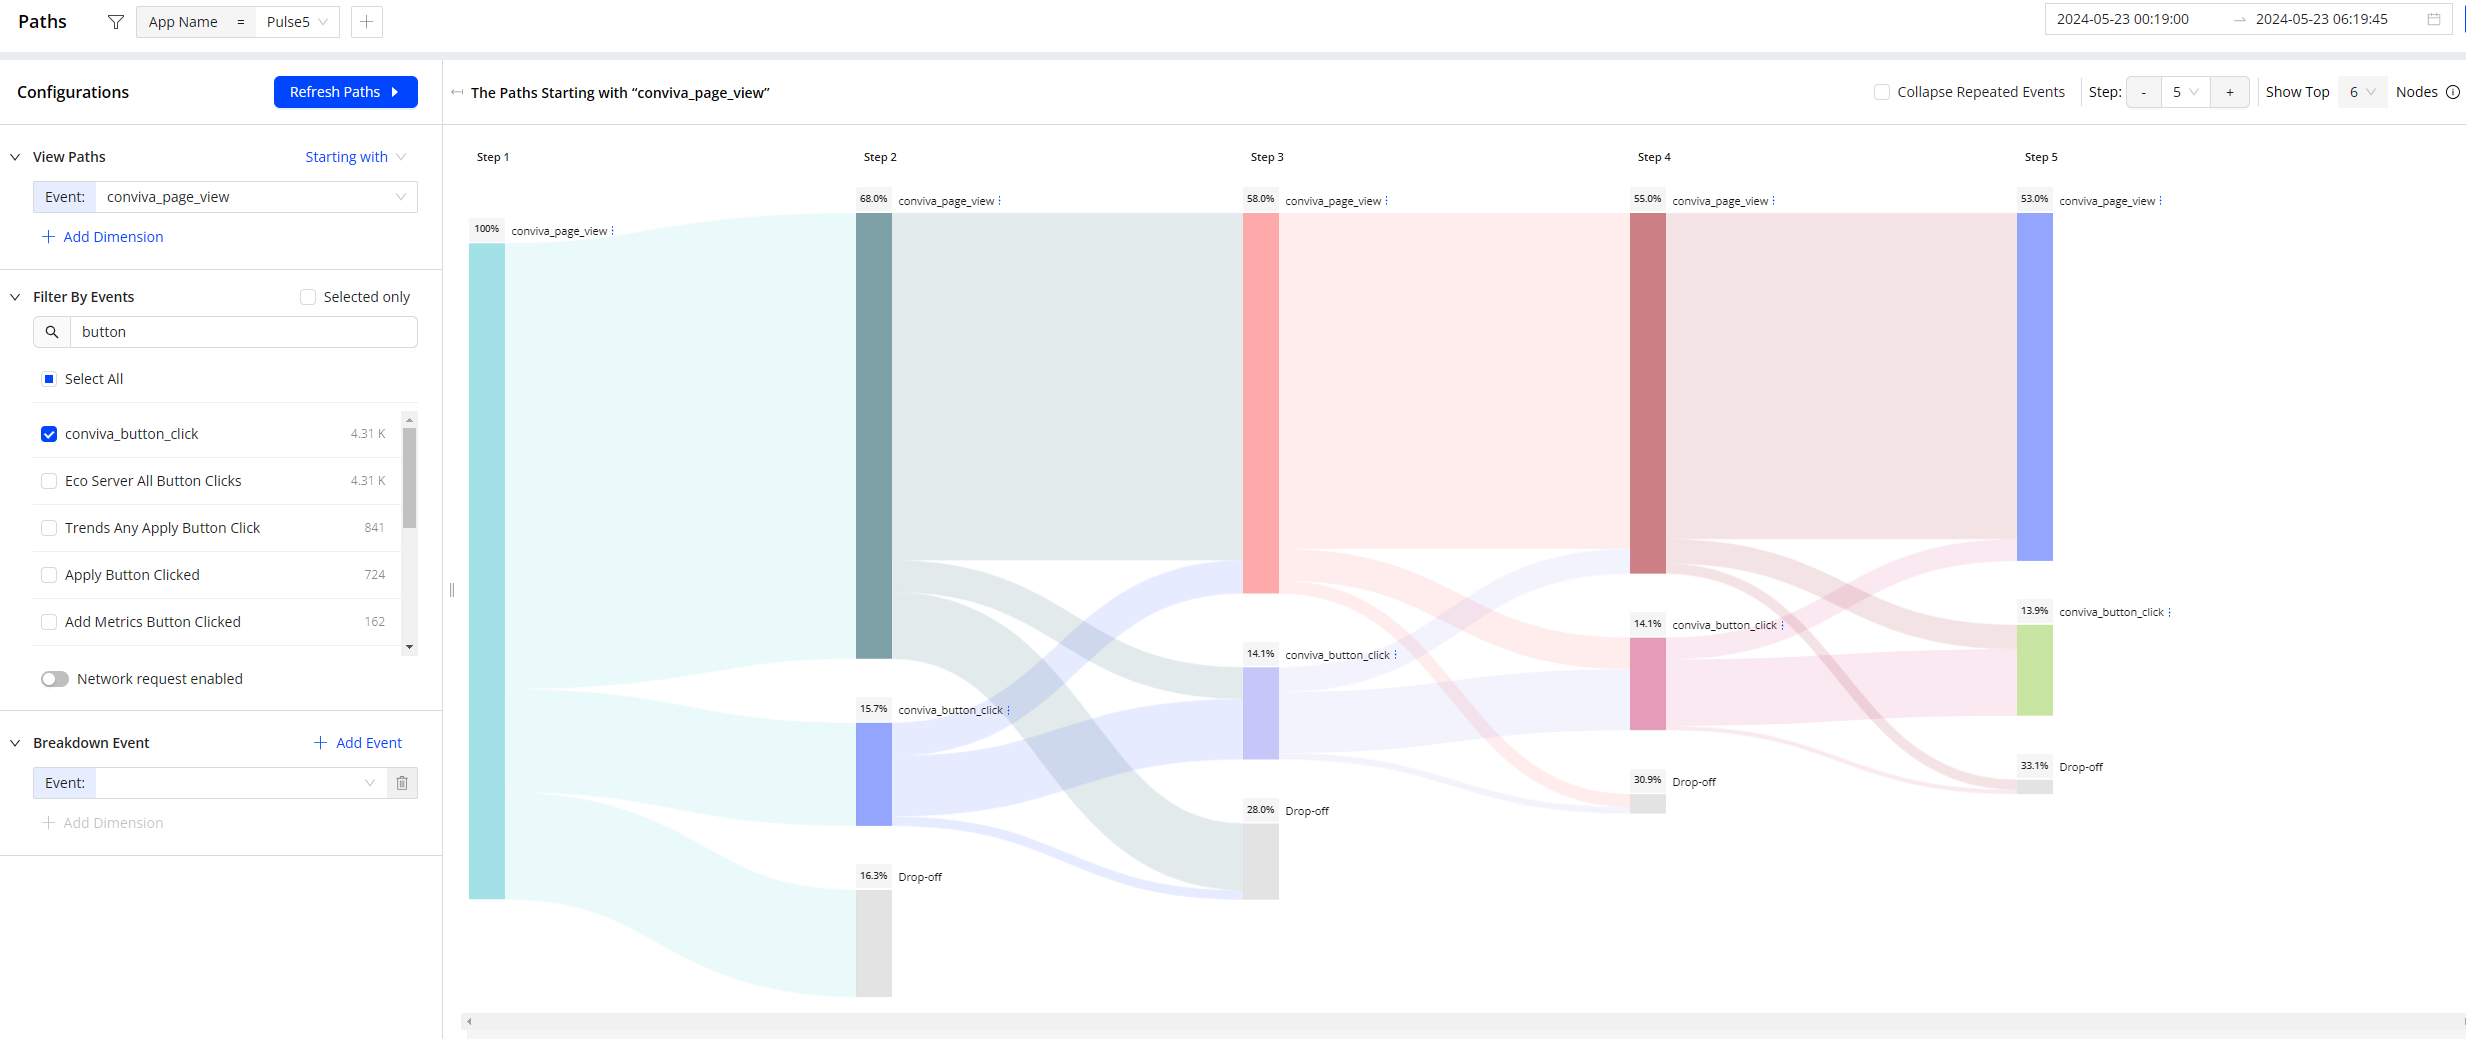
If you already created a Paths chart and want to update it or need to make more advanced settings, such as configuring step numbers and breakdown events, click the Paths dashboard icon for updating.
-
Update the Paths chart global filter, time range, and view path as you requirements.
-
Select the events you want to explore from the Filter By Events list. For example, select conviva_button_click, conviva_application_error, and conviva_link_click.
-
To select the network request events from the list, enable the Network request enabled option. By default, the option is disabled.
-
Set breakdown events to track specific event path that meets your requirements.
Note: If you set one or more dimensions for the event which is used as starting or ending node, the event is automatically broken down.
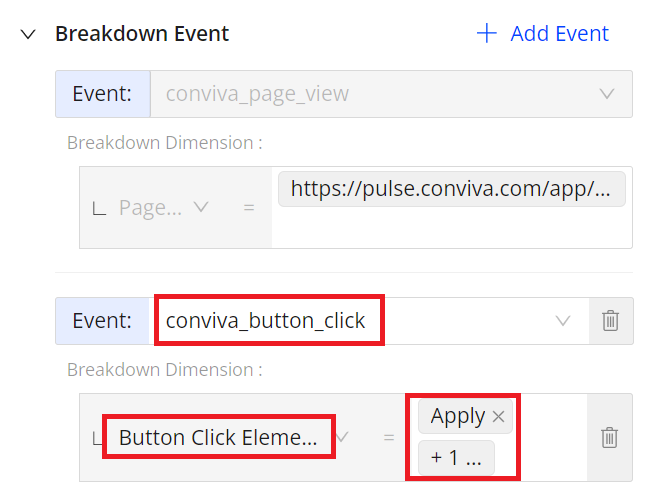
For example, set breakdown events for the conviva_button_click event to track the conviva_button_click event whose value of Button Click Element Text is Apply.
-
Click Add Event and select the event that you want to break down. For example, select conviva_button_click.
-
Click Add Dimension, select a breakdown dimension and the dimension value from the drop-down list. For example, select Button Click Element Text as the dimension and Apply and Save as dimension values.
You can also hover over the kebab icon on the right side of an event, and then click Breakdown to open the Breakdown Event field.
-
-
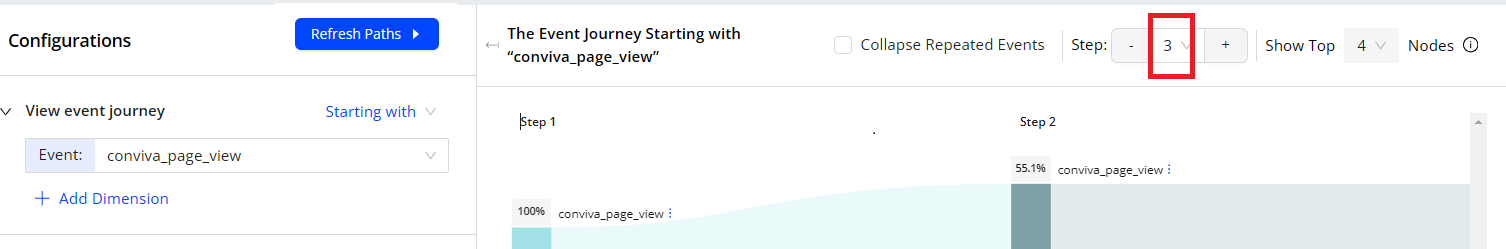
Specify the event path step numbers from the right corner of the page. For example, set the step number is 3. As a result, the Paths chart shows 3 steps after the starting point.
-
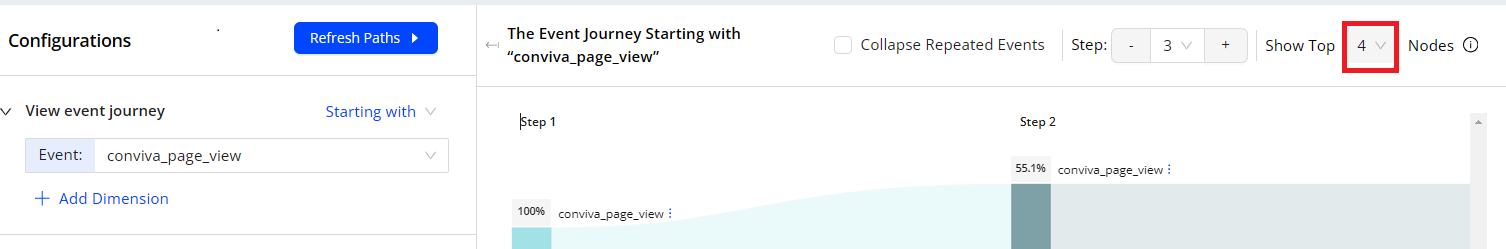
Specify the criteria for determining whether an event in a step belongs to the Other event type.
Note: [Conviva] Other Unfiltered Events occurs when the next step is not in the selected event set. Other refers to events that are not the top ranks of this layer. Conviva merges these nodes together as Other.
For example, set 4 as the criterion. As a result, the event in step 2 that is not among the top 4 events for the whole step 2 belongs to the Other event type.
-
(Optional) To collapse repeated events, select the Collapse Repeated Events checkbox. For example, the event path is conviva_page_view > conviva_page_view > conviva_application_error > conviva_page_view. After selecting the checkbox, the event path is updated to conviva_page_view > conviva_application_error > conviva_page_view.
-
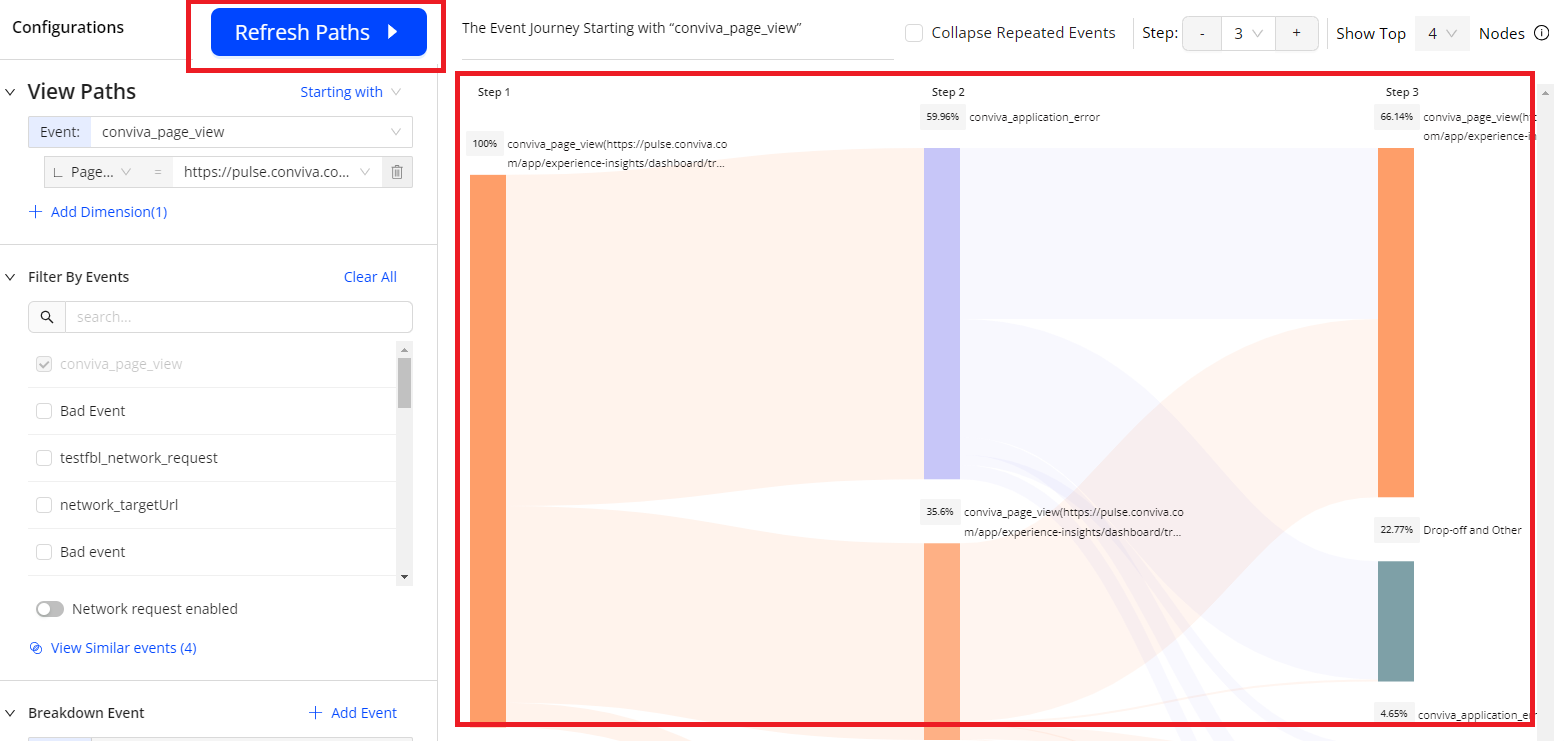
Click Refresh Paths and the Paths chart displays.
Note: After making changes in the left panel, click Refresh Paths to display the updated chart.
Checking Paths Chart Outputs
After creating a Paths chart, check the sequence and composition of events from the chart, path conversion and sample client id for further analysis.
-
Check the Paths chart.
Overall, the diagram shows the event sequence after opening the Video application trends page.

-
1: shows the conversion rate from conviva_page_view to conviva_application_error is 66.28%.
-
2: When hovering over an event, such as the conviva_application_error event, all the conviva_application_error events in the whole steps are highlighted and the percentage of paths containing the event displays. For example, 69.35% means that 69.35% paths containing the event among all the paths in the whole steps.
-
3: shows the percentage of the event among the whole events of step 2.
-
4: When hovering over a node, like the conviva_page_view node, a message will appear, indicating the events from which it is converted and their respective percentages. For example, 100% from conviva_page_view means 100% of the event is converted from the conviva_page_view event.
-
If using events with mapping rules in the Paths chart, you can check the mapping details by hovering over the kebab icon on the right side of the mapped event, and then hovering over Event Details.
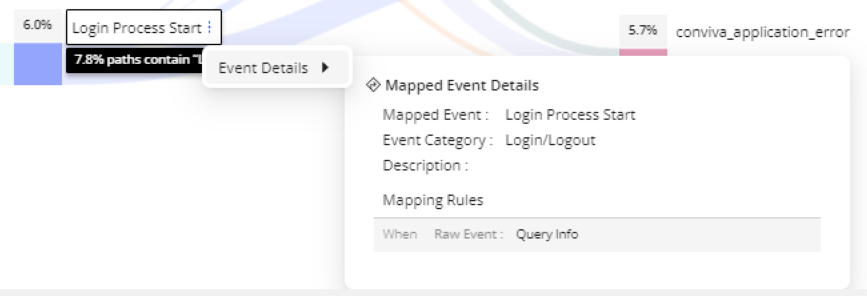
-
-
Click events to get detailed path conversion data from the Path Conversion table.
For example, click events conviva_application_error and conviva_page_view, and then the Conversion Funnel table displays.
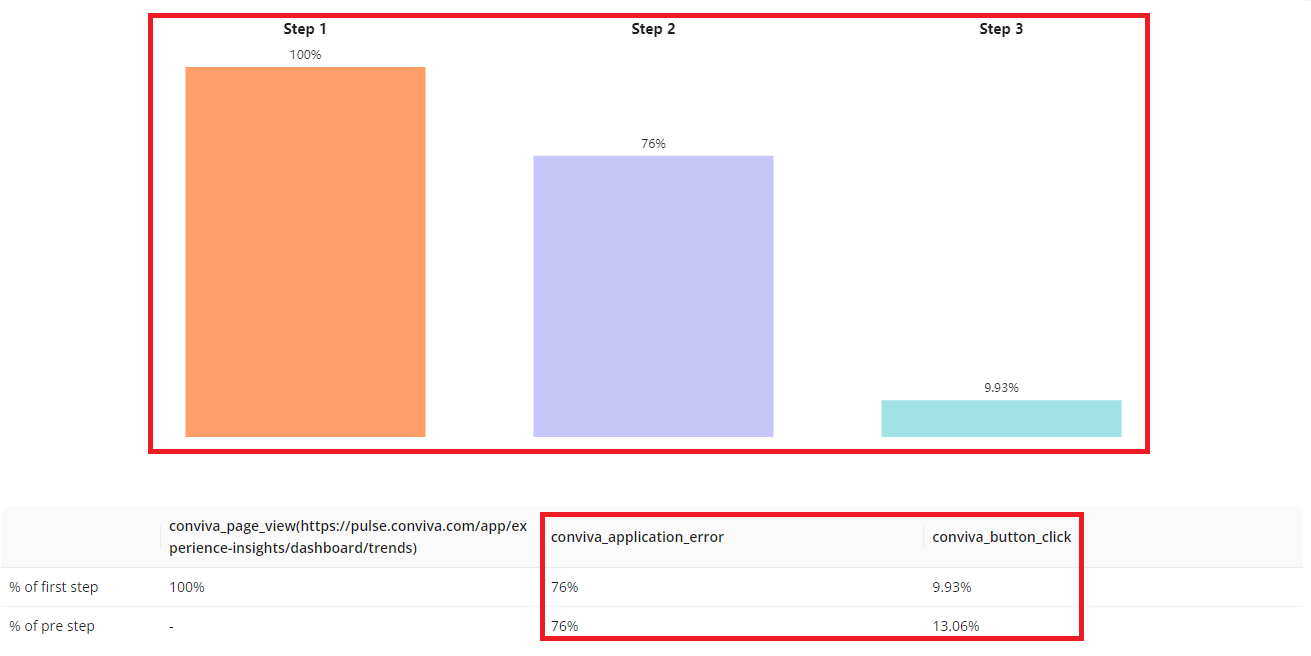
The table shows these important messages.
-
Event path is conviva_page_view > conviva_application_error > conviva_button_click.
-
Conversion rate from conviva_page_view to conviva_application_error is 76% while the conversion rate from conviva_page_view to conviva_button_click is 9.93%.
-
Conversion rate from conviva_application_error to conviva_button_clickr is 13.06%.
-
-
If there are users who experience the pattern you select, the clients’ ids display in the Sample Client Id list. Click the Ids to get more detailed data from the User dashboard.
Sharing Copied Paths Configurations
You can share the copied Paths configurations with other users.
-
Click the Share icon to share copied Paths configurations based on the existing ones. Other users can edit the shared Paths configurations.
-
Click Copy to clipboard to copy the link and share the Paths configurations.