Conviva DPI Overview
Conviva’s Digital Product Insights (DPI) captures real‑user interactions and the associated network traffic from web, mobile front‑end applications and transforms these data into a unified set of metrics that uniquely connect:
-
User engagement – e.g., session length, feature adoption
-
Experience quality – e.g., Largest Contentful Paint (LCP), crash‑free sessions
-
Technical performance – e.g., API error rate, API latency
Combining user experience and performance metrics with critical user journey analysis, DPI goes beyond traditional user journey mapping, modeling user experience as critical user segments (Flows) with real-time monitoring and diagnostics. Product managers, engineers, and operations teams rely on these insights to quantify how application and service performance influence specific journey steps and overall business outcomes.
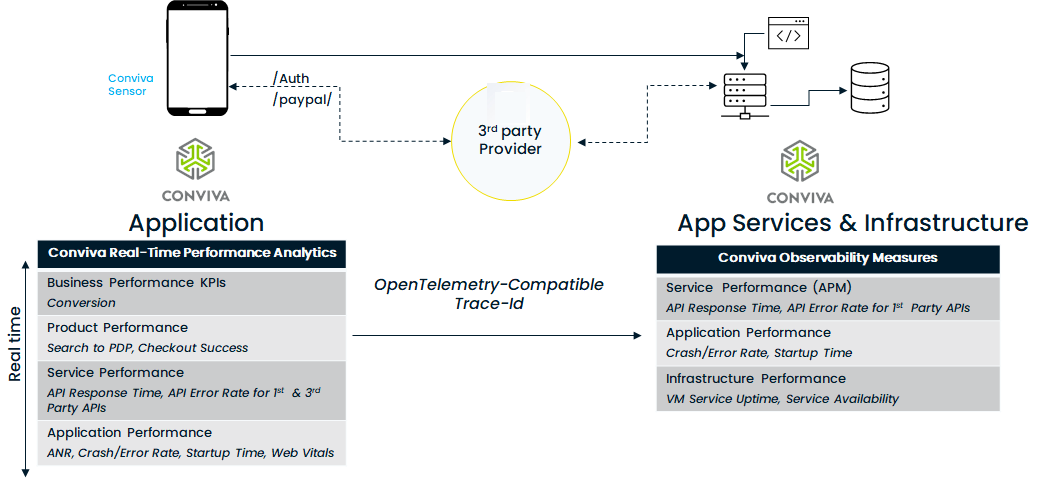
DPI enables teams to define their own Flows—specific segments of user journeys—by mapping events at the Conviva’s Platform, eliminating extra client‑side instrumentation. Each Flow surfaces real‑time success rates, error rates, duration statistics, and SLO compliance to quickly point toward root cause fixes and experience improvements. The DPI client SDK also includes an OpenTelemetry‑compatible Trace-ID support to link every front‑end API request to its corresponding back‑end trace, enabling rapid error detection and root‑cause analysis across the full request path.
Core DPI Capabilities
| Capability | What it does | Typical Performance and User Experience Questions Answered |
|---|---|---|
| Real‑Time User Metrics |
Collects Core Web Vitals such as Largest Contentful Paint (LCP), page/view load time, crash‑free sessions, error counts, network timing, and device context. |
What is the LCP for App version 3.2 on iOS 18?
How is the LCP changed between App version 3.1 and 3.2 for Android in New York? |
| Critical Journey Tracking (Flows) |
Breaks complex user journeys into ordered steps; computes per‑step success, duration, and abandonment and provides real-time monitoring. |
10K users could not login within our SLO of 3 seconds. |
| Custom KPI & SLI Builder |
Promotes any captured event to a time‑series metric; lets you define good / total pairs, thresholds, and roll‑up windows. |
Checkout to Payment Success Rate has met our 99.9 % SLO for this month. |
| Distributed Tracing (OpenTelemetry Compatibility) |
Insert front‑end Trace ID with backend services to give end‑to‑end latency breakdown. |
Which micro‑service caused the slow Add‑to‑Cart step?” |
| Anomaly Detection |
Includes seasonality‑aware models flag anomalies on out-of-box and custom-metrics. |
Checkout to Payment failure rate is high when using PayPal in Florida |
| API Performance | Monitors and alerts on API latency and errors (3xx, 4xx. 5xx), linking experience and engagement with corresponding back‑end trace. | Which network request APIs are causing checkout and payment confirmation delays. |
Workflow at a Glance
-
Instrument – Add a two‑line SDK snippet (JS, iOS, Android, Roku). Auto‑captures navigation and client network events. See Ingest.
-
Define SLO within a specific Flow – Use the Metric Builder to map a specific Event, Build Custom Metric using two mapped events, set a SLO target (e.g., 99 % success) and duration window (rolling 28 days). See Activation and Metric Builder.
-
Monitor – Review live dashboards, error‑budget charts, and anomaly alerts. See Trends.
-
Diagnose – Drill into Flows and Traces to isolate latency, errors, or abandonment causes. See Flows.
-
Export & Automate – Push time‑series to Datadog or export session summary data to external storage buckets.
DPI Digital Product Insights Digital Product Insights DPI DEM DEM Digital Experience Digital Experience Experience Monitoring Monitoring