DPI offers pre-defined feature options as quick starting points to provide access to commonly used metrics and metadata use cases. Users can customize these pre-defined selections as needed and save them as public or private dashboards.
To access the preset use cases:
-
Click Preset to access:
-
Click Presets on the DPI.
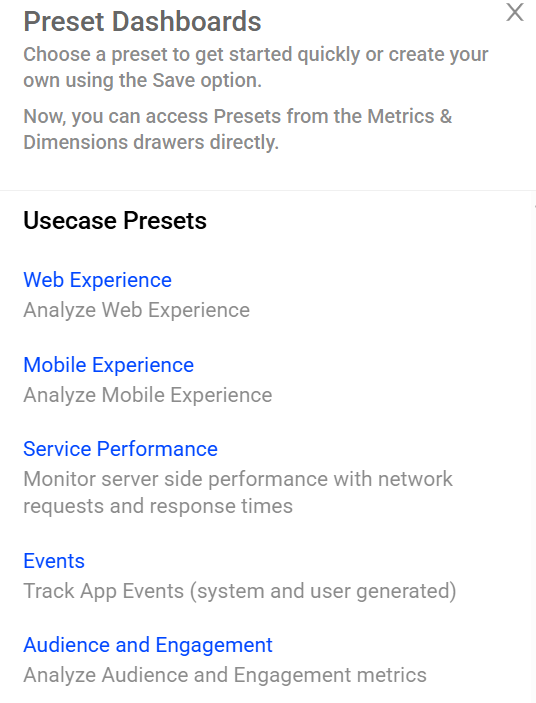
Preset Usecases dashboard is displayed.
Preset Usecases Dashboard
-
Select the preset usecase from the displayed list to see the selected dashboard.
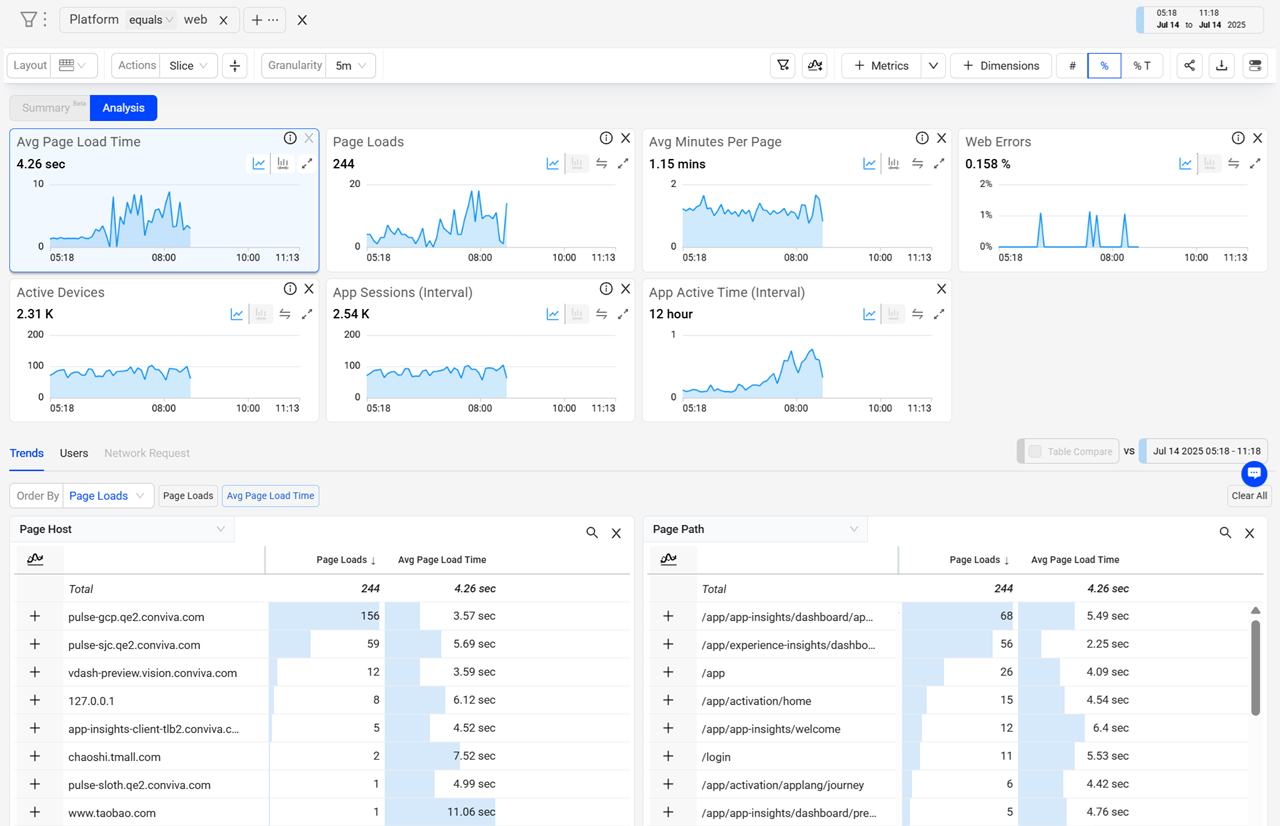
Web Experience Preset
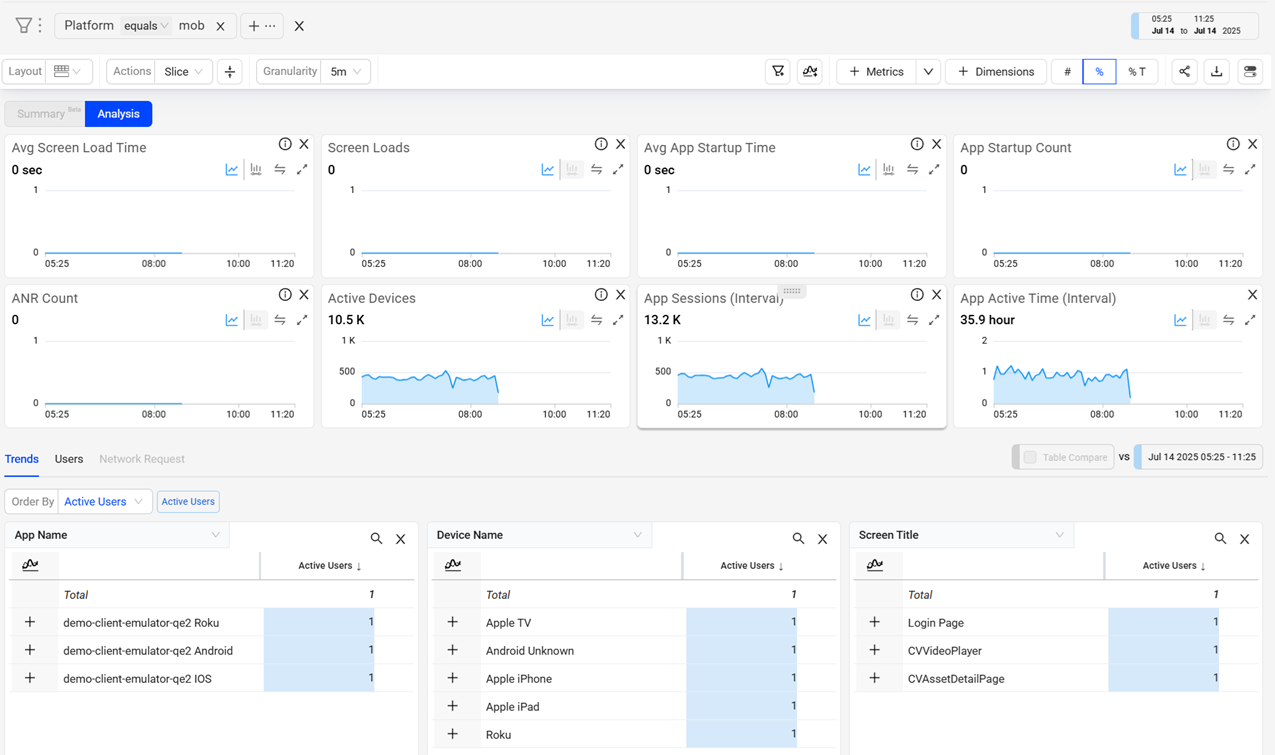
Mobile Experience Preset
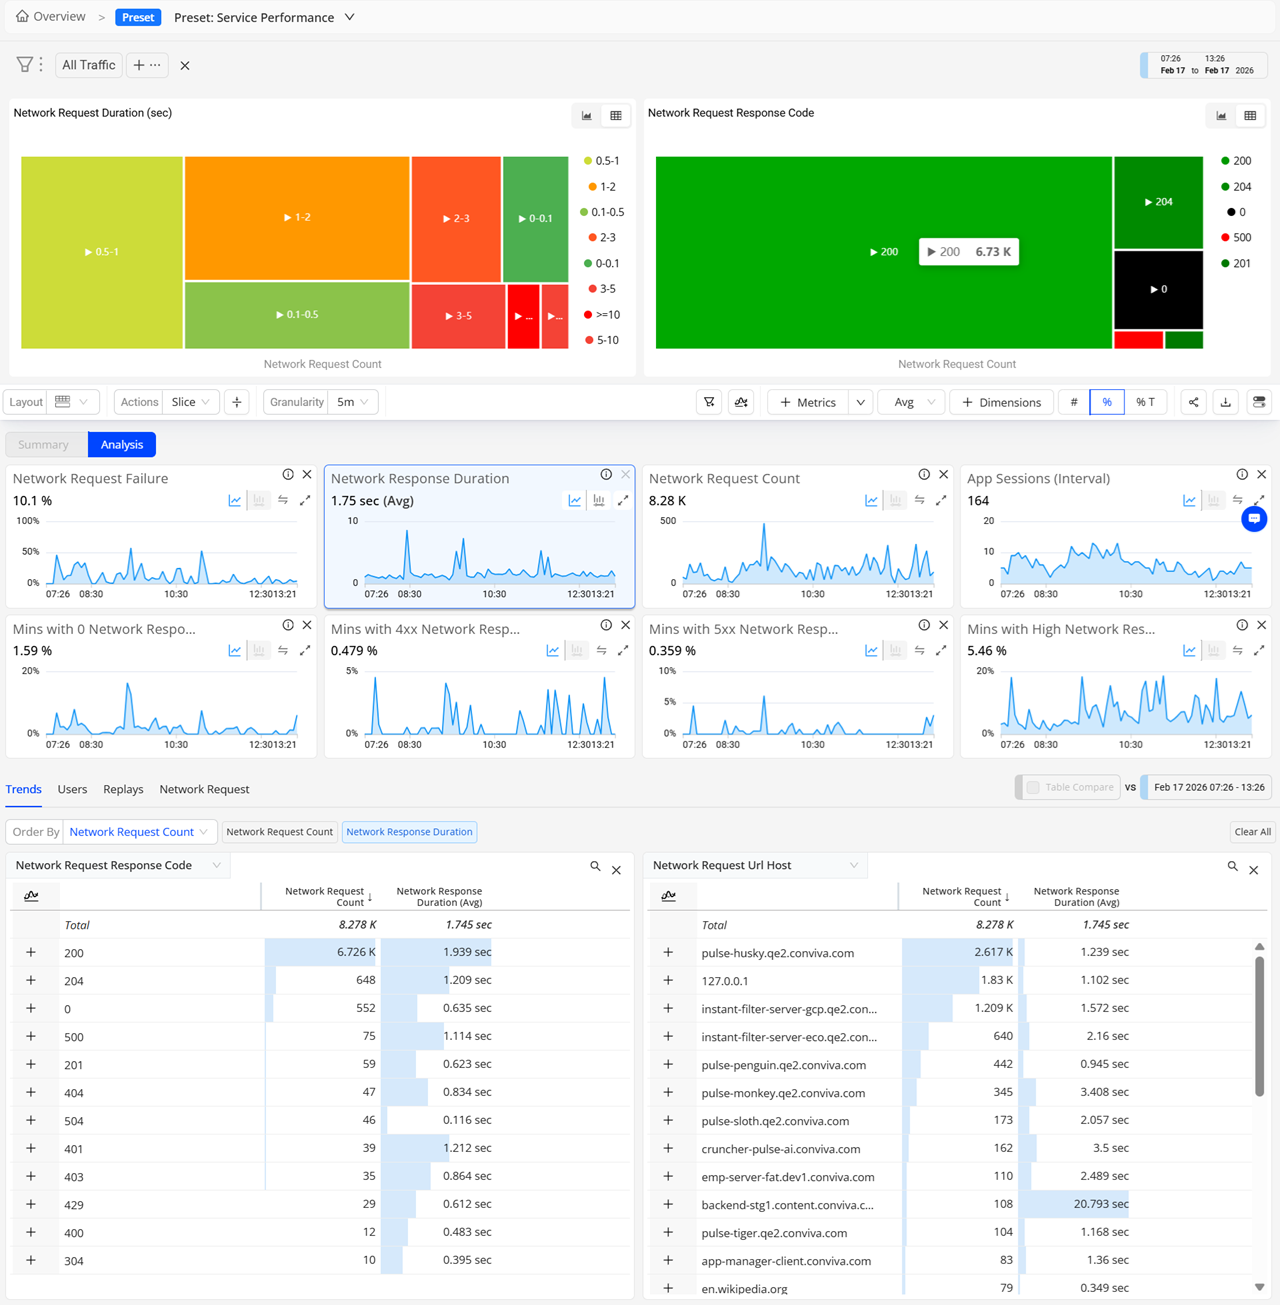
Service Performance Preset
Events Preset
-
-
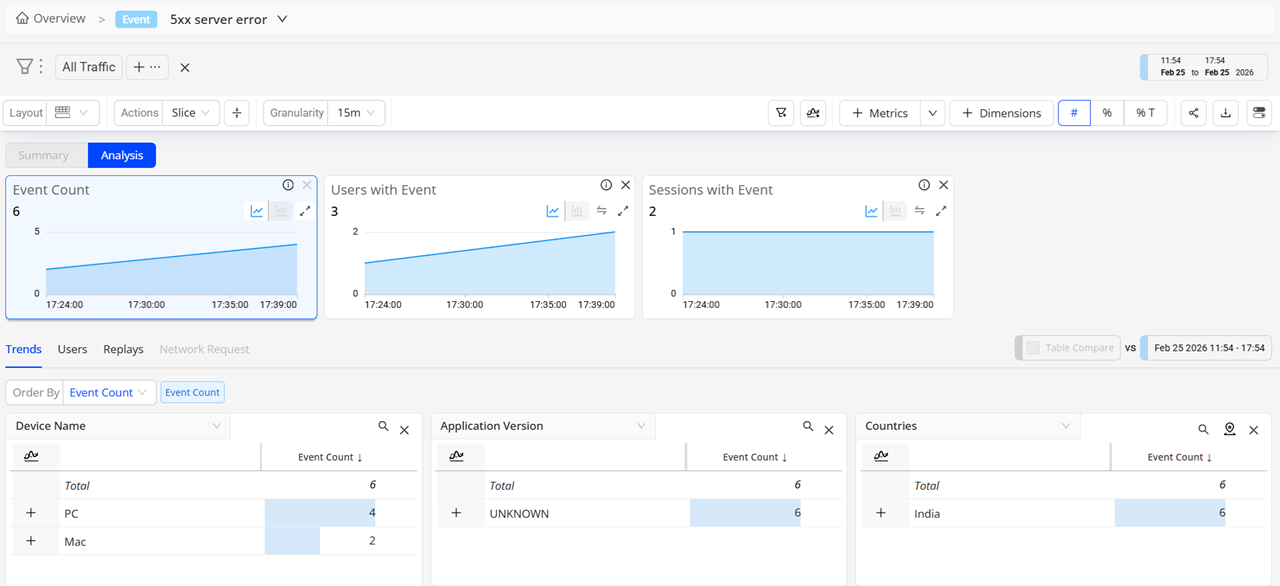
From the Trends dashboard:
-
In the Dimension Table, hover over any dimension value, and then click the Drill down to Events view icon to navigate to the respective view with the dimension value as the primary filter for further analysis.
-
In the Dimension Table, click the icon near the dimension heading to be directed to the respective view with the primary filter set to All Traffic for further analysis.
OR
-
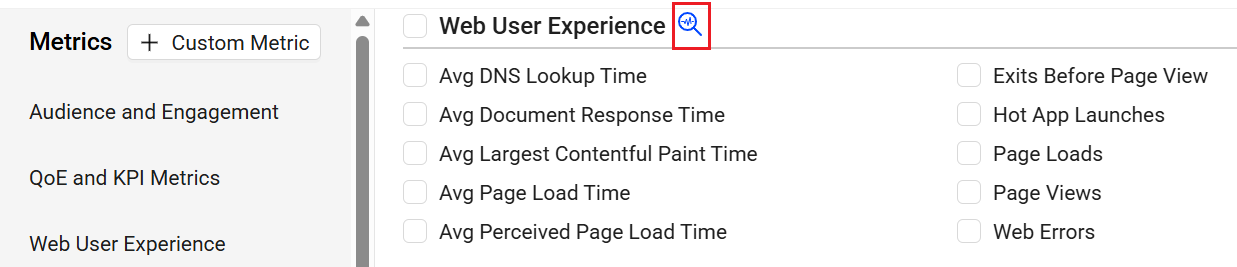
On the Metrics pop-up window, click the Preset icon next to the metric category to see the associated preset dashboard.
-
Percentile Selections
Use the drop-down list beside the Network Request Duration metric in the Select metrics to view window on the Server Side Performace prest dashboard to select a percentile for a more precise analysis of app performance, especially when a few outliers or extreme values impact average metrics.
Percentile Selections
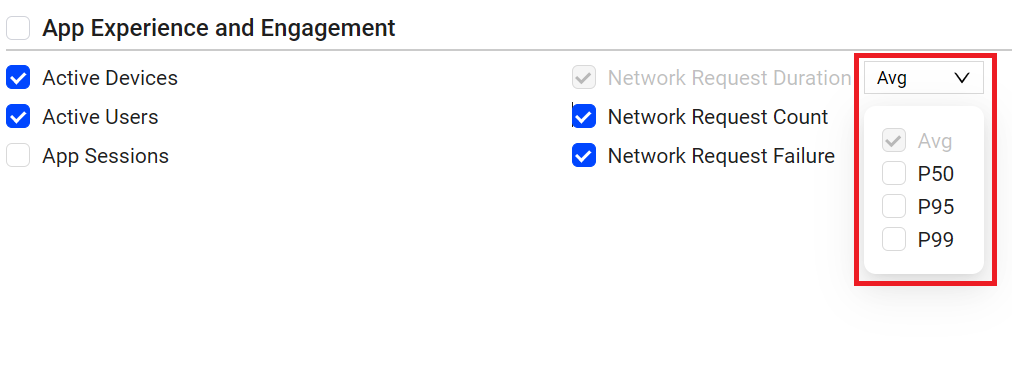
Note: The percentile selections are available only for the Network Request Duration metric on the Service Performance preset dashboard.
For example, the Network Request Duration metric is 2.5 seconds, based on a few outliers exceeding 20 seconds, significantly affecting the average duration. Using percentiles, 99% of the average network request duration is equal to or less than 120 ms, indicating good performance for most users. In such scenarios, the average metric percentile clarifies how the experience impact is distributed. Use the drop-down list to more clearly understand the user experience of 50%, 90% or 99% of the users.
The percentile selections include:
-
Average: This option is selected by default, indicating the sum of time taken by total requests in a session divided by the number of requests.
-
P50: The point at which half of the requests are faster and half are slower, offering a baseline for understanding typical app performance. It represents the median in the distribution of network request durations.
-
P95: This percentile indicates that 95% of the network requests had this value or below it. It reflects the most common performance experienced by a significant majority of users, ensuring a good experience for a larger subset and accounting for most outliers.
-
P99: The performance experienced by 99% or almost all users, excluding the worst1%, crucial for identifying outliers and ensuring a good experience for the vast majority.