The Funnels dashboard enables you to create funnel charts for visual tracking of conversion rates based on key event progress across selected dimensions.
For example, create a Funnel chart that includes events of Login Process Start, Login Credentials Submit, and Login Success across specific cities. The created Funnel chart allows you to understand the conversion rates such as the the conversion rate from the starting login process to login success, helping you gain insights for event conversion and potential issue identification. To learn more about DPI capabilities, see Conviva DPI Overview.
Funnel Overview
Creating Funnel Charts
Before creating a funnel chart, determine which events contribute to the completion of the conversion process, such as login start, credential submit, and login success. Also, select dimension entities, such as target geographic areas or app versions.
-
Access the Funnel dashboard configuration:
-
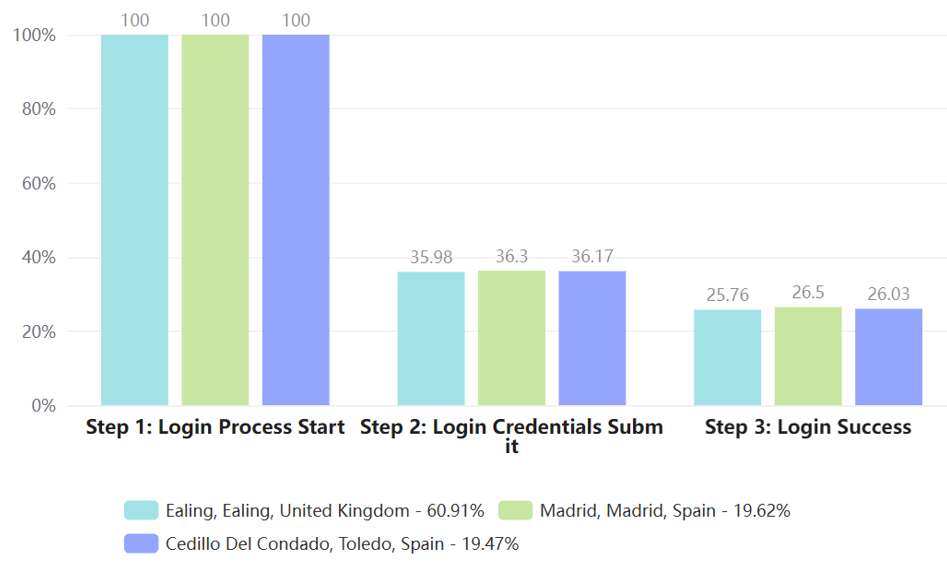
In the main tool bar, click Funnels.
Funnel Menu
-
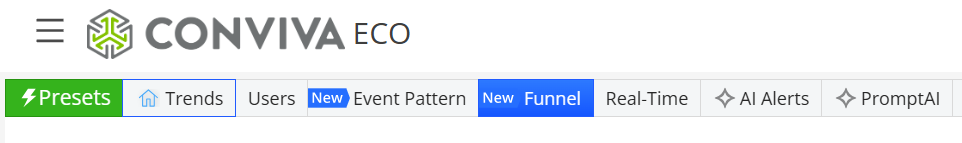
In an open Funnel dashboard, click View Funnel.
-
-
(Optional) Select the application name from the App Name list of the global filter. For example, select Roku.
Note: For more refined data selection, click the add dimension icon and select dimensions and values from the drop-down list. For example, select countries as the dimension and United States as the value.
-
Set the time range. By default, the time range for Funnel creation is set to the Trends time range, and must not exceed 15 days.
-
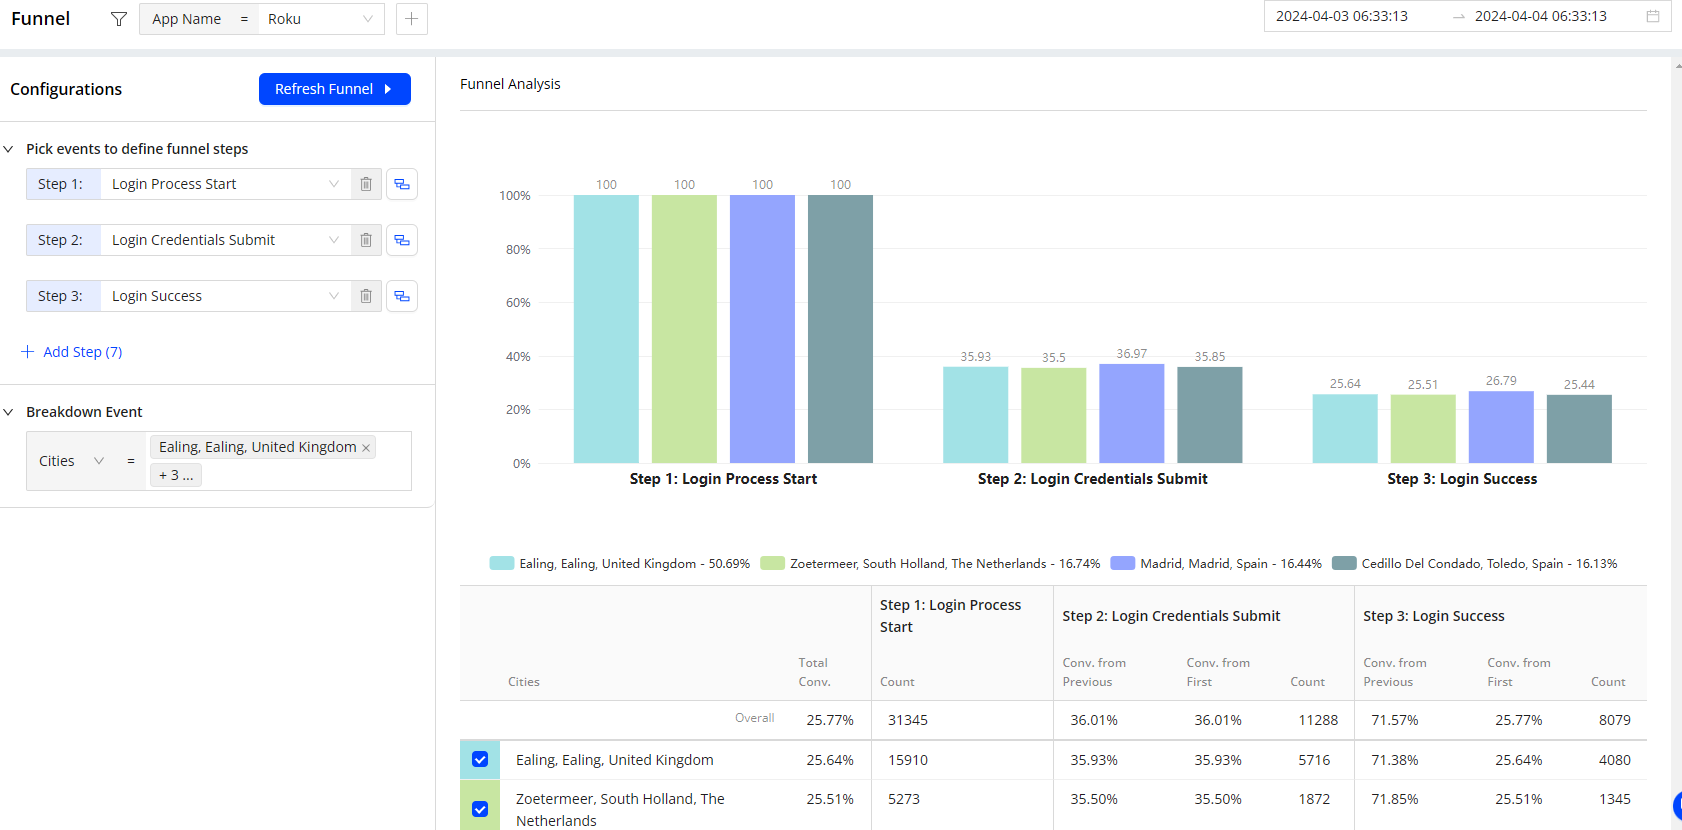
In the Configuration area, configure the Funnel settings.
-
Pick events to define funnel steps. For example, select Login Process Start, Login Credentials Submit, and Login Success as Step 1, Step 2, and Step 3.
Note: For more refined data selection, click the add dimension filter icon and select dimensions and values from the drop-down list. For example, select conviva_page_view as a step, Page Url as the dimension, and https://pulse.conviva.com/app/experience-insights/dashboard/trends as the value.
-
Set breakdown events to track specific event data that meets your requirements. For example, select Cities from the dimension drop-down list and select city names from the value drop-down list.
-
-
Click Refresh Funnel in the Configuration area.
-
Check the Funnel chart output. For more details, see Checking Funnel Chart Outputs.
Checking Funnel Chart Outputs
After creating a Funnel chart, you can do funnel analysis from the chart, table, and sample client IDs.
Funnel Chart
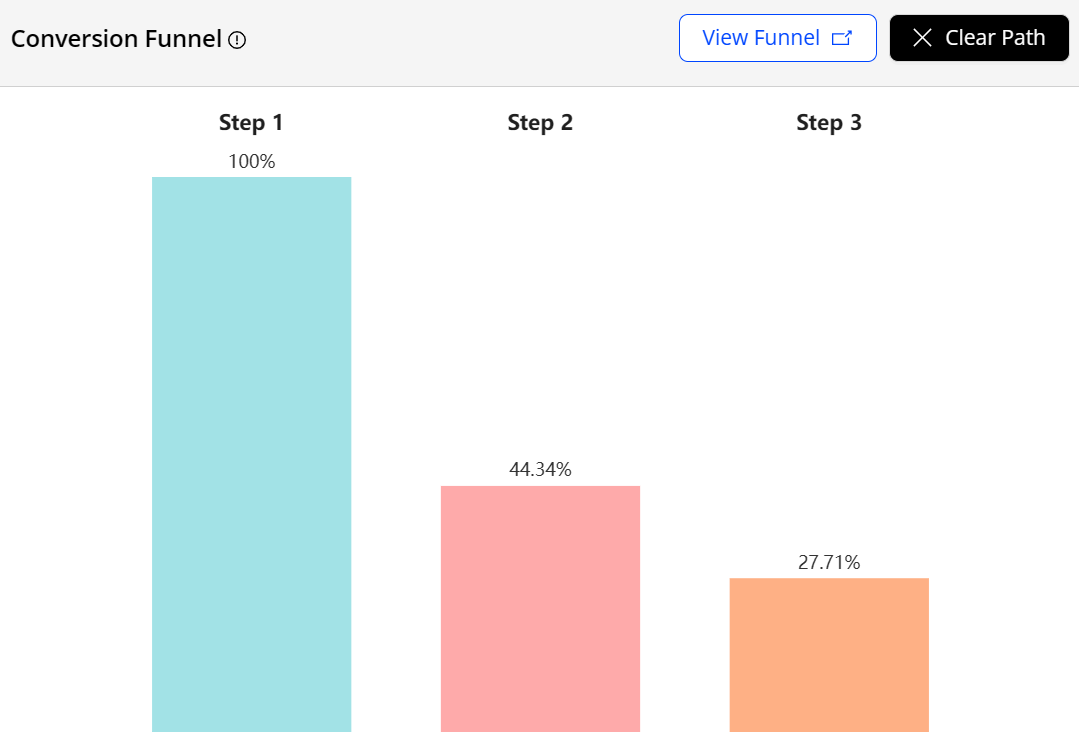
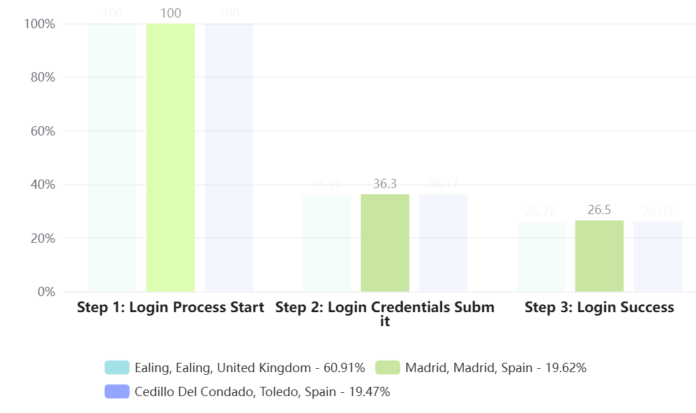
Overall, the diagram shows the conversion rate from the start of the login process to login success across different three cities.
Funnel Chart
-
Columns in the event steps for each dimension entity show the percent completion for each event step in the conversion progress
-
Dimension legend shows total conversion rate percentages.
In this example, users from Ealing, UK have the highest login completion rate.
When hovering over a node, like the Madrid node in step 1, other nodes in all three steps fade out, providing a convenient way to check specific node.
Specific Node Check
Conversion Data Table
Use the table view to display detailed breakouts of the conversion step rates, including previous and first step conversion rates.
Conversion Data Table
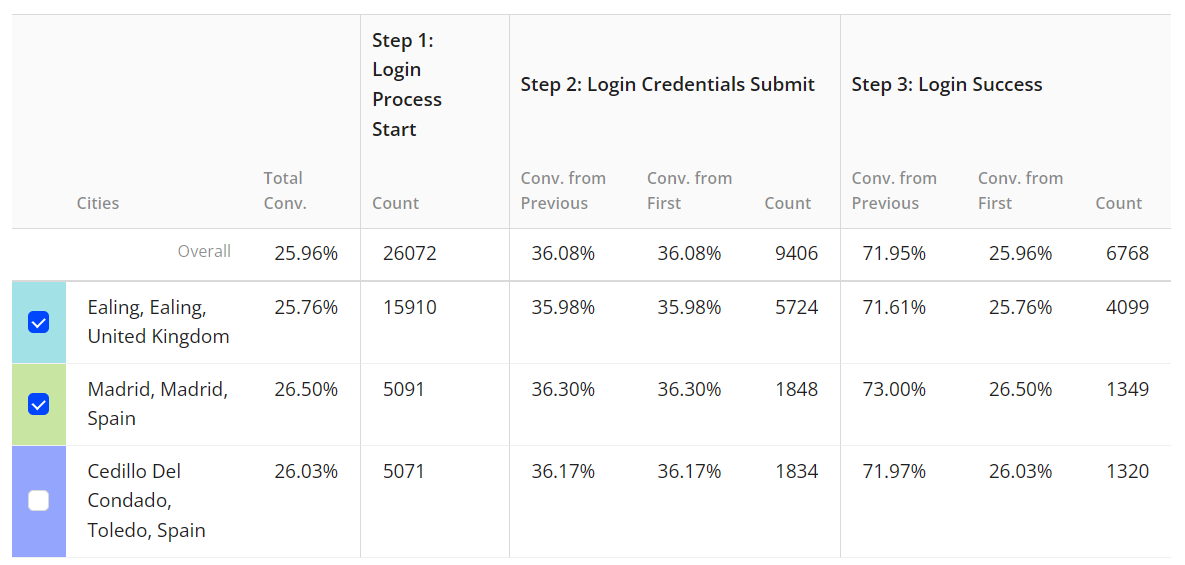
Select the checkbox next to the city name on the left to display the client IDs for that city in the Sample Client Id list.
Sample Client Id List
The Sample Client ID list shows the client IDs of the cities for which you selected the checkboxes in the conversion data table. After clicking the IDs, you will go to the User dashboard and you can view the user timeline for more details about the user activities.
Sample Client Id List
Sharing Copied Funnel Configurations
You can share the copied Funnel configurations with other users.
-
Click the Share icon to share copied Funnel configurations based on the existing ones. Other users can edit the shared Funnel configurations.
-
Click Copy to clipboard to copy the link and share the Funnel configurations.