DPI flows represent critical steps in real-user journeys that enable continuous monitoring and step-wise activity progress in real-time, measuring critical user journey durations, success rates, and completions. For continuous diagnostics within Flow activities, DPI generates AI-based alerts on progress and completion anomalies to diagnose and optimize user digital experiences. For how to create Flows, see Creating and Activating Flows.
Use Flow success rates, anomaly detection, error rates, and duration tracking to quickly point toward root cause fixes and digital experience improvements. With OpenTelemetry-compatible tracing, Flows can connect front-end app experiences directly with backend server performance.
Note: Flow metrics and analysis transform the way teams can effectively measure and monitor how application performance, network services, and critical user journeys impact business outcomes. Conviva stateful metrics consider the time app sessions spend in a given state or sequences of states and the related events and apply this analysis in real-time to Flow progress. To learn more, see Conviva's time-state analysis , DPI Overview and Monitoring User Journeys.
User-defined Flows can be configured to capture the critical user outcomes of a specific task within a digital application, such as login, search, and checkout. Flow success is determined by the required initial and complete events occurring within the configured Flow success window. A flow can span multiple sessions as long as the time between sessions does not exceed the 5-minute inactivity timeout window and the overall duration is within the 1-hour flow completion window.
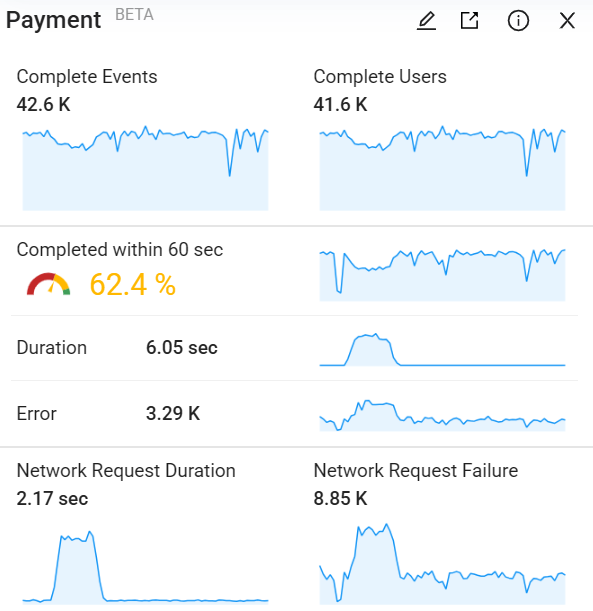
The Flows feature provides a preset dashboard to quantify business KPIs using predefined metrics, such as success rate, duration, inits, network request performance, and errors, including conversions with errors.
Furthermore, Flows enable different teams, typically restricted to siloed data, to share the same performance data context, connecting business KPIs, user app experiences, and service performance for comprehensive cross-functional analysis of app performance, network service health based on real-user experiences.
Flow metadata enables efficient troubleshooting and root cause analysis by capturing flow-specific dimensions, such as:
-
Business-specific dimensions: For example, credit card type in a payment flow. These are not part of global metadata but are highly relevant to the specific flow.
-
Error dimensions: Error reason, error message, and error ID.
-
Network request dimensions: Endpoint, host, path, and response code.
After creating flows, use the Flow widgets to prioritize the most critical flow success and completion rates, correlating Flow metrics with other performance indicators. The Flow Preset page provides a preset dedicated to a specific Flow. It includes all relevant metrics and dimensions associated with that Flow, providing full context to get started with in-depth analysis.
Before performing the tasks related with flows, such as creating and activating a flow, make sure that your account has the permission to create flows and Conviva Sensor is integrated with your application.
Creating and Activating Flows
Note: Activation refers both to the component in the interface and the process of building and deploying events, metrics, and dimensions to the Pulse production environment.
-
Start with the location:
-
Activation Home Page
-
Metric Builder
-
Flow Widget in Trends
-
-
Enter the flow name, description, and labels.
-
Flow name. For example, to track the journey starting from clicking the play button and ending with successful video playback, enter 'Initiate video playback'.
-
(Optional) Flow description. For example, enter ‘User clicked the play button and successfully started playing a video.’ This flow represents the explicit user action to begin video consumption from a control element.
-
(Optional) Labels. Enter Flow labels to clarify the Flow use in the UI. For example, enter Payment to label Flows related to the payment process, such as the Flow from login to payment. Flows with labels are grouped by labels in the Overview dashboard.
For existing labels, click the kebab menu to edit or delete them.
-
-
Select events that signal the start and end of a user flow.
-
If you are unsure about the exact events to select, use the tools to identify them:
-
EventLooker: Allows browsing and searching events and tag keys. After rules are selected as filters, click Apply as to apply the event to Initial Event, Complete Event, or Error Event.

-
LiveLens: Provides a real-time view of events and tags as they appear in the timeline UI during interactions with the app. To learn how to use LiveLens, see LiveLens.
-
-
Select events for flow creation. If the events in the drop-down list do not meet your needs, click the Edit icon to make changes.
Note: To measure any network request from a specific page, such as a page whose path contains ‘profile’, use metadata as context to limit the network requests to those originating from that page. Metadata such as Country, Page Path, and Device Name serve as context to ensure that the configured event rule matches the selected metadata, enabling accurate measurement of specific traffic.
-
Initial Event: signals the start of the user flow in your app.
This event is usually a user interaction in the app (such as a search button click or a page view indicating that users are exposed to the search page).
Note: When a network request is set as an initial event in a Flow and the Flow complete event occurs very close to the initial event, such as within seconds, the Flow conversion data may be impacted.
-
Complete Event: signals the positive outcome of a user flow in the app.
This event is typically the final confirmation in a flow, for example, a Page View of Payment Acknowledgement Page or Network Requests with a response code indicating payment success
-
Select the initial event pairing logic when multiple initial events occur in a flow.
-
Use the first initial event: Select this option to start the Flow measurement from the first occurrence of the initial event in the flow. For example, to track a flow from Submit Payment to Payment Success, choose the first initial event to include retries and other explorations that occur before the payment success.
-
Use the last initial event: Select this option to start the Flow measurement from the last occurrence of the initial event in the flow. For example, to track a flow from Search to Video Play, choose the last initial event to exclude retries and other explorations that occur before the last search attempt that led to video play.
-
-
-
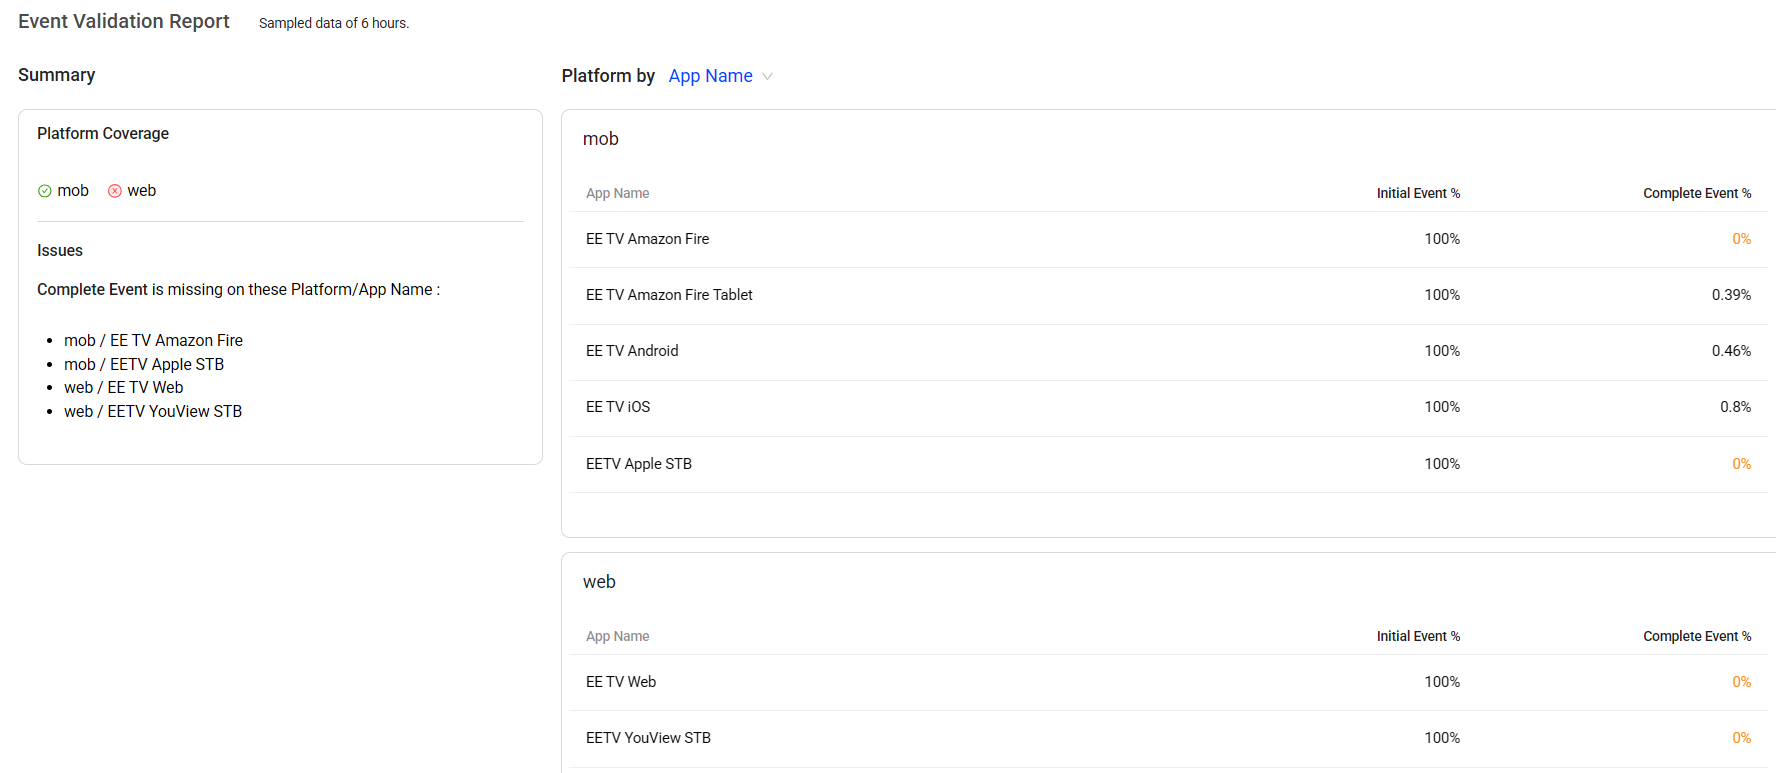
Use the Event Validation Report to confirm whether the configured Flow events have coverage across the required integrated platforms. Deploy any required uncovered events in Semantic Mapper.
For example, if the Validate Report shows that a selected Flow complete event for Login Success is missing from the Web platform, use Semantic Mapper to map and deploy that event, so the Login Flows metrics include the related activities of Web users.
-
-
(Optional) Set experience and performance settings.
-
Error Event: includes errors that matter in the defined flow.
Select error events from the drop-down list, or add them using the Event Looker Tool.
Conviva presets default errors, such as "5xx server error" and "app crash", allowing you to break down total errors by each error event in the Flow Preset dashboard.
To make error analysis more actionable, include custom error events that capture login-specific errors such as login errors during the login flow.
-
Network Request: associates the network request with a flow.
Click +Add Network Request,
-
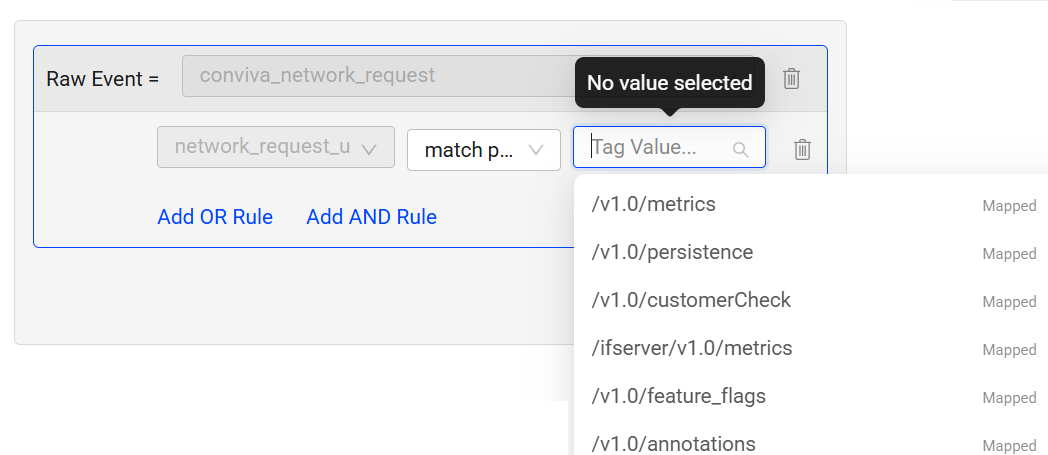
Select the condition from the drop-down
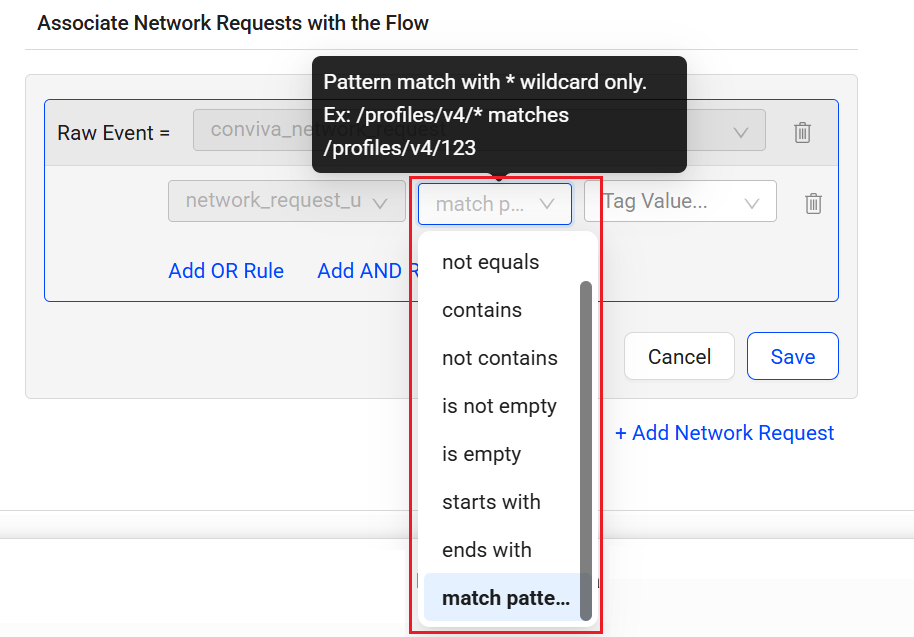
-
Select the Tag Value from the drop-down
-
(Optional) Click Add OR Rule to add a OR rule and select the Tag Key, Condition, and Tag value from the respective drop-downs.
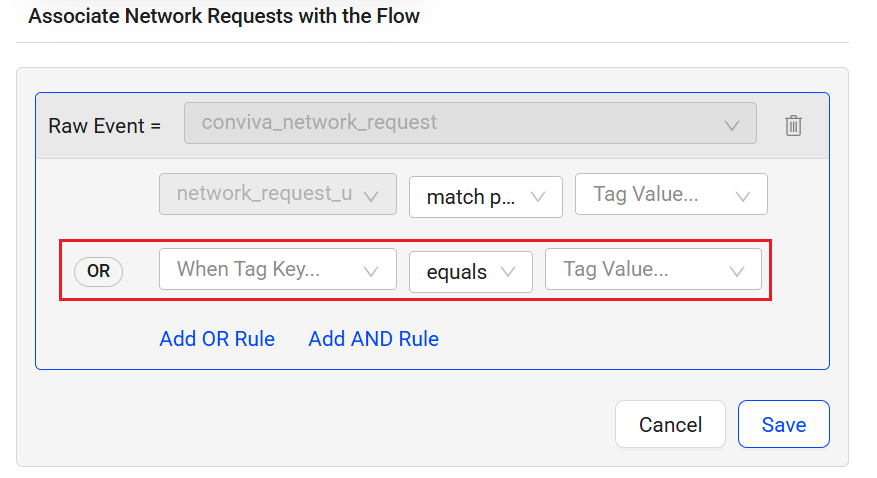
-
(Optional) Click Add AND Rule to add a AND rule and select the Tag Key, Condition, and Tag value from the respective drop-downs.
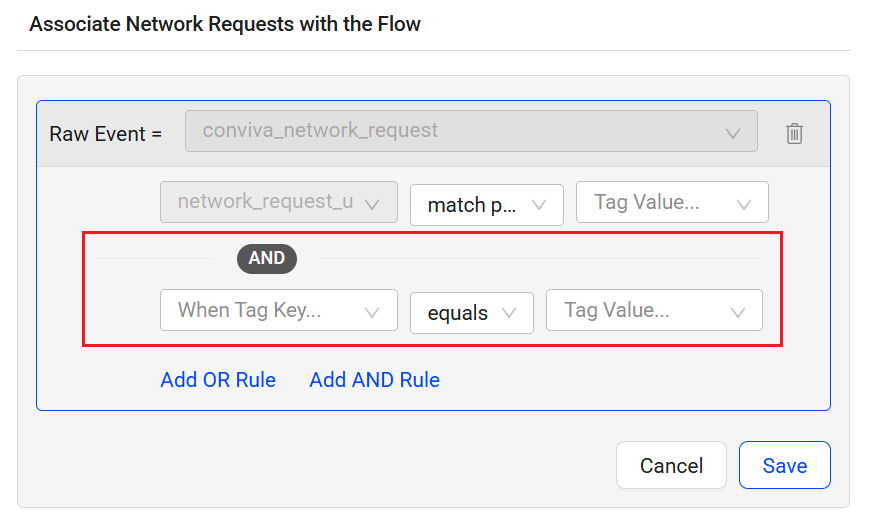
The system only considers the network requests that match these rules in the metrics including Network Request Avg Duration, Network Request Failure, and Network Request Count.
Note: The Flow Preset dashboard shows the associated metrics and dimensions.
Dimensions: Network Request Endpoint, HTTP Method, Response Code, URL Host, and URL Path
Metrics: Network Request Avg Duration, Network Request Failure, and Network Request Count
For efficient host-path selection, DPI automatically filters the path and host options, displaying only matching values. -
-
-
Configure Flow Widget, such as time constraint and distribution range.
-
Set the success time boundary which determines flow success.
For example, setting the login flow success to completion within 90 seconds, labels any flows that exceed 90 seconds unsuccessful.
-
For example, setting the custom metric duration limit to 60 seconds excludes any app sessions with durations that exceed the 60 second limit from the metrics.
-
Set the percentage thresholds to determine whether the success rate is considered Good or Poor.
Note: Success rate is calculated by dividing the total number of successes (initial events followed by a complete event within the defined time boundary) by the total number of initial events.
-
Define the expected value range for durations to display on the distribution chart. Toggle to distribution chart from the metric card Avg Duration in the Flow preset dashboard.
By default, DPI sets the maximum value to double the success time boundary, with the option to manually adjust the range. For example, setting the range to 0–120 seconds displays 40 bars representing the distribution of durations for each completion.
For example, to visualize acceptable user interaction times, set the duration range from 20 seconds to 200 seconds.
-
(Optional) From the Exclusion Event drop-down list, select an event to exclude sessions in which an unwanted event occurs between the starting and ending events.
For example, to measure how often returning users who provide a valid email and advance from the Email screen to either the Password page or the Account Recovery page without experiencing a Sign-Up reroute state, select sign-up from the list.
-
(Optional) Select one or more dimensions, specify the applicable events, and configure whether the first observed value or last observed value is used as the dimension value.
For example, to analyze payment Flow based on the first used payment type, select the payment_method dimension recorded on the Network Request event and choose First observed value. After this selection, the payment_method dimension uses the first value observed in the Flow, enabling dimensional analysis based on this payment type throughout the Flow.
-
-
Click Save and DPI creates the corresponding metrics automatically. For more details about flow metrics, see Flow Metrics.
Note: When updating flows, use the Keep historical data checkbox to control whether existing data is retained. Select the checkbox to keep the data, or clear it to remove it. The checkbox is selected by default.
Conviva supports associating predefined dimensions (Element Classes, Element Id, Element Name, Element Text, Element Type, Page Host, Page Path, Page Title, Page Referrer, Referrer Host, Screen Title, and Previous Screen Title) with Flow metrics, enabling drill-down analysis for Flow metrics. Conviva also automatically associates the related network request dimensions (Network Request Url Host, Network Request Http Method, Network Request Url Path, Network Request Response Code) with Flow metrics, excluding the Flow error metrics, to enhance the analysis of Flow performance. -
Click Deploy to use the metrics for analysis on the Trends dashboard.
For example, after deploying the metrics based on the 'search for playing videos' flow, go to the Trends dashboard to review the metrics and identify key insights for optimizing application performance and improving the user experience. An increase in the duration between the initial and complete events indicates slower performance while a decrease in success % indicates issues or blockers to user journey completion within the time constraint.
Creating and Activating Flow Dimensions
Custom dimensions are extracted from event keys to provide enhanced levels of dimensional analysis in Trends dimension tables and AI alerts. With custom dimensions, analyze application performance and user behaviors more efficiently and flexibly.
Create custom dimensions with values extracted from events to enhance your analysis of application performance and user behaviors, such as a dimension value extracted from only the play start and play end events.
When the event that a dimension is derived from is also part of flow events, it automatically becomes a flow dimension after deployment. Updates to either the dimension or flow events will determine if the association remains valid.
Review the association in either Flow Management or Dimension Management from the Management page.
-
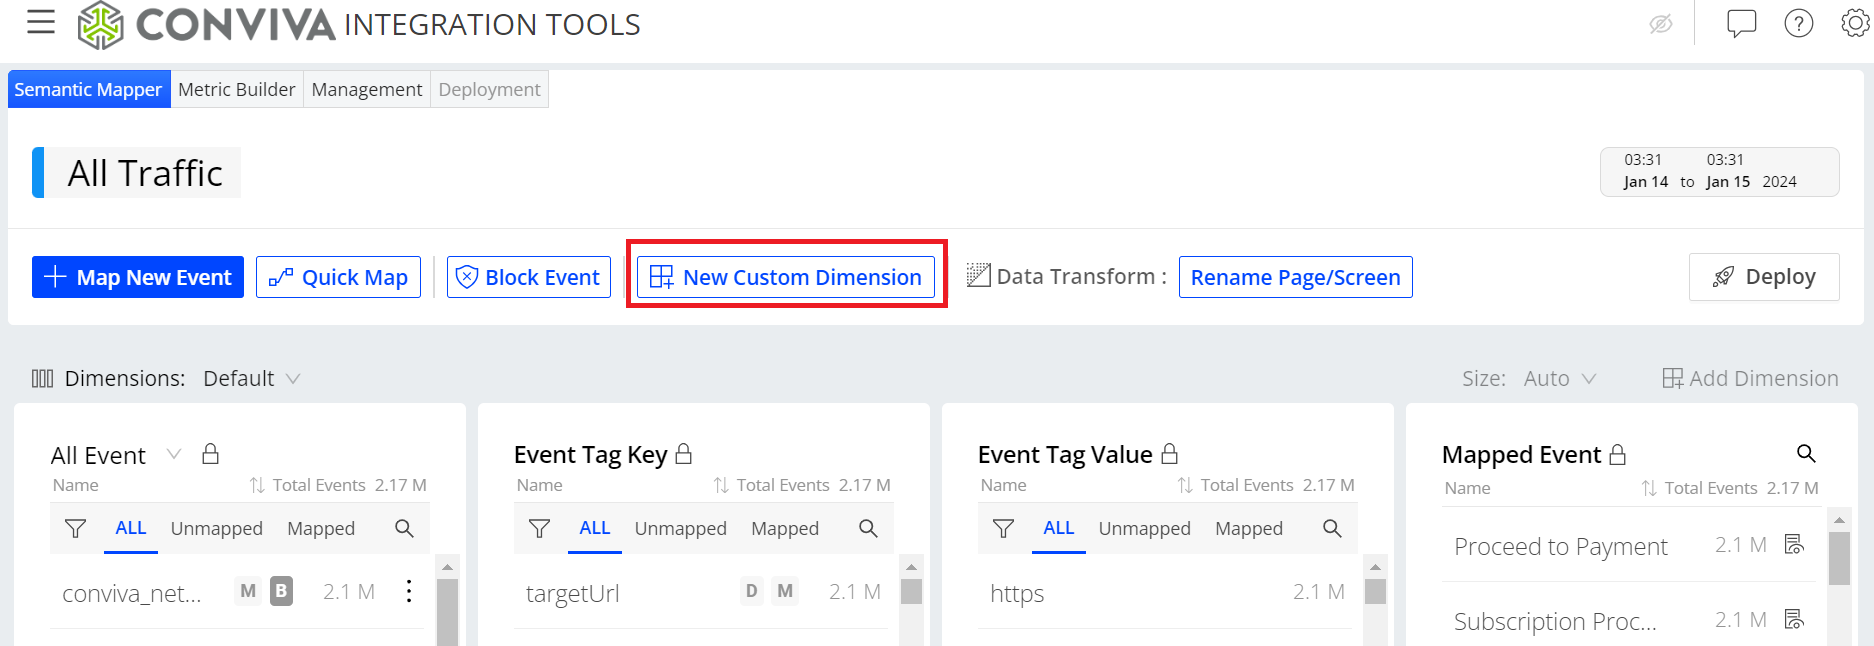
Click New Custom Dimension.
-
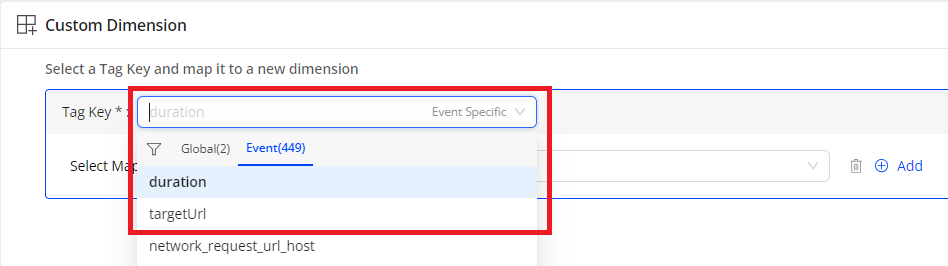
Select a tag key from the drop-down list or enter it directly.
The label next to the tag key indicates how it is collected:
-
Event-Specific Tag: The tag is only reported by certain events.
-
Global Tag: The tag is reported on all events as part of the global context.
Note: If the tag key you enter is not in the drop-down list, after entering it, you must select the event type which is event-specific.
-
-
Configure tag keys based on tag type.
Global Tags:
For persistent tag keys, select the tag key collected as global context to treat the tag as a global dimension.
Note: No event scoping is required. The dimension is automatically computed across all relevant traffic.
Event-Specific Tags
For tag keys collected only on specific events:
-
Select All applicable events to compute the custom dimension value using every event that reports the tag key.
-
Select Specific Mapped Event to compute the custom dimension value using only explicitly selected mapped events.
Note: Selecting a broader event scope increases the volume of computation and may impact cost.
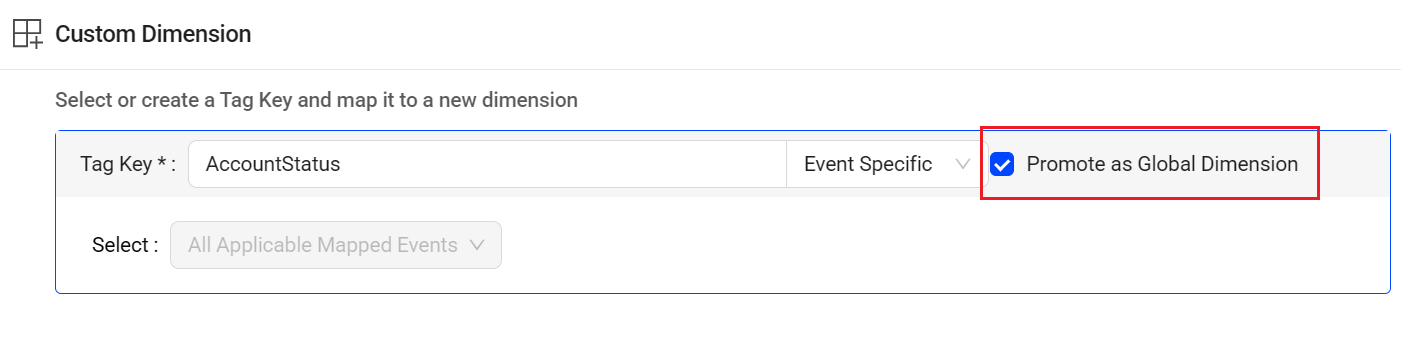
Advanced Option: Promote Event Tag as Global Dimension
For event-specific tag keys, enable Promote as Global Dimension to treat the tag as a global dimension.
When enabling this option:
-
The tag key is treated as a global dimension for all incoming traffic going forward.
-
The dimension value is derived from the earliest occurrence within a session.
-
After setting the tag key as a global dimension, the value remains the same for the duration of the session and does not update until:
-
A new session starts, or
-
A new flow record begins.
For example, the AccountStatus tag key is reported on account-related events. After enabling Promote as Global Dimension, the system treats AccountStatus as a global dimension and enables analysis of all related events within the session as dimension values, such as page views, clicks, and purchases, based on the account status value including upsell, silverPlan, and goldPlan, captured at the earliest point in the session.
-
Note: Promotion applies only to future data and does not retroactively update historical records.
-
-
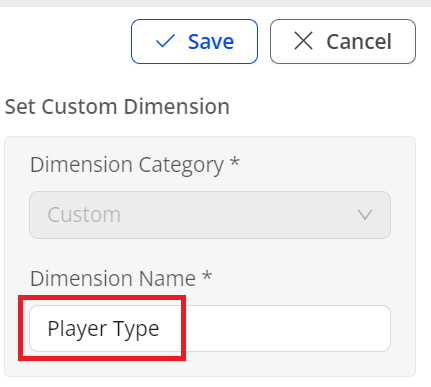
In the Set Custom Dimension field, set the dimension name. Click Deploy to deploy the created dimension.
-
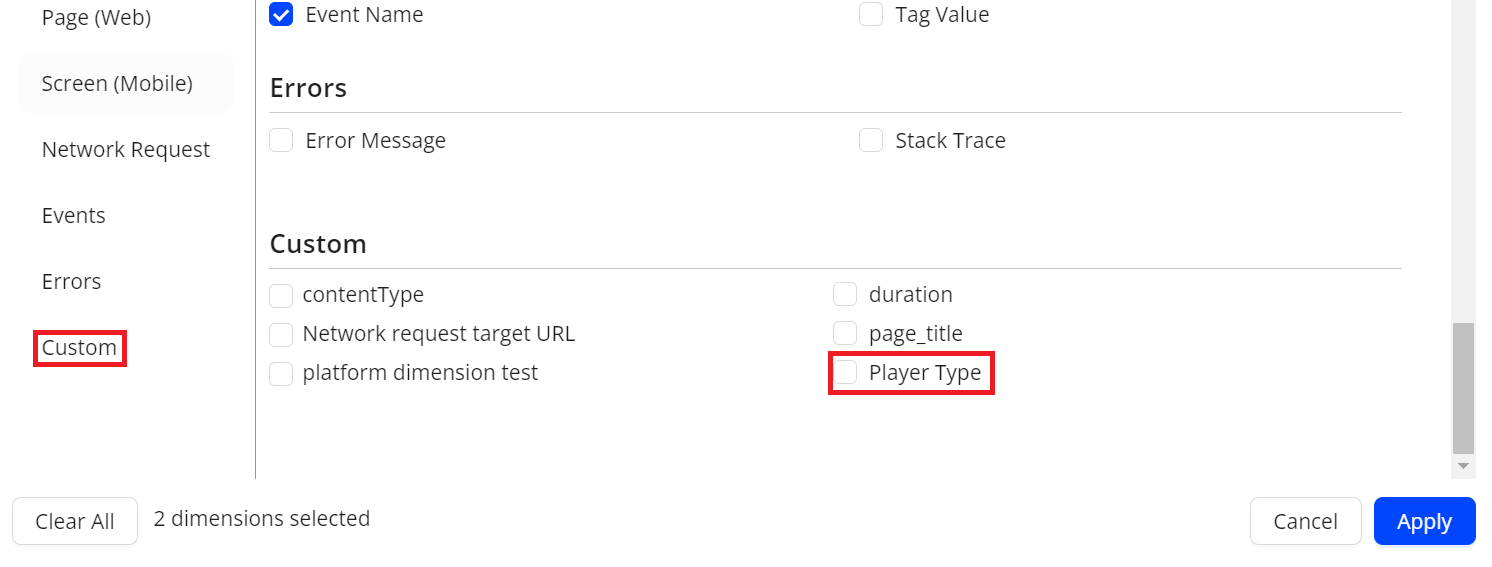
In the Trends dashboard, click + Dimension from the Dimension table, and check whether the created dimension is in the Custom list. Select the check box to apply the new dimension to the dimension tables.
-
(Optional) To edit a custom dimension, choose either:
-
Go to the Management tab, edit the custom dimension from the Custom Dimension table. For more information, check Management.
-
Go to the Semantic Mapper tab, select the desired custom dimension from the dimension drop-down list, click edit, and make necessary updates.
-
Managing Flows and Flow Dimensions
The Management tab allows you to effectively manage data such as metrics and events, including tasks for searching, reviewing, deleting, and deploying/undeploying to support your performance monitoring goals. The tab also allows you to do multiple selections of metrics, custom dimensions, and mapped events for deployment, undeployment, and deletion.
Open the Management tab, locate the flows or ccustom dimensions you want to manage, perform the management actions, such as clone, deploy to Pulse, undeploy, and delete.
For more details regarding the Management tab, see Management.
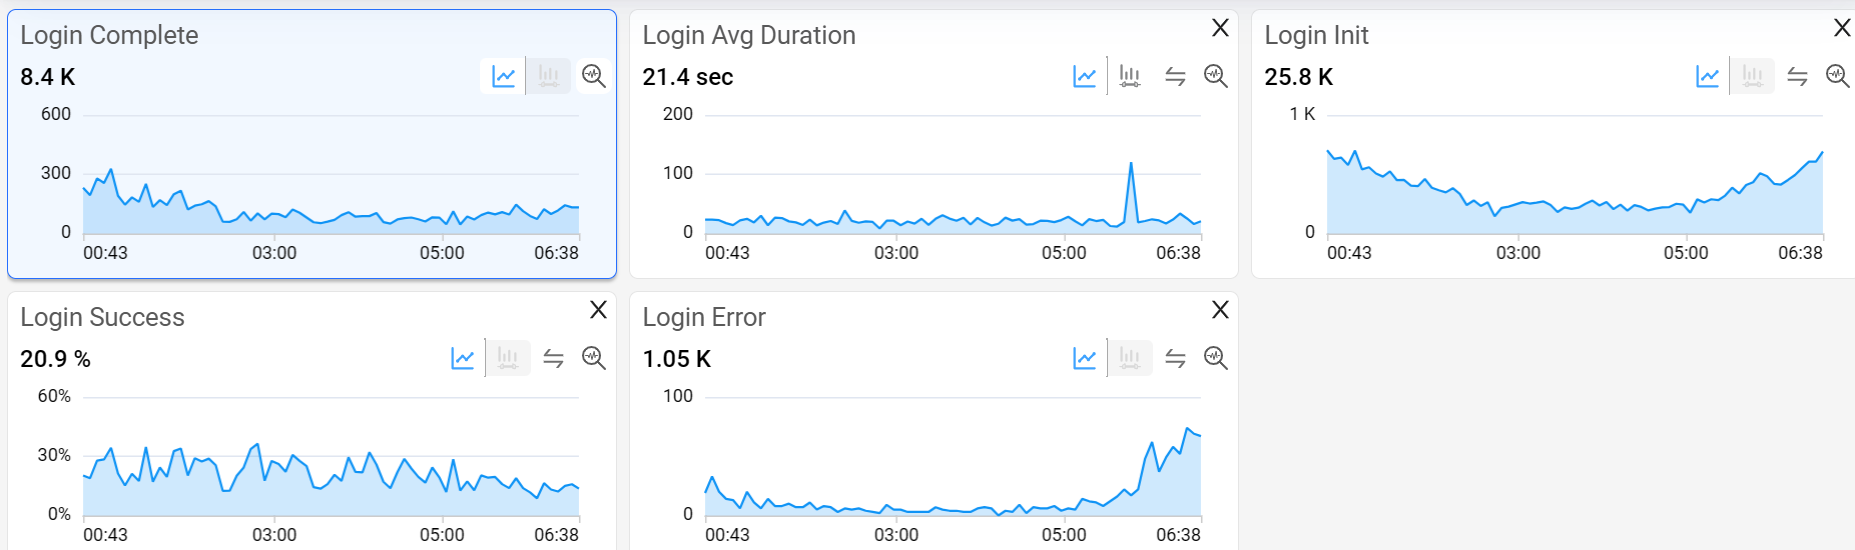
Using Flow Widget
The Flow widget enables you to select the most critical flow and displays its success rate in a gauge, along with key flow metrics and a link for detailed analysis. The widget helps you monitor the performance of the selected flow and drill down to a Flow Specific Dashboard for deeper insights.
The gauge provides a quick view of the flow’s performance based on the success rate defined in Activation. For example, if the gauge shows 71.2%, it indicates that 71.2% of flows meet the success time boundary defined in Activation among all initiated flows.
With the Flow widget and other widgets under the Summary tab, you can efficiently track all business KPIs in a single view, optimize application performance, and enhance the user experience.
To quickly check the event composition, click the information icon in the Flow Widget. For further flow details, click the flow name link to display the Activation flow detail page.
Use Metric Builder to create up to three Flow widgets. For how to create a flow, check Creating and Activating Flows.
Image: Flow Widget
Drill Down to Flow Specific Dashboard
To perform detailed analysis of the flow, click the Drill Down icon to access the details view of the selected flow. The details view, by default, loads all metrics belonging to the flow. Switch to focus view to expand each metric card, similar to how the Trends dashboard works.
Dimension analysis defaults to loading global dimensions, such as platform and app name. Add other dimensions from the Dimension panel to perform drill-down analysis and identify improvement opportunities.
Flow metrics can break down by all global dimensions, such as GEO, ISP, and Device, and global tags configured in Activation. Flow metrics are also linked to event tag dimensions when the tag is reported by flow events.
Errors that happen during flows include 5xx errors and app crashes by default. Conviva allows you to add other errors from Activation. The default error msg dimension captures errors from app crash.
Flow errors can break down into configured flow error events and custom error dimension. On the Flow Specific Dashboard, toggle to % to view the percentage of total errors divided by the total number of initial events, showing the percentage of flows with this issue. Toggle to %T to see the error distribution percentage across different error types.
DPI Custom Metrics DPI Custom Metrics DPI Metric Template DPI Metric Template metric builder metric builder Preview Preview flow flow flow metrics flow metrics