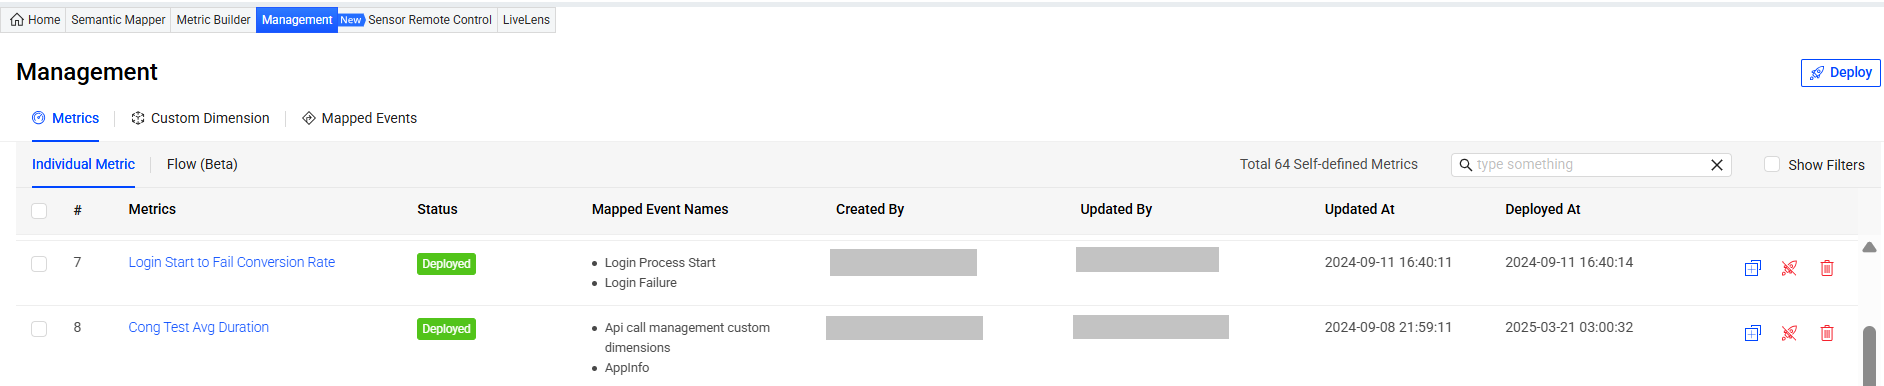
The Management tab allows you to effectively manage data such as metrics and events, including tasks for searching, reviewing, deleting, and deploying/undeploying to support your performance monitoring goals. The tab also allows you to do multiple selections of metrics, custom dimensions, and mapped events for deployment, undeployment, and deletion. Click Download for exporting Management data in xlsx format, enabling easier auditing of Activate changes.
Metrics
Custom metrics are created based on mapped events. With custom metrics, analyze application performance and user behaviors more efficiently and flexibly.
The Metrics tab allows you to easily review created custom metrics and associated details such as status, mapped events, and updates made by users.
Searching Custom Metrics
To quickly find a custom metric, enter a portion of its name. For a more refined search, select the Show Filters check box and select the filter conditions to match the desired metrics.
Mapped Events
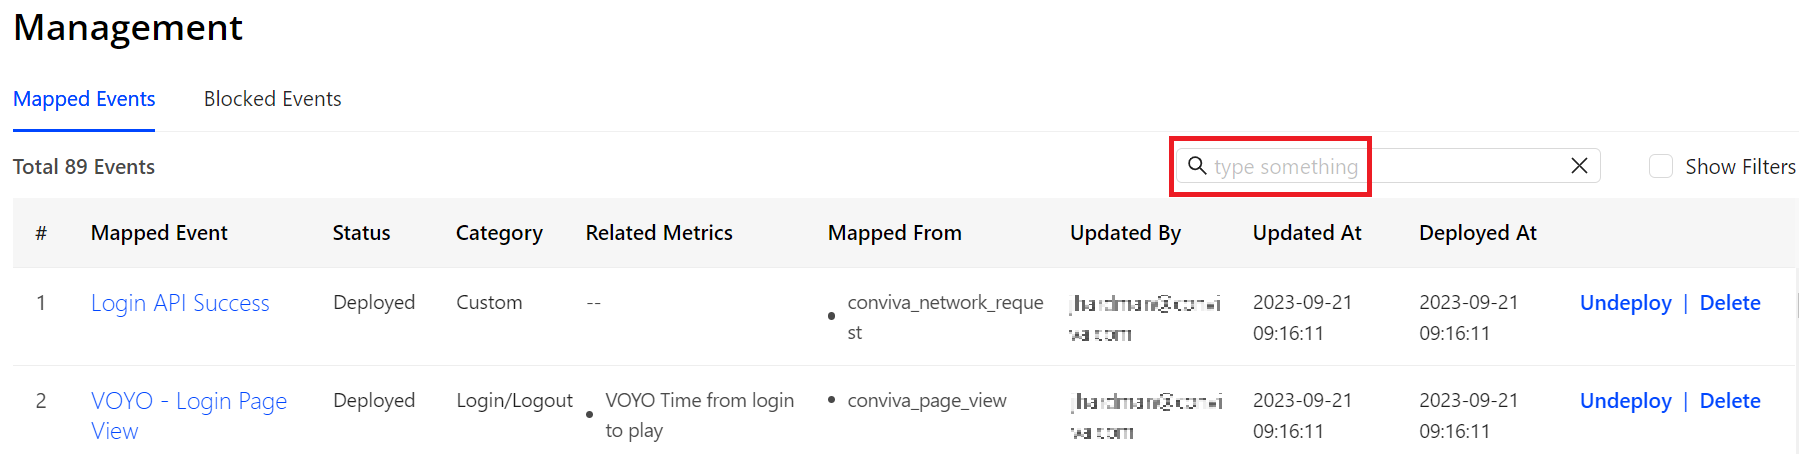
Use the Mapped Events table to easily review the current mapped events names and associated details such as status, category, and related metrics. You can also perform various management actions to optimize the mapped events, such as undeploying and deleting unused events.
Searching Mapped Events
-
To quickly locate a mapped event, simply enter part of its name.
-
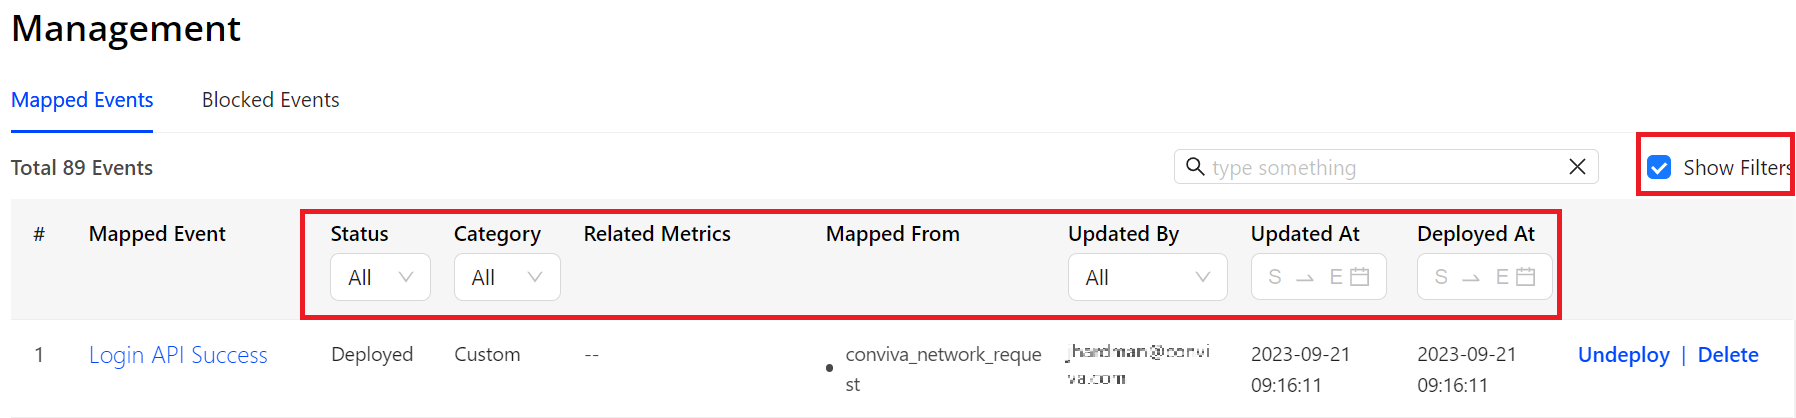
For a more refined search, select the Show Filters check box and select the filter conditions to match the desired events.
Editing Mapped Events
If the mapped event is unsuitable, you can directly update the mapped event in the Management tab.
-
Find the mapped event you wish to modify and click its name.
-
The pop-up window displays event details. Click Edit, edit the event, such as the name, category, and mapping rules, and click Save Changes.
Custom Dimension
Custom dimensions are extracted from event keys to provide enhanced levels of dimensional analaysis in Trends dimension tables and AI alerts. With custom dimensions, analyze application performance and user behaviors more efficiently and flexibly.
The Custom Dimension tab allows you to easily review created custom dimensions and associated details such as status, mapped tag keys, and updates made by users. You can also perform various management actions such as deploying or undeploying each dimension, as well as editing and deleting these dimensions. Create custom dimensions using Semantic Mapper.
Note: Deleting a dimension that is already used in dashboards or filters results in the dimension becoming unavailable for further use. Additionally, pop-up messages appear in dashboards and filters after deletion.
Searching Custom Dimensions
To quickly find a custom dimension, enter a portion of its name.
Editing Custom Dimensions
To make updates to a custom dimension, such as modifying its name or tag key.
-
Locate the custom dimension you want to edit.
-
To access the pop-up window for editing, click the custom dimension name.
-
In the pop-up window, click Edit, make the necessary changes, and click Save Changes.
Dimension changes apply to data after the changes are saved and do not impact historical data.
Cloning Metrics, Dimensions, and Events
To simplify the process of creating metrics, dimensions, and events similar to existing ones, you can start with a clone of an existing settings and modify only the required changes.
-
Click the Clone icon in:
-
Tables for the Metrics, Custom Dimensions, and Mapped Events in the Activation dashboard Management tab
-
Metric, Custom Dimension, or Mapped Event Details pages
-
-
Click Save to apply the updates.
Management tab Management tab Clone Metric Clone Custom dimension Custom dimension Custom dimension mapped events