The User dashboard enables you to drill down into session timelines for a comprehensive and granular analysis of a session. For example, analyze a session, including application error events, to identify the causes behind app crashes.
-
Client ID: Get all data in the selected period, including the data occurring before users log into the application successfully.
-
User ID: Get the data occurring from the time when users log into the application successfully to a session end.
Note: The User dashboard displays 5,000 events in the User Timeline section by default. For more details about user sessions, see User Session Metrics Explained.
The Users dashboard provides access to session and Flow-based timelines for detailed user activity analysis:
-
Summary Section: Select the Show Summary check box to display detailed user information and event summaries.
-
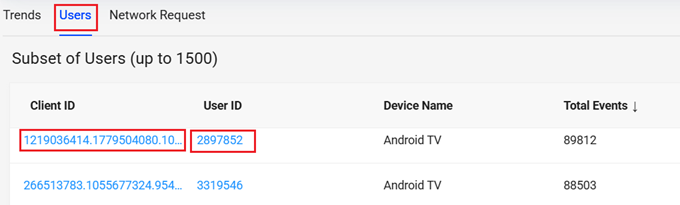
Session-based Timeline: In Trends, click a User ID or Client ID. In Users dashboard, enter a User ID or Client ID.
-
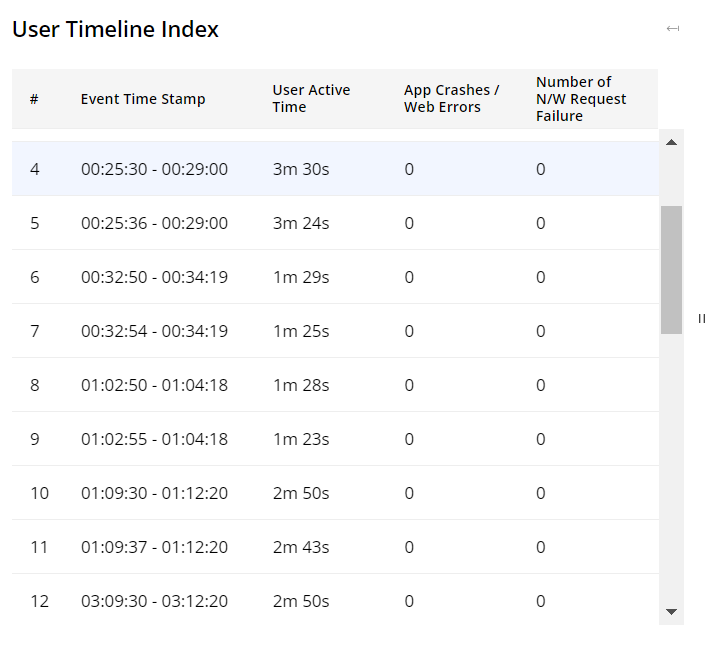
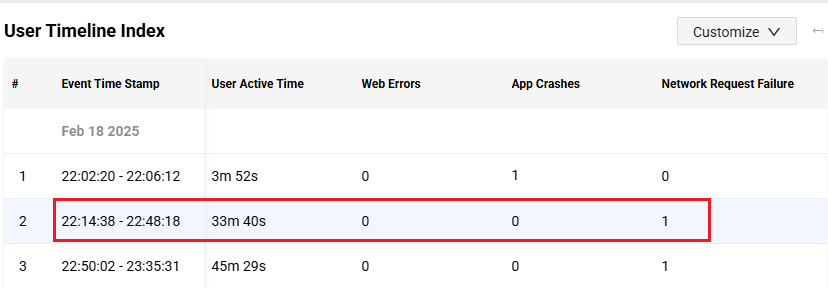
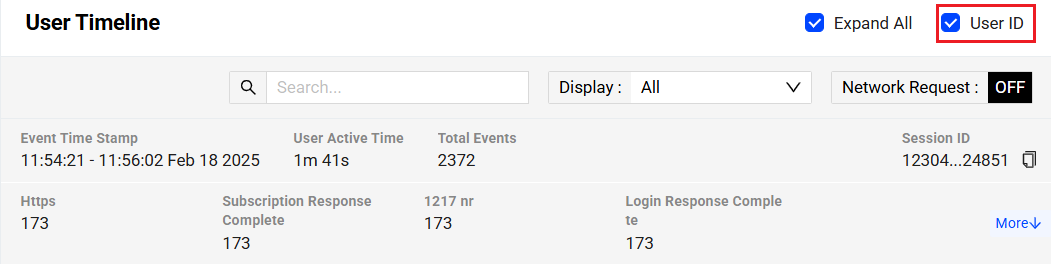
User Timeline Index: Show all sessions within the selected time range in the time picker, along with metrics such as User Active Time, App Crashes/Web Errors, and Number of Network Request Failures.
-
User Timeline: Select an event time stamp in User Timeline Index, detailed messages of the event time stamp and all events in the time stamp display in User Timeline.
-
-
Flow-based Timeline: In Flow Preset dashboard, click a User ID or Client ID.
-
Flow Timeline Index: Show all flows within the selected time range in the time picker, along with default dimensions and metrics. Use the Customize drop-down list to add more items to the index table.
-
User Timeline: Select a Flow timestamp in the Flow Timeline Index, the User Timeline displays the detailed messages for that timestamp and all associated events in the Flow with labels for the initial event, complete event, and error event are labeled.
-
Summary Section
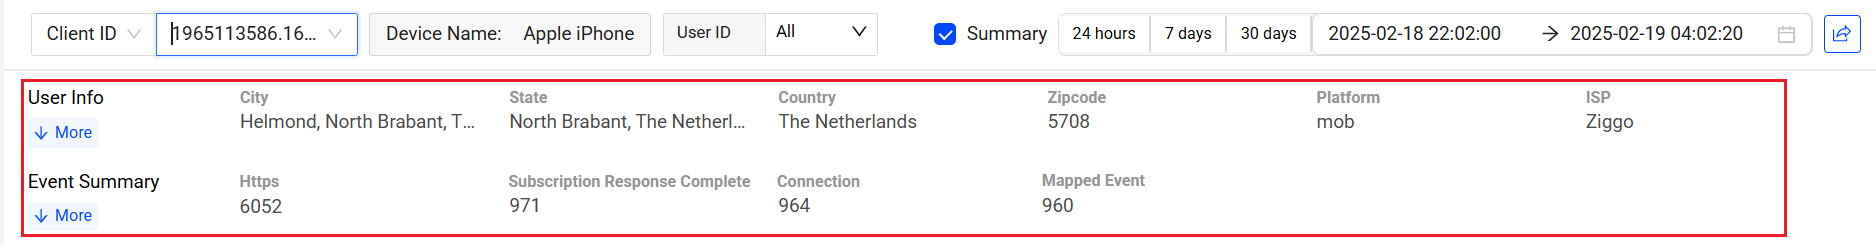
The Summary section appears after selecting the Show Summary check box. The Summary section enables you to check user information, such as region, and event summaries, such as the number of bad events.
Click Show more and Show less to expand and collapse the displayed messages in the section.

For Session-Based Timeline
The User Timeline Index allows you to view all sessions within the selected time range in the time picker, along with metrics such as User Active Time, App Crashes/Web Errors, and Number of Network Request Failures. Use the Customize icon to add specific event-related metrics and dimensions for detailed analysis.
Note: The Custom Metrics selection in the User Timeline Index shows only event aggregation type custom metrics. Other types of user-defined metrics are shown in the Trends User tab.
To open the User dashboard from the Trends, Paths, and Funnels, click the User ID or client ID. Also, you can right-click the User ID or client ID to open the User Dashboard in a new browser tab or window.
Note: After clicking a User ID or Client ID in Paths or Funnels, sessions with events and global filters passed from Funnels and Paths are labeled with Contains. Hovering over the Paths/Funnels filters column name shows detailed context carried over from Path and Funnel.
Accessing the User dashboard from Trends displays the User Timeline Index with the impacted sessions according to the Trends filter settings.
Click an event time stamp to display detailed messages and all events within that time stamp in User Timeline.
User Timeline
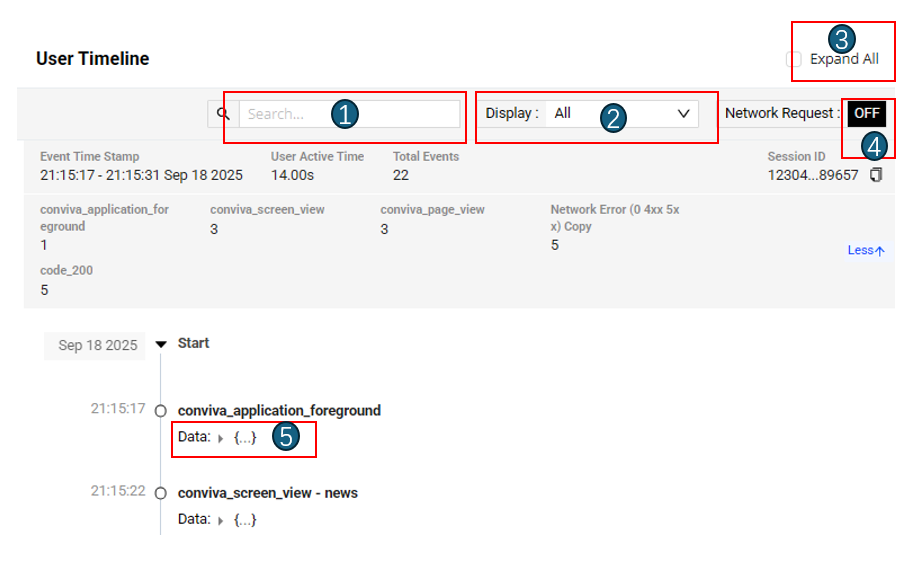
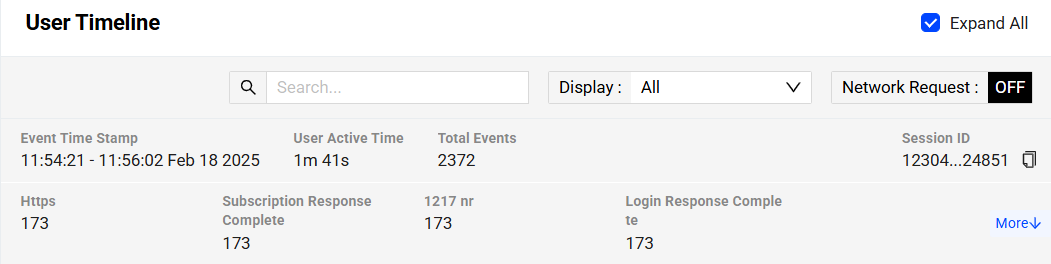
The User Timeline enables you to view detailed messages of an event time stamp and all events within that time stamp by clicking the time stamp in User Timeline Index.
Use the User Timeline options for detailed analysis:
(1) Search Events: Use the Search input box to input keywords. All events matching the keyword are highlighted for easy identification and navigation.
(2) Filter Events: Specify the events you want to focus on by selecting them in the Filter selection box. Only the chosen events are displayed, streamlining your analysis process. Click Clear All or Select All to filter events more efficiently.
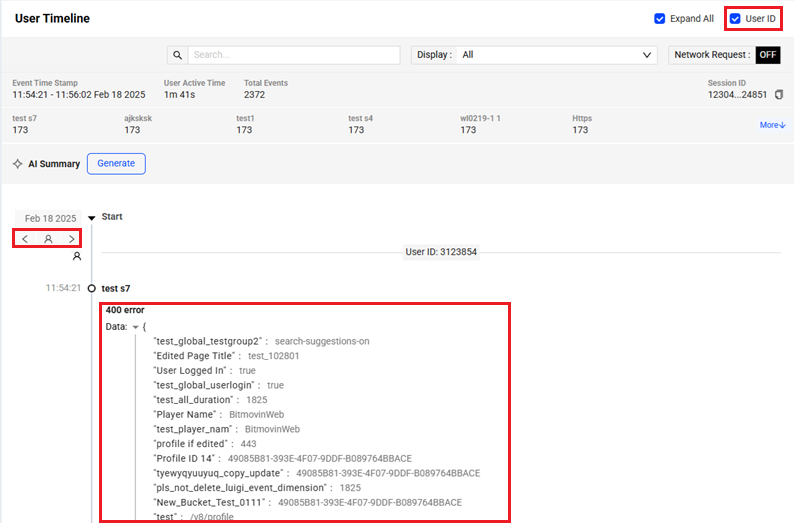
(3) Expand All Events: Select the Expand All check box to expand all events. Clear the check box to collapse all events.
(4) Toggle Showing Network Requests: Turn on the network requests toggle, the conviva_network_request events appear in the event list of the Filter selection box. Select the conviva_network_request checkbox to view these events in the Event section. Disabling this option hides the conviva_network_request events.
(5) Collapse and Expand Events: Expand or collapse event data by clicking the Expander icon next to Data. This function provides a condensed or detailed view of the event data, such as Error Message, and ANR reason. Similarly, clicking the Collapse icon can minimize all event data.
For Flow-Based Timeline
The Flow Timeline Index shows all flows within the time range selected in the time picker, along with details such as Conversion Status, Duration, and Contains Error. Use the Customize icon to add specific Flow-related metrics and dimensions for deeper analysis.
To open the Flow-based timeline, in Flow Preset dashboard, click a User ID or Client ID.
Click a row representing a Flow instance to view the corresponding events and messages in the User Timeline.
User Timeline
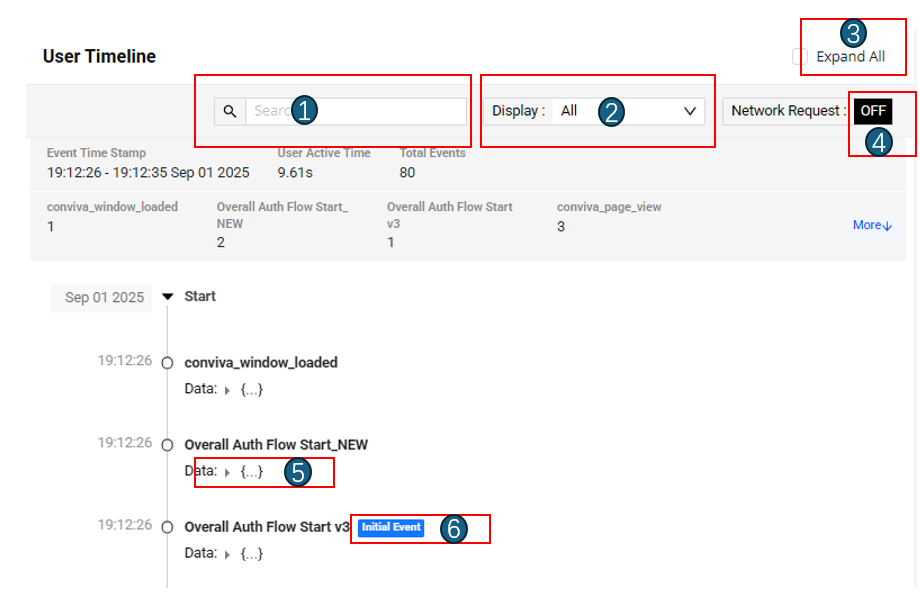
Select a timestamp in the Timeline Index, and the User Timeline displays detailed messages and all events that occurred during the flow’s time window, from start to end.
Note: Depending on the selected flow record from the Flow Index, the flow timeline may end with a Complete Event or with other events if the user-configured flow duration limit is reached.
Use the User Timeline options for detailed analysis:
(1) Search Events: Use the Search input box to input keywords. All events matching the keyword are highlighted for easy identification and navigation.
(2) Filter Events: Specify the events you want to focus on by selecting them in the Filter selection box. Only the chosen events are displayed, streamlining your analysis process. Click Clear All or Select All to filter events more efficiently.
(3) Expand All Events: Select the Expand All check box to expand all events. Clear the check box to collapse all events.
(4) Toggle Showing Network Requests: Turn on the network requests toggle, the conviva_network_request events appear in the event list of the Filter selection box. Select the conviva_network_request checkbox to view these events in the Event section. Disabling this option hides the conviva_network_request events.
(5) Collapse and Expand Events: Expand or collapse event data by clicking the Expander icon next to Data. This provides a condensed or detailed view of the event data, such as Error Message, and ANR reason. Similarly, clicking the Collapse icon can minimize all event data.
(6) Labelled Events: Display Flow-related event labels (Initial event, Complete event, Error event) to highlight Flow progressions.
Using the User Dashboard
User Dashboard summarizes user information and events based on selected Client or User IDs. This functionality analyzes app behaviour by aggregating user activity data, application insights, and system performance.
To open the Users Dashboard,
-
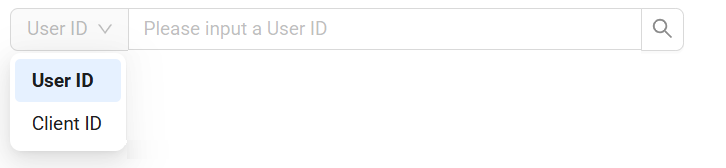
Click the Users tab and enter the User ID or Client ID.
OR
Navigate to the Users tab in the DPI Trends dashboard.
Note: The metrics calculations use client IDs to ensure more accurate metric data. However, Conviva does not recommend this dashboard for metric analysis.
-
Select the Users tab and click a Client ID or User ID to see the user dashboard.
On selecting the client ID,
-
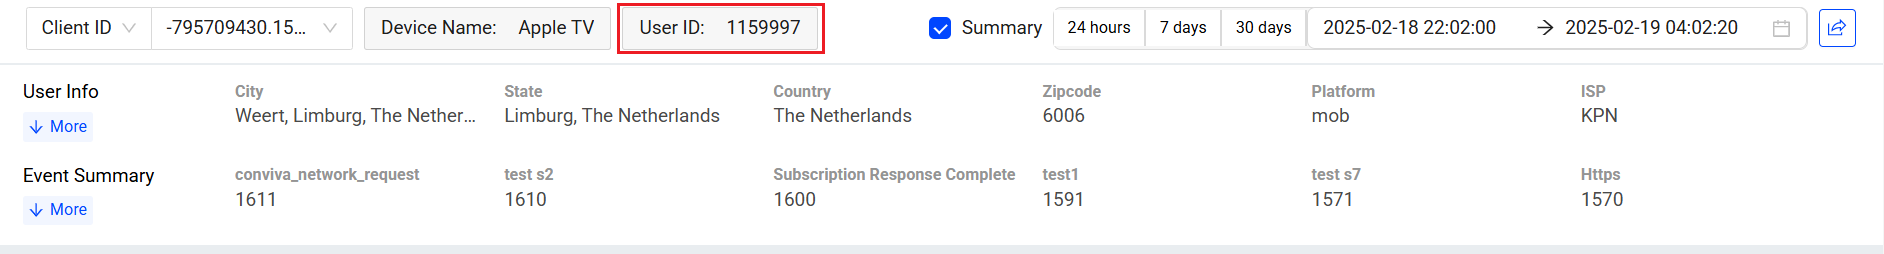
If only one User ID is associated with the client ID, the User ID box is greyed out and non-clickable.
-
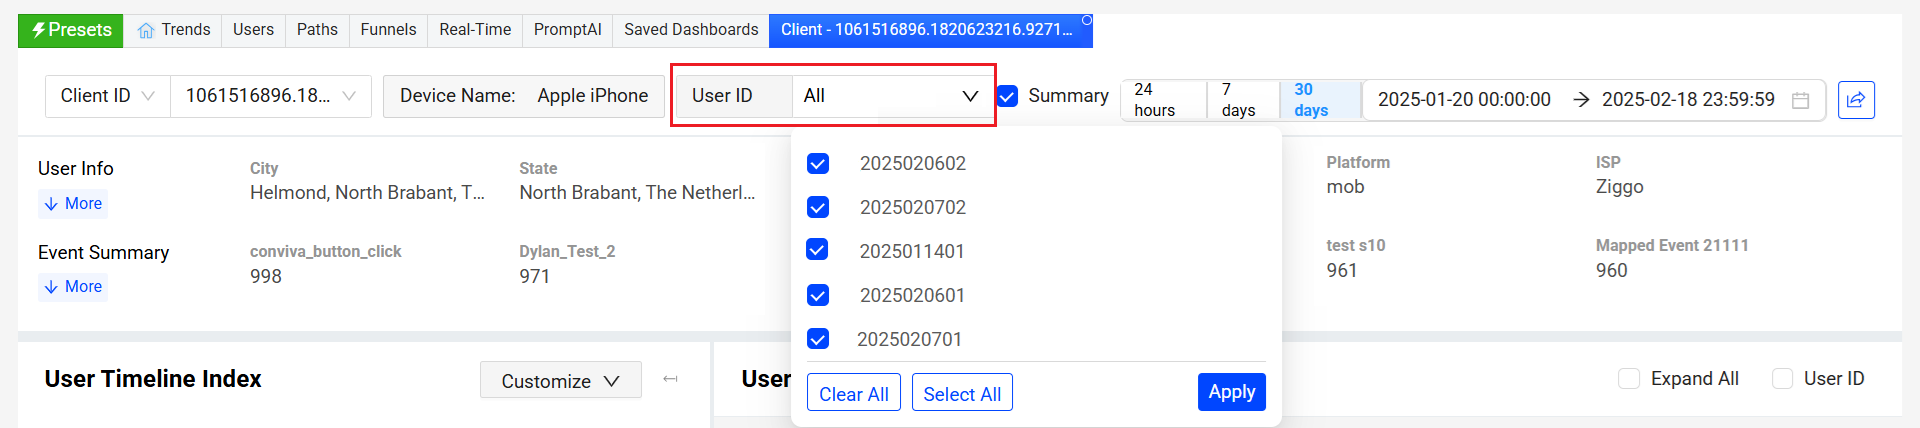
If more than one User ID is associated with a client ID, the User ID drop-down shows all the User IDs associated with the Client ID.
-
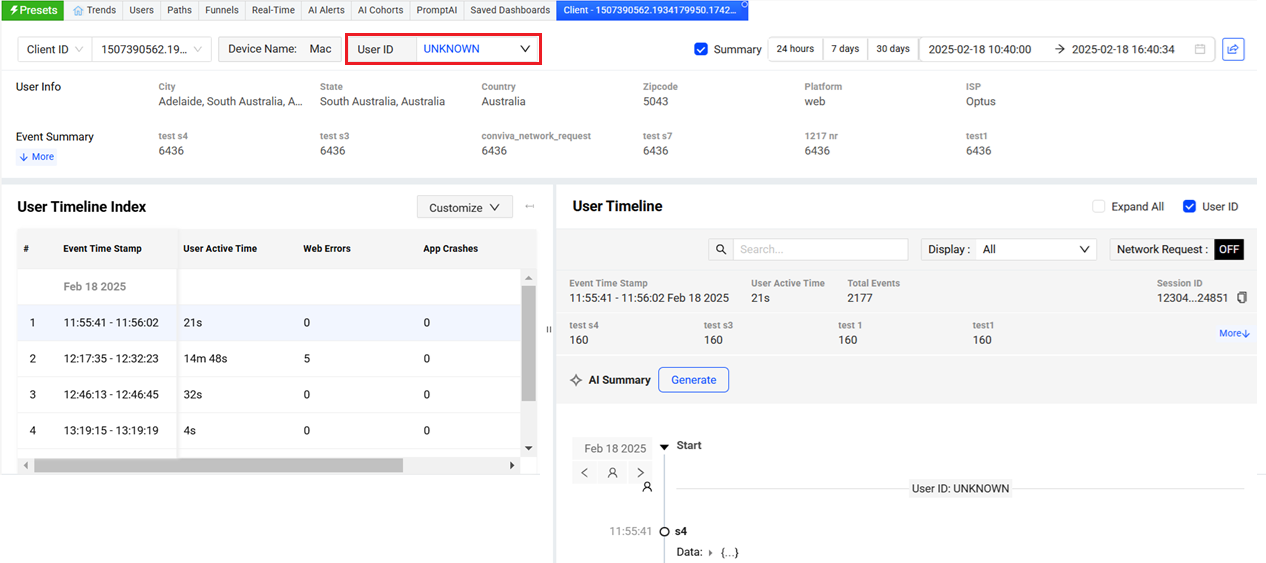
If the user ID is UNKNOWN, it indicates an anonymous user without a login.
-
-
Select the User IDs to see the sessions from selected Client IDs and User IDs in the queried time range. Check the summary of user information and event summary, such as region and the number of successful network request.
-
Check the User Timeline Index messages, focusing on error messages such as App Crashes and the number of Network Request Failures. Click an event time stamp to see the User Timeline details.
-
The User Timeline captures events and their timestamp details. To analyze application behaviour, monitor these records and focus on essential data, for example, 400 errors.
-
If only one user ID exists, the User ID checkbox is not visible.
-
If multiple user IDs exist, select the User ID checkbox to display the timeline details of all users with their respective IDs next to the timeline.
-
-
Click the right or left arrow to toggle between users' timelines to analyze the application behaviour.
Sharing a User Dashboard
You can share a User Dashboard with other DPI users.
-
Click the Share icon to the right of the time picker in the User Dashboard.
-
Click Copy to clipboard to copy the link and share it with others, allowing them to view the same User dashboard within the same time range.
User Timeline User Timeline