AI Alerts
AI alerts is an advanced feature that eliminates the need to determine the sensitivity, identify the relevant dimensions that you need to monitor, and set manual alerts to notify related individuals and groups.
The Conviva AI Alerting system continuously checks for anomalies and computes a baseline along with a range of variation for the metric(s) based on the mean and standard deviation derived from historical data. This range of variation is then used to evaluate the traffic in the past few minutes. If the upper boundary range or threshold is exceeded, an anomaly is detected, which then triggers the diagnosis process to determine if an alert should be fired based on the sensitivity control settings and the root cause of the event. To avoid duplication of alerts, the AI alert system suppresses the same alert from firing for up to 1 hour.
For each generated alert, the system provides the sessions that attributed to the dimension (or set of dimensions) associated with the root cause of the alerts and the views that were impacted due to the alert.
Each AI alert is assigned an alert severity (Info, Warning, Critical) that can help you determine the impact of the alert condition. By default, all alerts fire with the Info severity until the thresholds for Warning and Critical are set. As alerts fire, the AI Alerts page displays the alerts totals for each severity level and related metric, and continuously updates the totals as the alert conditions change. When an alert condition returns to the accepted range of variation and sensitivity control limits, the AI alert ends and is listed in the Alert Ended totals to indicate that the alert condition cleared. The specific threshold for each severity level is configured in the sensitivity controls. For more details on setting the sensitivity controls, see AI Alert Sensitivity.
Conviva DPI enables you to integrate manual alerts and AI alerts with PagerDuty, enhancing Conviva's advanced DPI alerts with PagerDuty escalation management and notifications. To integrate Conviva alerts with PagerDuty services, you need a PagerDuty account with configured services. For more details, see Conviva PagerDuty Integration Guide for DPI.
Note: DPI adds a five-minute AI alert buffering period after an alert condition ends to suppress frequent re-generation of the same alert. The buffering period briefly prolongs alert ending to minimize instances of closely spaced alerts due to temporary metric fluctuations around the alert thresholds.
The alert totals show the alerts for the last 30 days.
This topic includes the following sections:
- Viewing AI Alerts List
- Searching AI Alerts
- Viewing AI Alerts Diagnostics
- Impacted Sessions Due To Alert
- Webhook Integrations
Note: AI Alerts currently support only the duration and failure conversion metrics, and the other metrics in the selection screen are temporarily disabled.
This feature offers automatic anomaly detection and fault isolation across the following key metrics and key dimensions:
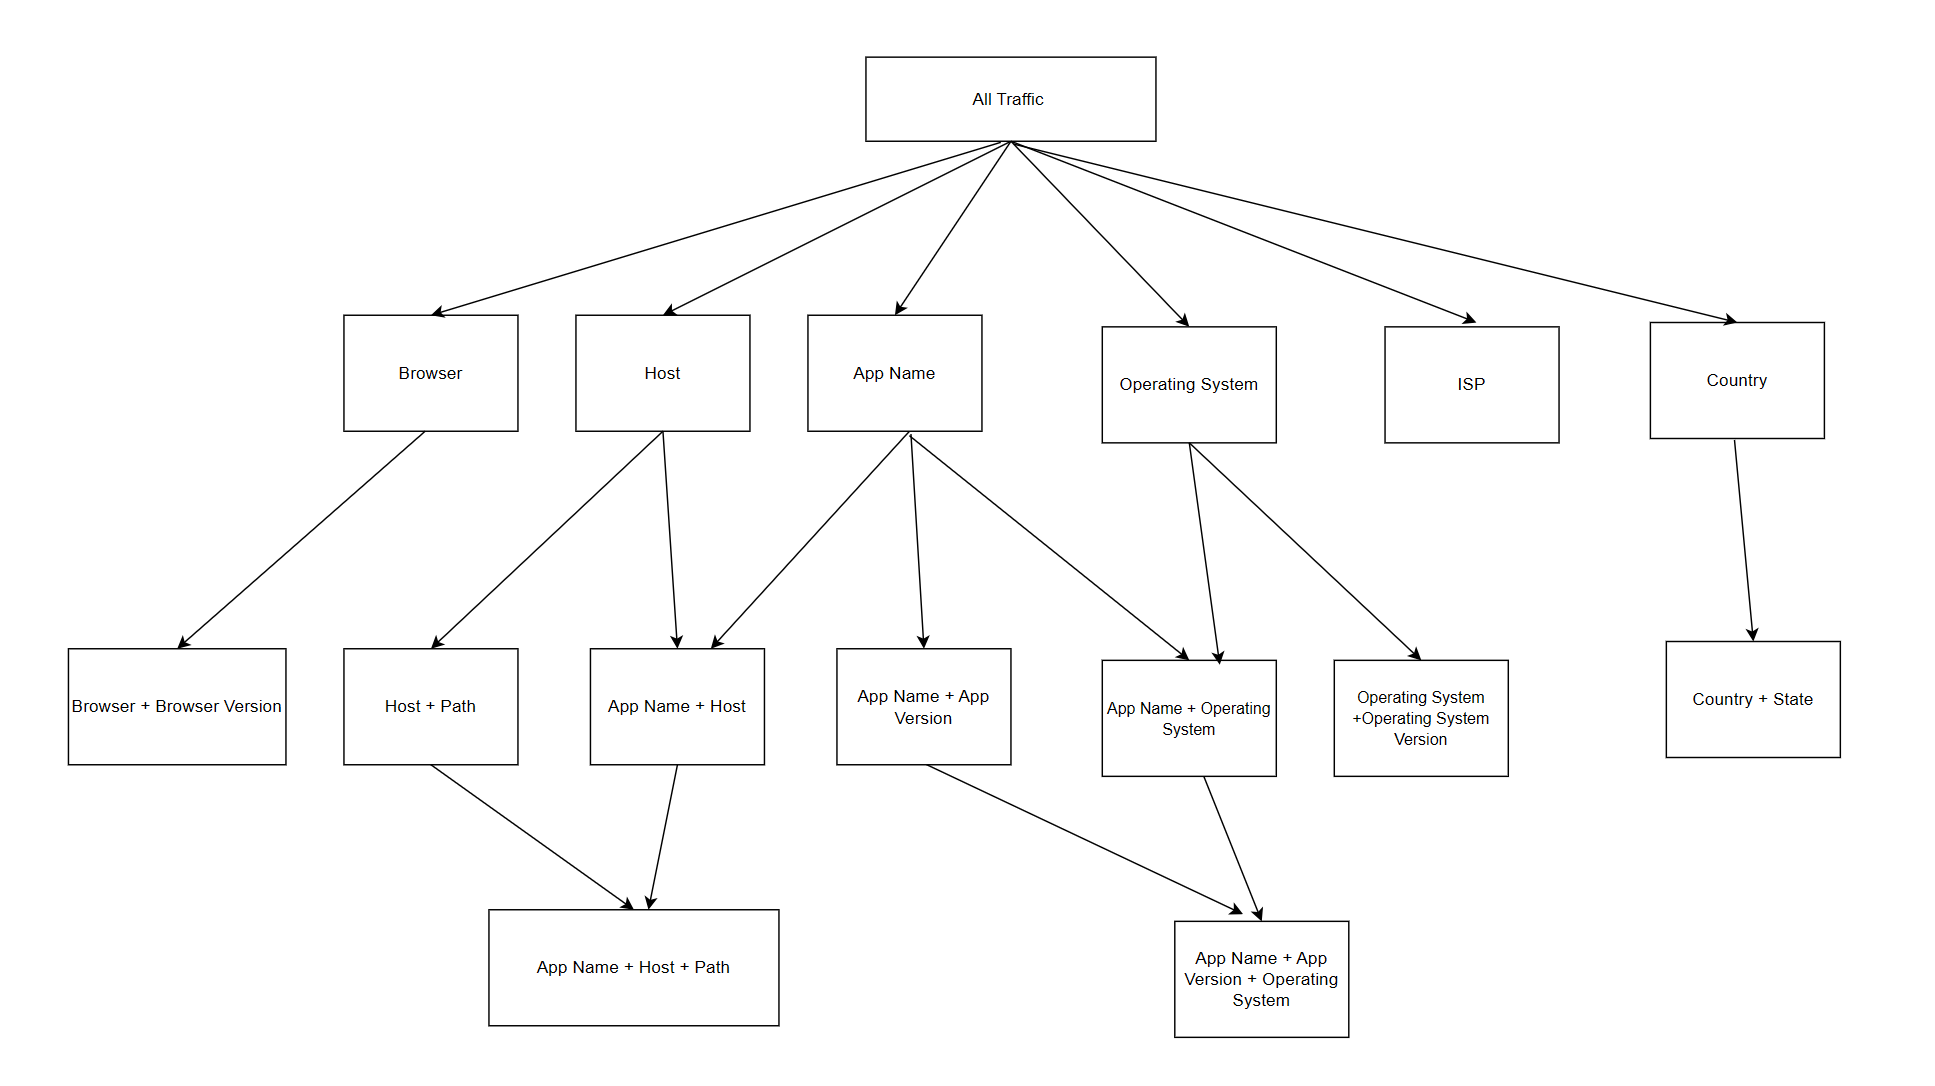
Directed Acyclic Graph of Dimensions
If you want to monitor the custom metrics or flow metrics, click Metrics, select the specific custom metrics or flow metrics, and click Apply.
Minimum Activity Requirements for DPI AI Alerts
DPI AI alerts require a minimum activity of 15 units of the alerted metric's secondary metric to qualify for AI alert processing. For example, an AI alert for Mins with High Network Response Duration requires at least 15 network requests before the AI alert system processes the alert condition.
| AI Alert Metric | Required Secondary Metric Minimum Activity |
|---|---|
| Mins with 0, 4xx, 5xx Network Request Response Code | 15 Network Request Count |
| MIns with High Page Load Time | 15 Page Load Completes |
| Mins with High Screen Load Time | 15 Screen Loads |
| Mins with High Avg Network Response Duration | 15 Network Request Count |
| Flow/Custom Metrics | |
| For Flow and duration custom metrics, such as Search Time to Video Play | 15 Search Time to Video Play Complete # (The number of times both the initial and follow-up events were performed is 15, based on the successful and failed pairs from the first initial event to the first follow-up event.) |
| For Flow and conversion custom metrics, such as Login Start to Complete Conversion Rate | 15 Login Start to Complete Conversion Rate Init # (The number of times the initial event was performed is 15) |
Viewing AI Alerts List
-
To view the AI Alerts summary page:
- Log in to DPI and select AI Alerts
- Click on the Alert Bell in the header of the interface. The number next to the bell indicates the total number of AI alerts that fired today.
The AI Alerts page shows the total number of fired alerts along with the alert totals by severity level and metric for up to the last 30 days.
Note: There may be a potential delay of up to 3 to 5 minutes between issue occurrence and alert notifications.
-
To filter the alert display for that combination of severity and metric, click a severity level or metric total. For example, filter alerts for specific severity levels (Critical and Warning) and metrics (Avg Network Request Duration).
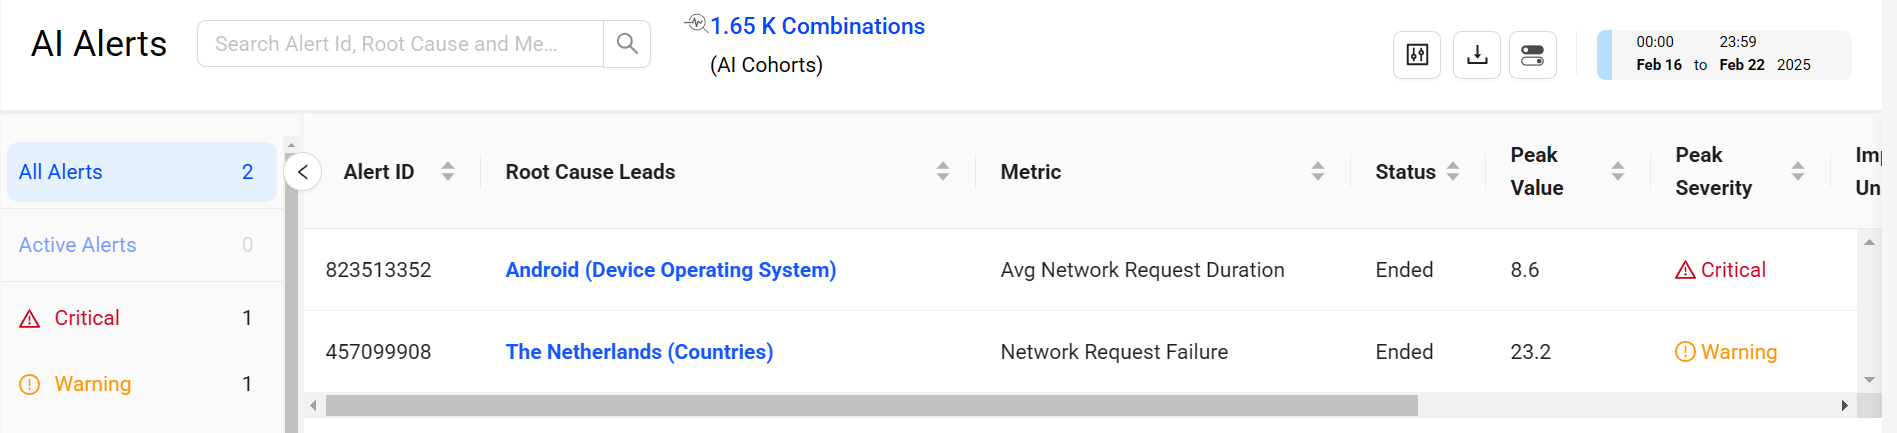
Each alert instance provides following AI alert information:
- Alert Id: Unique Id of the alert.
- Metric: Name of the metric for which the AI alert fired.
- Root Cause: Dimension(s) that caused the AI alert to fire.
- Status: Ended, Active
- Peak Severity: Critical, Warning, Info
- Impacted Uniques: The cumulative total of devices impacted by the issue at the time the AI alert fired. (Not available for the new beta customers)
- Duration: The complete duration of the alert.
- Time Alert Fired: Date and time that the AI alert fired, linked to the detailed Diagnostics page for the alert.
-
Impacted Count: Displays the value of the incremental impacted count. For details about incremental impacted count calculations, see AI Alert Senstivity.
By default, the alert instances are sorted by time the alert fired, with the most recent instances at the top. You can also customize the alert display by clicking on a column name, severity level summary or metric summary.
As the AI alert conditions change, the alert severity updates to show the latest severity level. When an alert condition returns to the accepted range of variation and sensitivity control limits, the AI alert ends and is listed with Status Ended to indicate that the alert condition cleared.
Root Cause Analysis
Diagnosing an AI alert starts with examining the information in the initial AI alert message and interpreting the dimensions in the alert title, and then, if necessary, inspecting the diagnostic details of the alert to determine if the root cause of the alert can be further isolated to a specific device operating system family, app name, host, or path.
For each generated AI alert, the system displays the dimensions attributed to the root cause, and for further analysis provides a diagnostic time series of the metric variations leading up to the alert firing and continuing past the end of the alert. The AI alert system also displays a list of sessions that were impacted due to the alert and the device metadata associated with sessions to help you further isolate the root cause levels.
Searching AI Alerts
The AI Alerts page allows you to perform searches by the Alert Id, Metric,Root Cause, Status, or Peak Severity fields.
-
To search the alerts:
- Select the desired date range.
- Type a search term such as Android in the search box, and press Enter.
- To clear your search and see all alerts diagnostics again, clear the search box and press Enter.
Note: If your search yields no results, click the search box and press the Enter. This will re-populate the list with all alerts.
Viewing AI Alerts Diagnostics
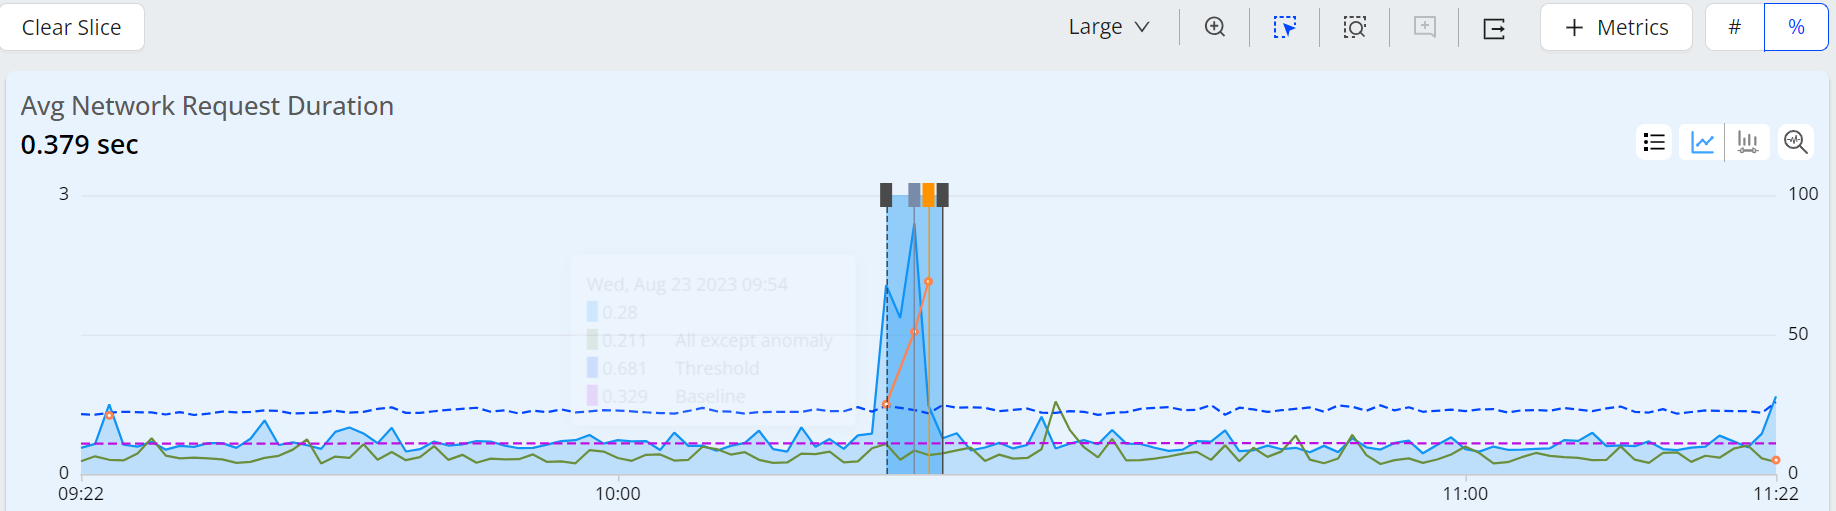
The AI alerts diagnostic page enables you to drill into the alert details with a data snapshot at the time the alert fired, a times series chart depicting the alert firing sequence expanded to one-minute intervals, and data illustrating the alert conditions, such as metric baseline and range of metric variance. When available, a second time series is shown for a related metric.
To diagnose an AI alert from the Diagnostics page, click the Time Alert Fired column for one of the alerts.
The Diagnostics page appears and displays the alert details from different perspectives.
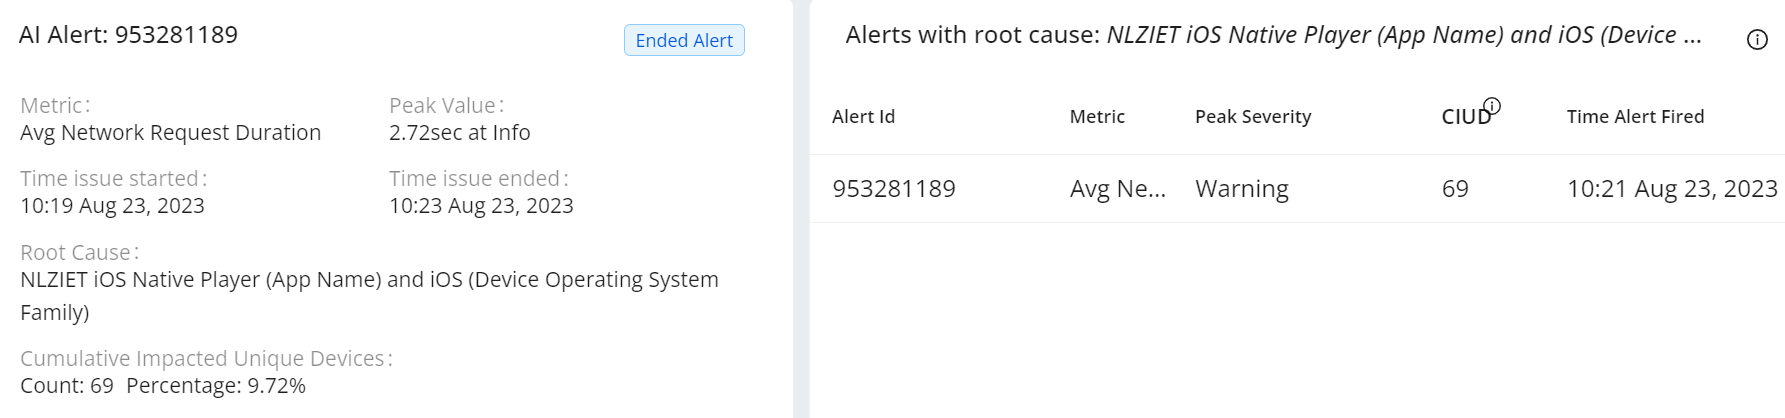
This image shows the detailed AI alert messages, such as the metric name, peak value, time issue started and ended time
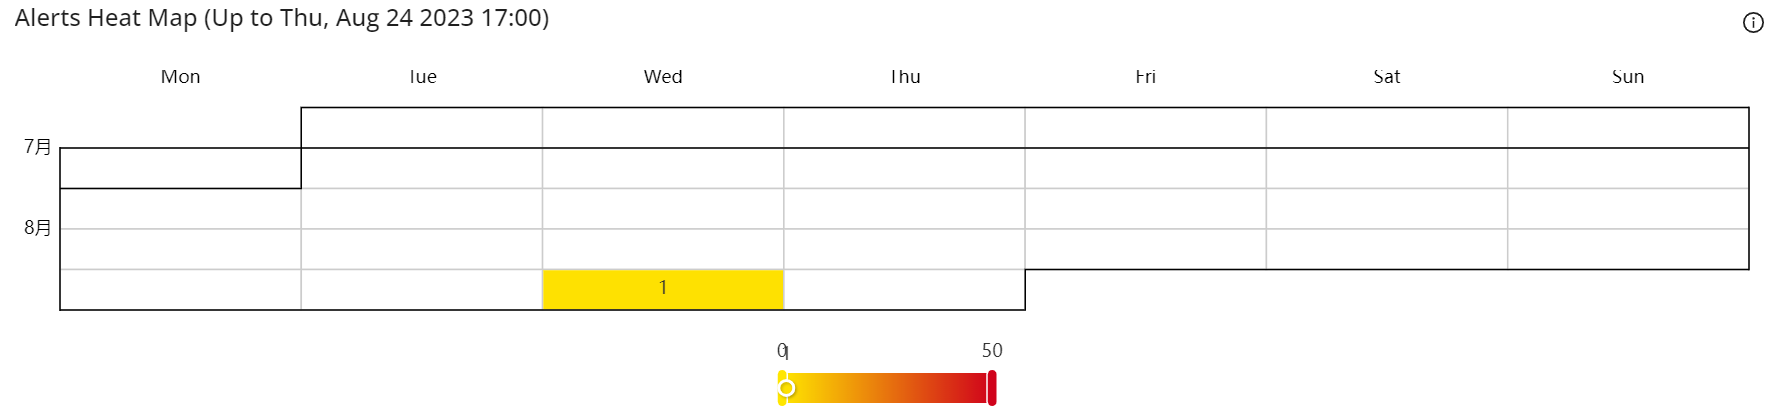
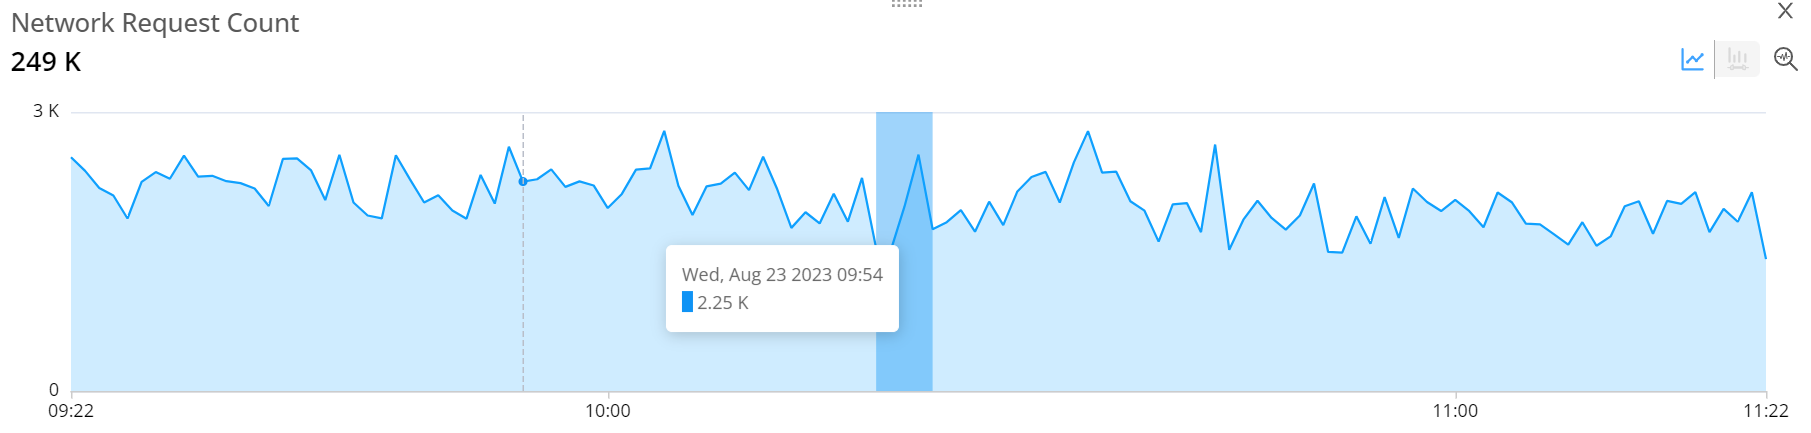
These images show the alerts heart map, the Avg Network Request Duration metric and the Network Request Count metric in line characters.
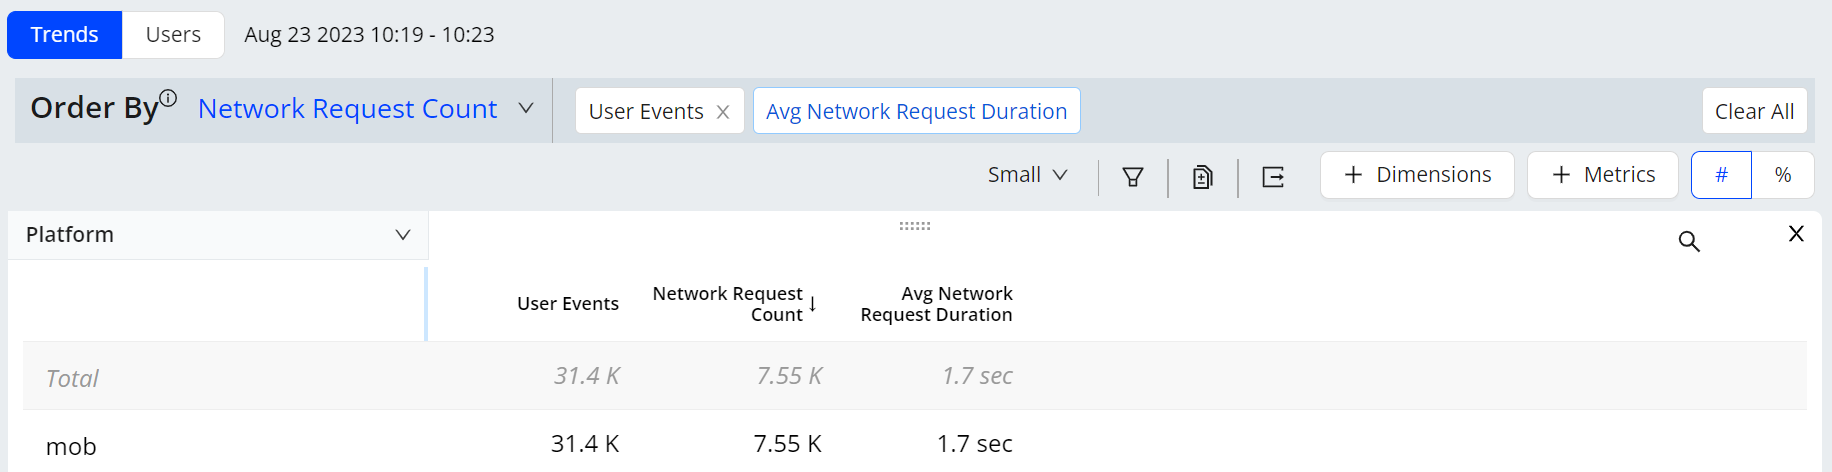
The trends dimension data displays the readings as per the applied filters. This helps you to analyze the data and check the anomalies.
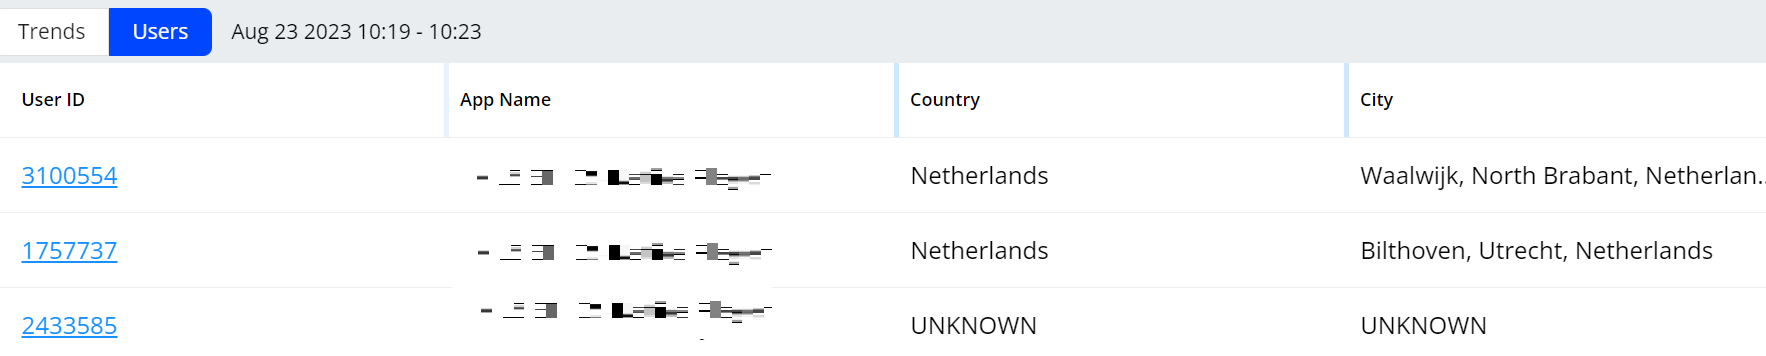
The Users tab provides the messages related with users, such as user ID, app name, country, and city. Click a user id to go to the user timeline for comprehensive and granular analysis of a session.
For Active Devices, the alerting is based on the seasonality traffic pattern, which depends on the projected active devices based on a smoothed estimate of the previous 7-day device count and the most recent device activity. Active Devices AI alerts are triggered based on the percentage of device decline vs the projected device activity. Time line bars indicate the amount of decline in each interval.
Conviva uses machine learning to compile an active device baseline (T-7 dashed blue line), which is determined using weighted comparisons with the previous 7-day device activity and the most recent device activity. Projected active devices (dashed purple line) is a proprietary algorithm based on a combination of derivatives and multipliers of multiple historical time series to calculate an estimated predicted active devices. This is used to calculate the difference from the actual, for which the percentage drop (PCT Drop) fires an alert when the percentage crosses the threshold while maintaining persistence.
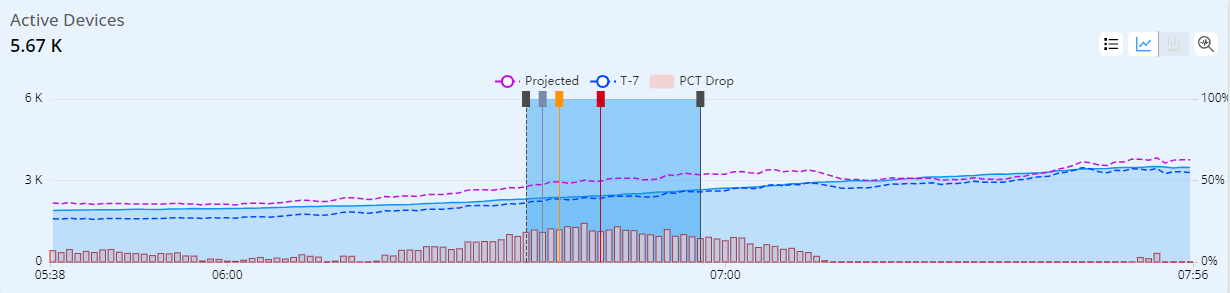
In this example, the upper dashed-line for projected active devices shows a trending decline with the actual device activity, which generated the AI alert.
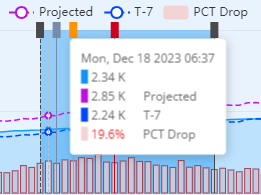
The hover data snapshot displays active device data throughout the time line along with the percentage drop.
Webhook Integrations
Admin users can also set webhooks to integrate Conviva AI alerts into external applications, such as JIRA or other support ticket applications.
To setup webhooks, see Setting Webhook Notifications.
AI Alert Email Subscription
Admin users can manage user AI alert email subscriptions, such as subscribe and unsubscribe user email addresses, and set specific metric notifications by severity level for each user. For more information, see AI Alert Email Subscription.
App AI Alerts App AI Alerts DPI AI Alerts DPI AI Alerts