Performing Drill-Down Analysis
DPI provides a rich set of out-of-box metrics and features for deep drill-down cross-dimensional analysis for easy analysis across dimensions, such as device model, application version, and error messages.
For information on Trends, see Trends.
DPI Metrics and Metadata
DPI metrics display in metric widget time series and dimension tables.
-
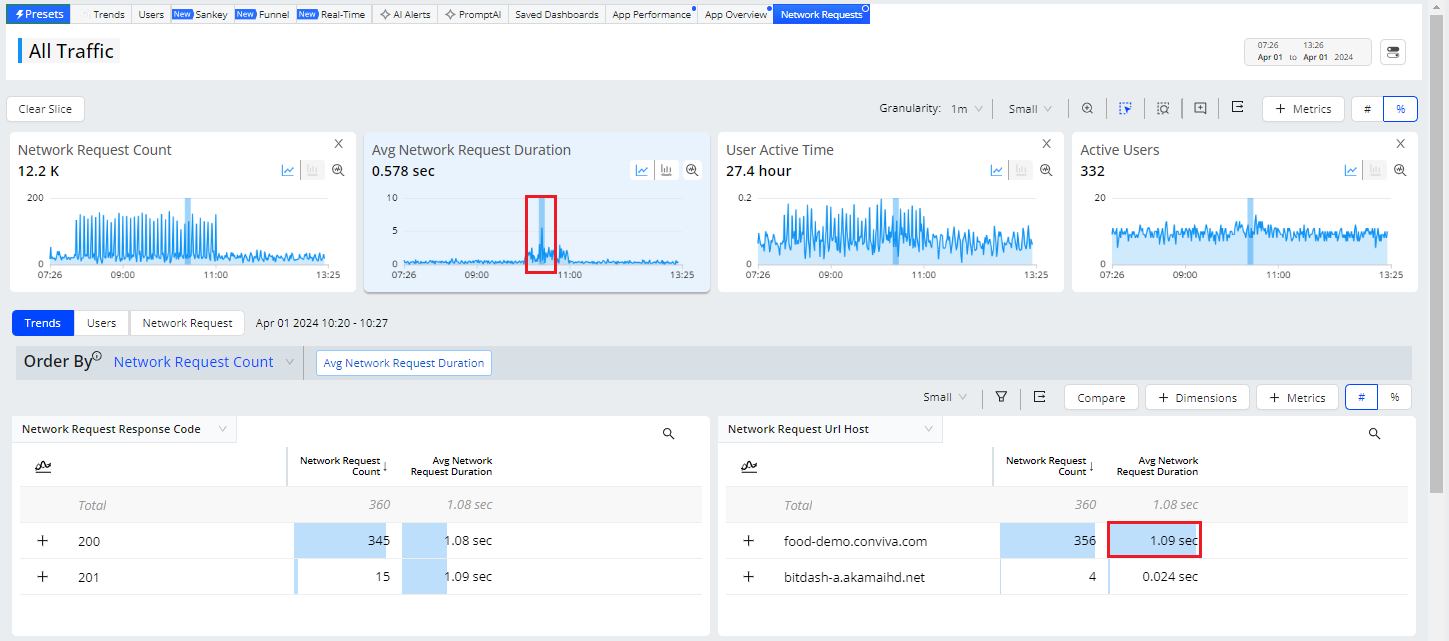
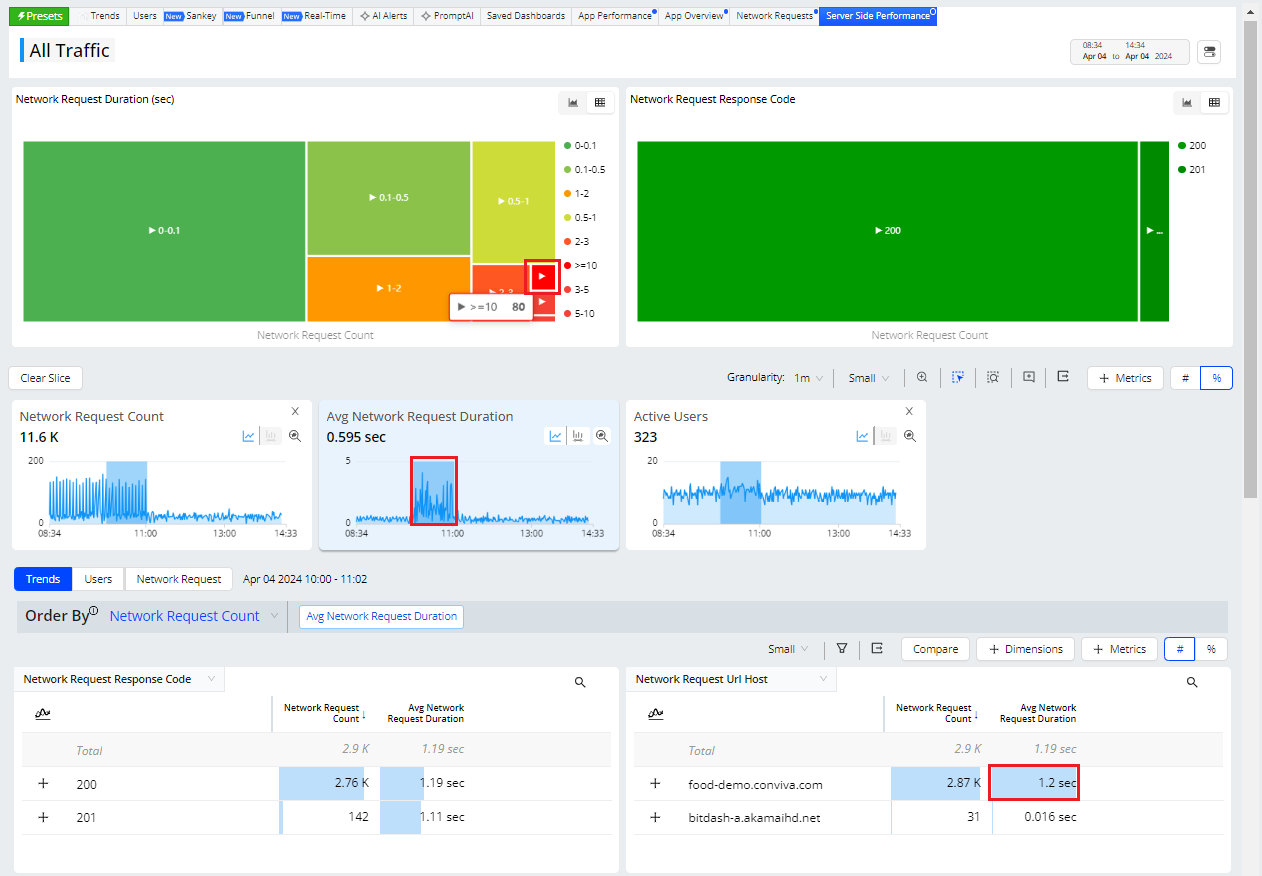
Slice anomalies and spikes (for example, high points in network request duration)
-
Drill-down in dimension tables for quick root cause analysis (for example, by URL hosts)
In addition to analyzing metric performance in metric time series widgets, click Presets and select a desired preset option to quickly get started with commonly used metrics and metadata use cases.
This examples shows the Preset for quick network request analysis.
Preset: Network Request Example
Preset: Server-Side Performance Example
Out-of-Box DPI Metrics
For a complete list of DPI metric definitions and support, see DPI Metrics.
| Category | Metrics | ||
| Audience and Engagement |
App Active Time (Formerly Active Time) |
||
| QoE and KPI Metrics |
Mins with High App Startup Time |
||
| Web User Experience | Avg DNS Lookup Time | ||
| Mobile User Experience | |||
| Service Performance |
Mins with 0 Network Response Code |
||
Out-of-Box DPI Metadata
|
Category |
Metadata |
||
|---|---|---|---|
| App |
App Name Application Build Application Version |
Bundle Info Platform Sensor Version |
|
|
Device |
Browser Name Browser Version Device Hardware Type Device Manufacturer Device Marketing Name |
Device Model Device Name Device Operating System Device Operating System Family Device Operating System Version |
|
| GEO & ISP |
Cities Connection Countries |
ISPs States Zipcode |
|
| Page (Web) |
Edited Page Title First Launch Page Host Page Path Page Query |
Page Referrer Page Title Page Url Referrer Host |
|
| Screen (Mobile) |
Edited Screen Title Previous Screen Title |
Screen Title | |
| Network Request |
Network Request Endpoint Network Request Http Method Network Request Response Code |
Network Request Url Host Network Request Url Path |
|
| Events | Event Category | Event Name | |
| Errors | ANR Reason | Error Message | Stack Trace |
| Global Tags | Dimensions that are based on global tags. | ||
| Event Tags | Dimensions that are based on event tags. | ||
Out-of-Box Events
Check the auto-ingested events and minimum player versions for details about auto-collected event support.
 Out-of-Box Events
DPI provides a robust set of metrics to enable application performance monitoring and user behavior analysis across your web and native applications. Metric values appear as time series and distributions in metric widgets, and alongside dimensional values in the dimension drill-down tables.
| Conviva App Sensors | |||||||
|---|---|---|---|---|---|---|---|
|
Android |
iOS |
JS SDK |
C SDK |
Roku |
|||
| Min App SDK | 0.5.2 | 0.2.10 | 0.3.17 | 2.183.0.0 | 0.2.3 | ||
| AutoCollected Event | Event Source | Min Video SDK | 4.0.30 | 4.0.32 | 4.5.13 | No | No |
| network request | After receiving the network request response | Autocollected, displays in DPI, Device Modeling Dashboard |
Autocollected, displays in DPI, Device Modeling Dashboard |
Autocollected, displays in DPI, Device Modeling Dashboard |
Not applicable for devices | Report manually | |
|
screen_view |
On screen interaction, either first launch or re-launch | Autocollected, displays in DPI, Device Modeling Dashboard |
Autocollected, displays in DPI, Device Modeling Dashboard |
Not applicable for devices | Not applicable for devices | Report manually | |
|
application_error |
On error in application | Autocollected, displays in DPI, Device Modeling Dashboard |
Autocollected, displays in DPI, Device Modeling Dashboard |
Autocollected, displays in DPI, Device Modeling Dashboard |
Not applicable for devices | Report manually | |
|
button_click |
On button click callback | Autocollected, displays in DPI, Device Modeling Dashboard |
Autocollected, displays in DPI, Device Modeling Dashboard |
Autocollected, displays in DPI, Device Modeling Dashboard |
Not applicable for devices | Report manually | |
|
application_background |
When application moves to the background | Autocollected | Autocollected | Not applicable for devices | Not applicable for devices | Report manually | |
|
application_foreground |
When application moves to the foreground | Autocollected | Autocollected | Not applicable for devices | Not applicable for devices | Report manually | |
|
application_install |
When application is launched for the first time after install. (not exactly installed time) | Autocollected | Autocollected | Not applicable for devices | Not applicable for devices | Report manually | |
|
deep_link_received |
On application open using the UTM URL. | Autocollected | Autocollected | Not applicable for devices | Not applicable for devices | Report manually | |
|
anr_start |
When timer starts for the response from the main thread. If more than 4 seconds, event is triggered. | Autocollected | Report manually | Not applicable for devices | Not applicable for devices | Report manually | |
|
anr_stop |
When SDK gets response after triggering anr_start, anr_end is dispatched. | Autocollected | Report manually | Not applicable for devices | Not applicable for devices | Report manually | |
|
link_click |
On link click callback | Report manually | Report manually | Autocollected | Not applicable for devices | Report manually | |
Conviva video events (conviva_video_events) are also available using these abbreviations as tag keys:
|
an: asset name. avgbr: average bitrate in kbps. br: bitrate in kbps. cen: custom event name. ced: custom event data. cl: content length in seconds. clid: client ID assigned by Conviva to the physical device. err: error message. |
ft: isFatal, a boolean value indicating whether the error is fatal. fw: framework name in which the media player runs. fwv: framework version. iid: instance ID. When several players run on the same device, each player should have a unique instance ID. lv: isLive, a boolean value indicating whether the content currently playing is Live. mn: module name mv: module version |
name: device name newsc: new state change oldsc: old state change pn: player name sid: session id identifying the current session, unique on this client. sst: session start time as UNIX epoch time in milliseconds. st: session time from the session start in milliseconds. |
tags: supported tags for metadata. url: manifest URL of the media stream for the session. vid: viewer ID. |
For more details about Conviva DPI, see
Dimensional Data Drill-Downs
Select up to eight dimensions enabling advanced analysis across dimension tables for deep data drill-downs. Clicking dimension values in dimension tables provides advanced analysis across dimensional value combinations, such as Apple TV 4k, app version 5.6.2 and user ID 2163548, for flexible impact and combined data analysis
Use Case-Analyzing App Crashes
The use case provides a step-by-step guide on how to analyze app crashes using key features in DPI.
-
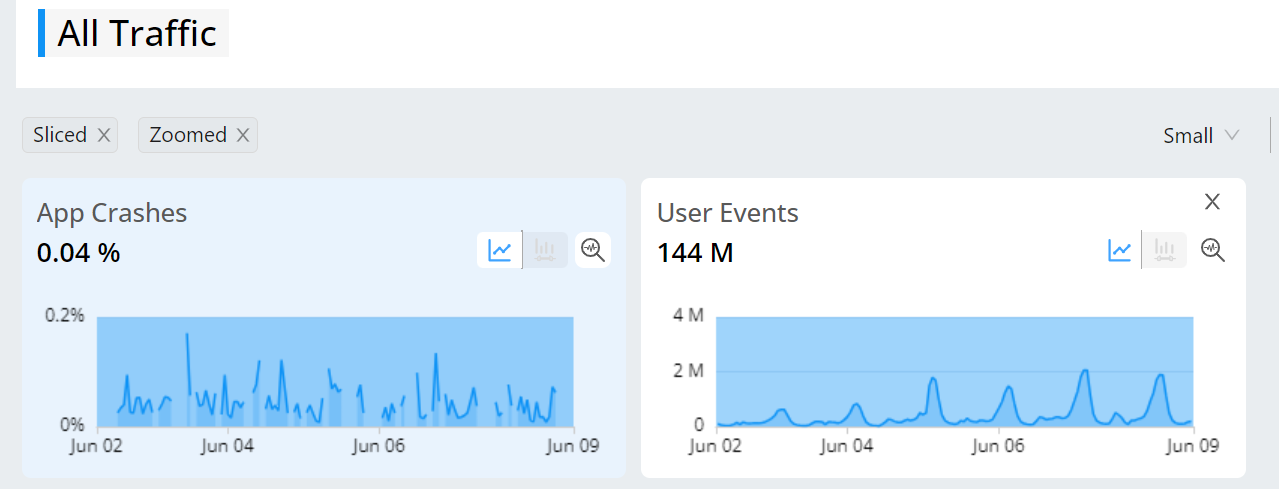
Check metrics:
-
Start by accessing the Metric panel and checking the available metrics.
-
To zoom, select, and zoom to select the desired period when most app crashes occurred by using the toolbar options.
-
-
Explore dimensional data:
-
To access more detailed information, move to the Dimension table.
-
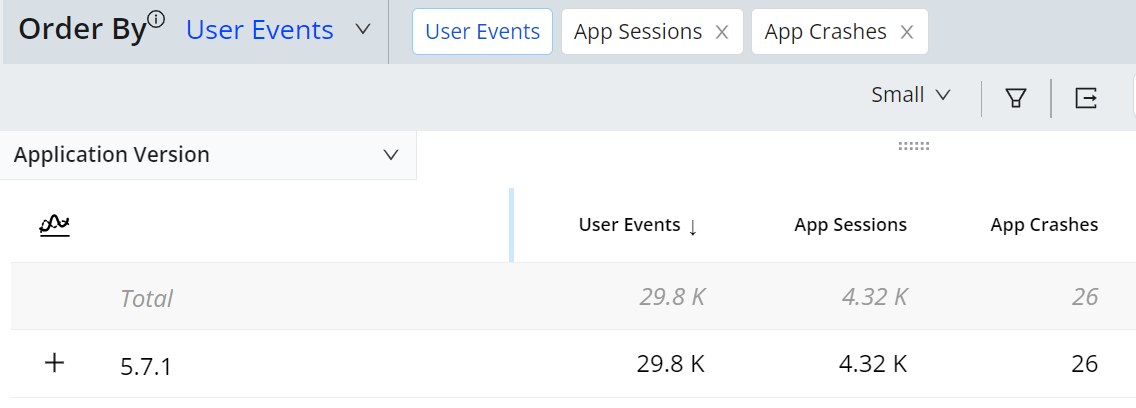
To check more information, click Add Dimension to add more Dimension tables, such as adding Application Version.
-
Set the data to be ordered by app crashes for a better understanding.

-
-
Narrow down data:
-
To refine your analysis, click a specific application version, such as 5.7.1.
-
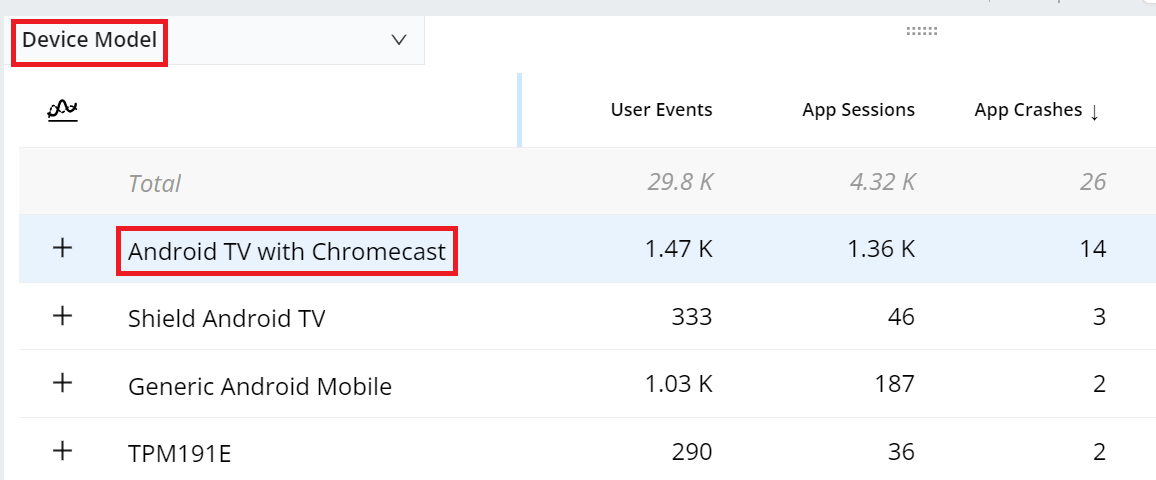
Further filter the data by selecting Device Model and clicking a specific device model, like Android TV with Chromecast.
-
Identify error messages by selecting Error Message.
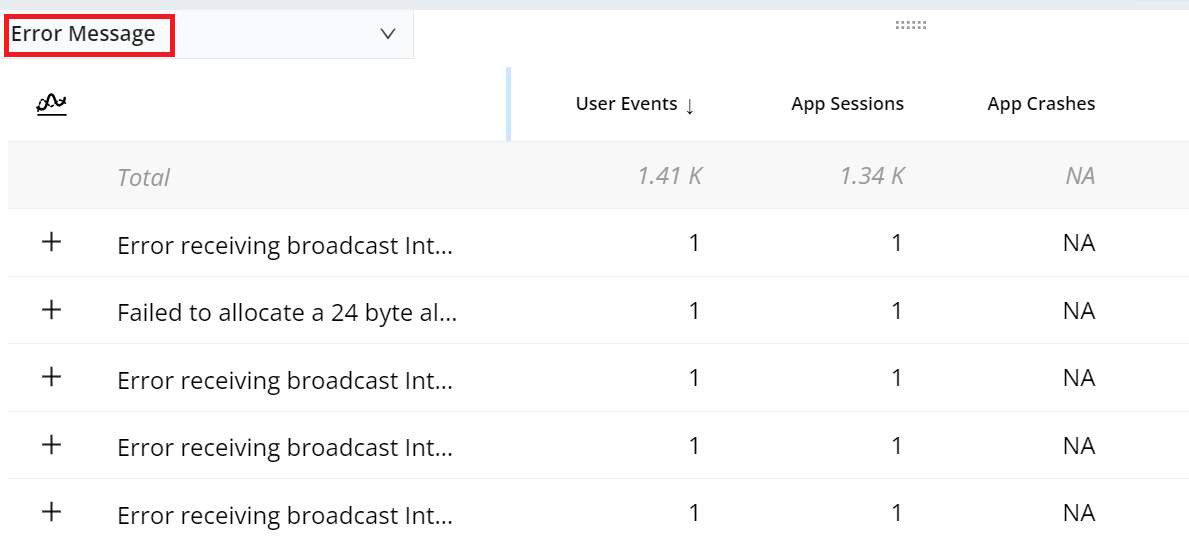
Now focus on the error messages generated when the app crashes in version 5.7.1 on Android TV with Chromecast.
These error messages are crucial for engineers to optimize the app for that specific configuration.
-
-
Analyze user behavior:
-
Refer to the User ID dimension table to identify the user, for example, User 1144090, who experienced the most app crashes.
-
To analyze the user's behavior and understand the root causes of the app crashes, click the Users tab, then select the User ID to access the User Timeline page.

-
-
Deepen analysis with user timeline:
-
On the User Timeline page, explore the timeline that showcases more data about the user and the events.
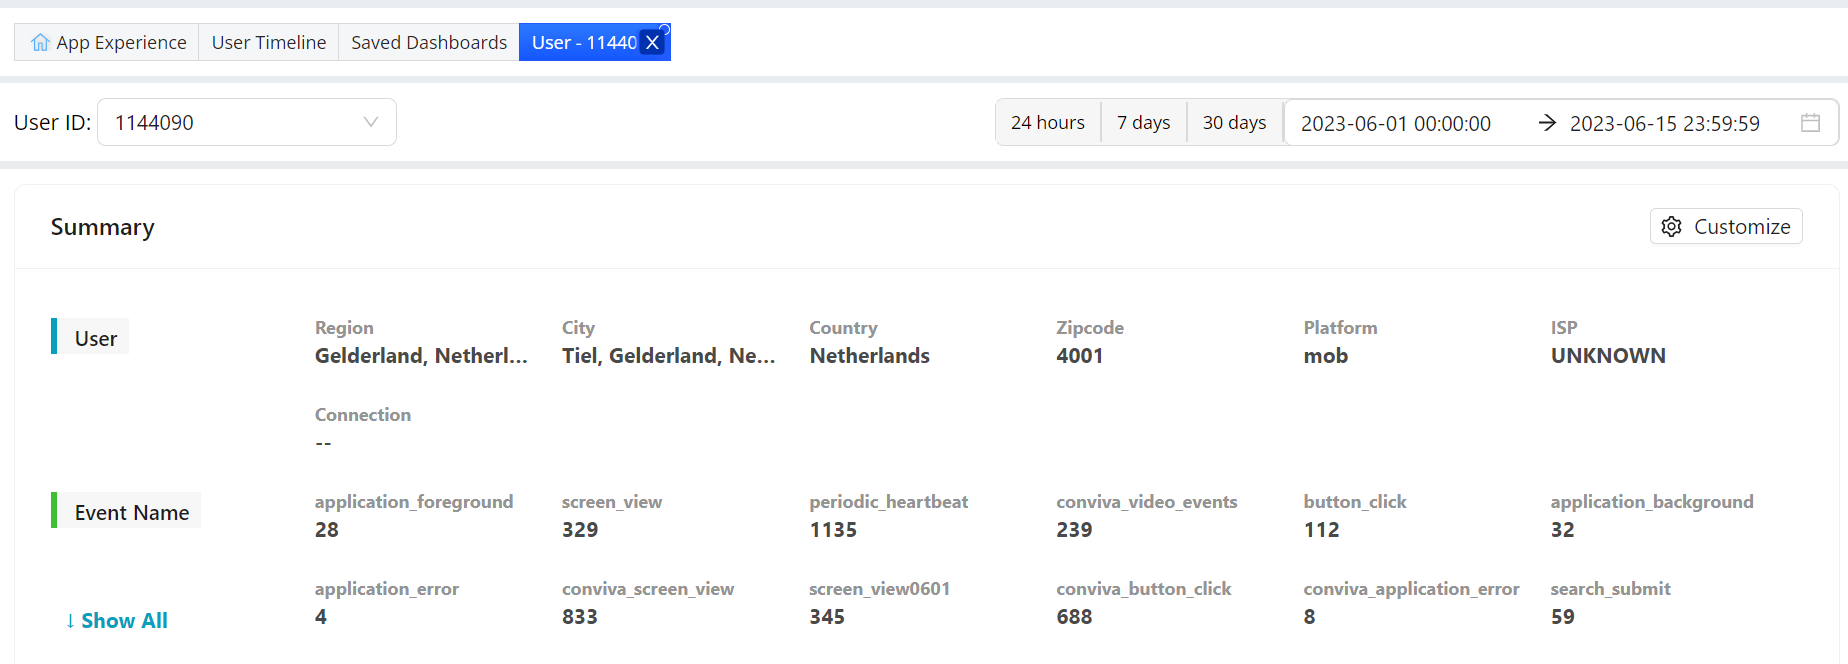
By following these steps, effectively analyze app crashes, identify error messages, and gain insights into user behavior using the various features available in DPI.
-
Next Step: Automate