AI Alerts Diagnostics
Trends includes AI alert notifications in metric time series widgets, enabling users to track AI alerts alongside metric performance.
The Conviva AI Alerting system continuously checks for anomalies and calculates a baseline, as well as a range of variation for the metric(s), using the mean and standard deviation derived from historical data. The AI Alerts proactively detect anomalies, generate alerts, and display alert bars in the related metric time series. Click the AI alert bar to alert diagnostics.
Using the toggle feature, incorporate the AI alert data into the metric widgets to obtain a comprehensive view of the related AI alert activity in the metric time series.
The standard dimensions are:
-
Mins with High Page Load Time
-
Page title *
-
Page host *
-
Page path *
-
Browser *
-
Device name
-
App name
-
Edited Page Title
-
-
Mins with High Screen Load Time
-
Screen title *
-
App name *
-
App version *
-
Device name *
-
Device model
-
Edited Page Title
-
-
Mins with High Avg Network Response Duration
-
Nw request url host * (which endpoint)
-
Nw request url path * (which api)
-
Nw request response code * (See immediately if within the degradation period there’s increased rate of failed requests)
-
App name
-
Device name *
-
Edited Page Title
-
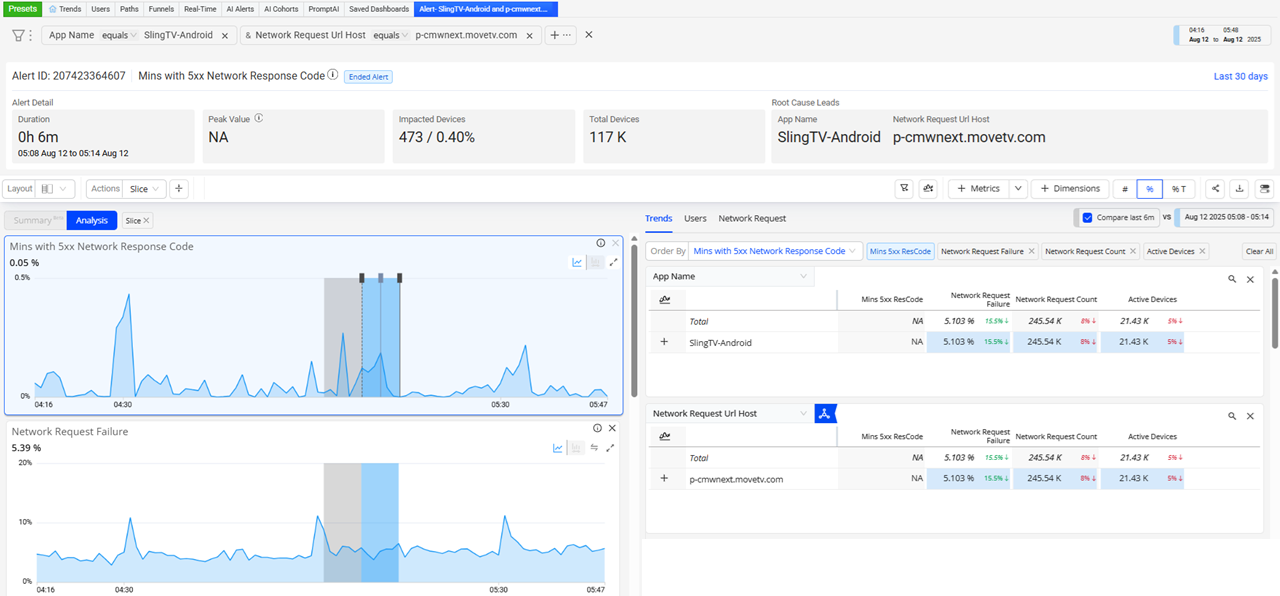
Click the Dimension button to specify the dimensions to display. The dimension associated with the root cause group is automatically displayed as the first dimension. The dimension selector displays standard dimensions, root cause group dimension, and any added custom dimensions.
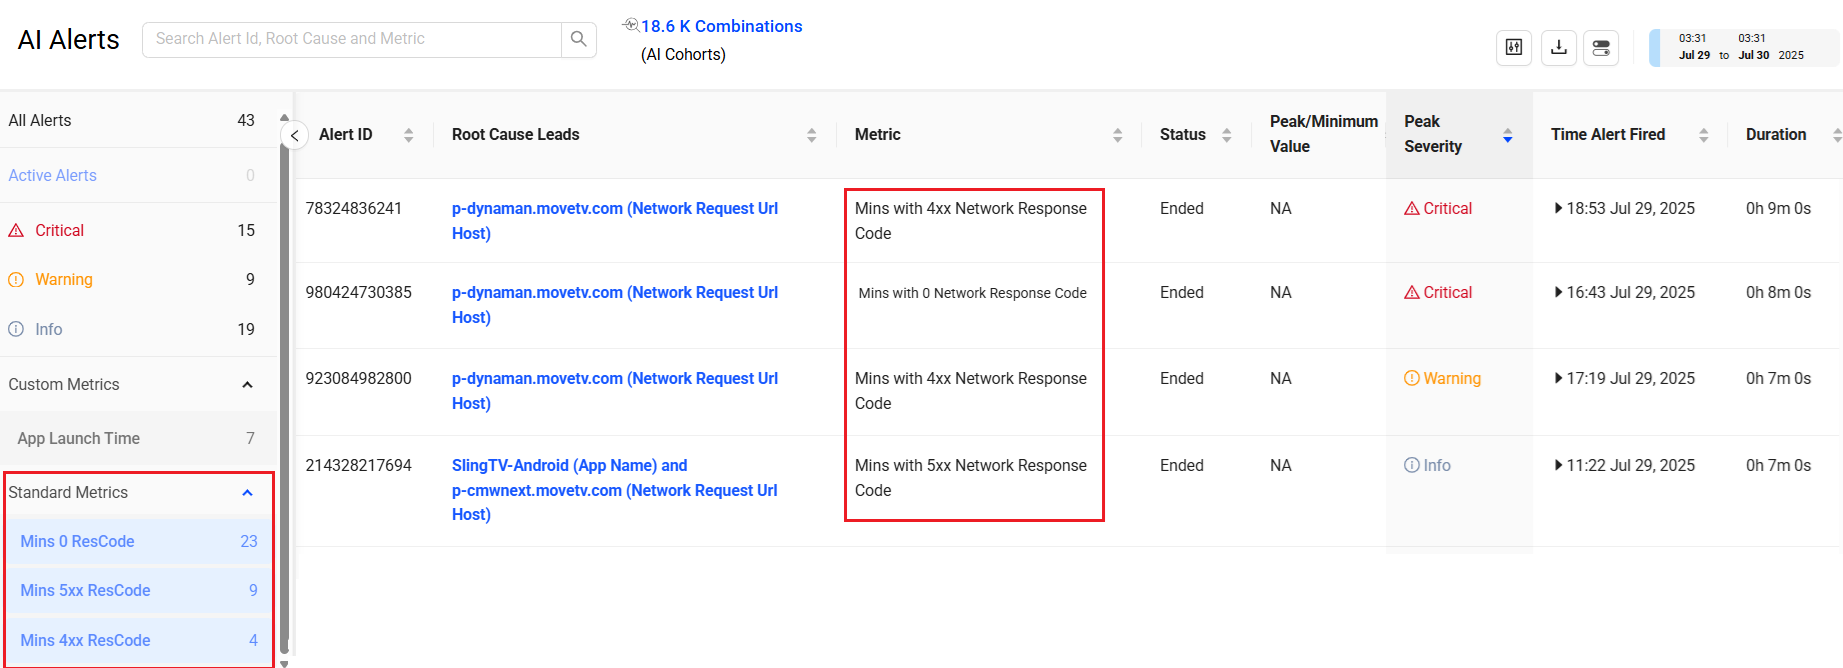
Minutes with Network Request Response Code Metrics
The Mins with x Network Request Response Code metrics help to analyze the different types of network request performance issues in app sessions based on the number and percentage of 1-minute intervals during which the performance issues occurred. These metrics categorize performance issues based on issues with HTTP response code processing, client-side request handling, and service-side request response failures.
-
Mins with 0 Network Response Code
This metric indicates the impacted minutes in app sessions where network request failures occurred with a response code of 0, indicating issues like timeouts or requests that did not reach the server, causing a network request failure or an aborted request before a valid HTTP response was received and processed. Root causes often involve a client-side issue or a problem preventing the connection from being established or maintained.
-
Mins with 4xx Network Response Code
This metric inidcates the impacted minutes in app sessions with network request failures and response codes between 400 and 499, indicating client-side errors caused issues with the client's request that prevented a valid server response. Root causes often involve malformed or invalid request bodies or authorization/resources access.
-
Mins with 5xx Network Response Code
This metric calculates the percentage of impacted minutes in app sessions with network request failures that have response codes between 500 and 599, indicating server errors that preventing the server from fulfilling a valid request from the client.
For more information on Mins with x metric details, see Minutes with Network Request Response Code Metrics.
Success Metrics (Beta)
AI Alerts for Flow Success Rates that trigger when the success rate degrades below the configured success level. These AI alerts provide proactive notifications based on the flow success rate and the configured persistence.
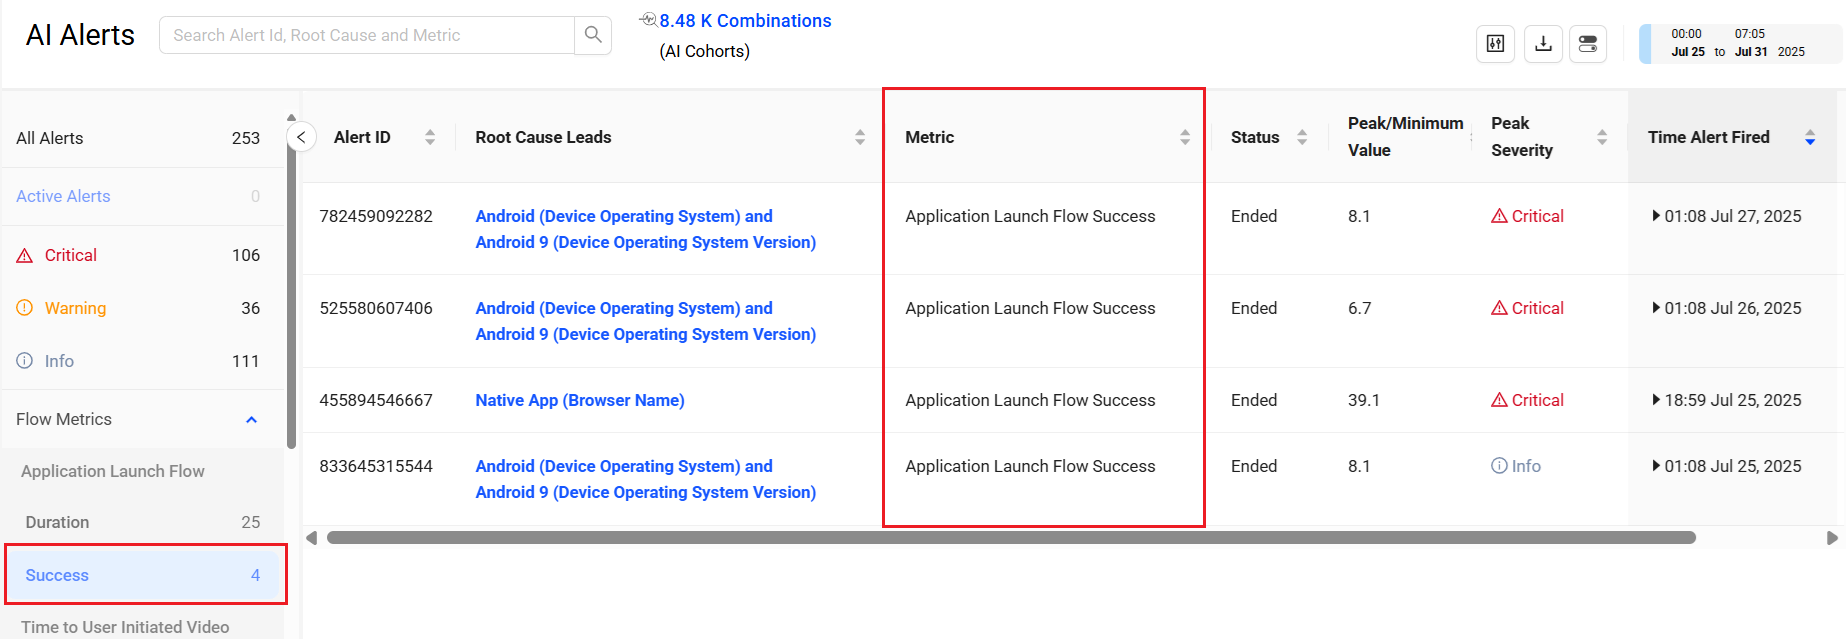
Conviva DPI lists each success alert on the AI Alerts page and marks the flow time series with alert indicators that link to AI Alert Diagnostics for detailed analysis and impact insights. It monitors flow success rates and issues proactive notifications when the success rate falls below the configured threshold and persistence. For example, configure an AI alert for the login success flow to receive a notification when the login success rate drops below the defined level. Use AI Diagnostics to identify the root cause and maintain high application availability.
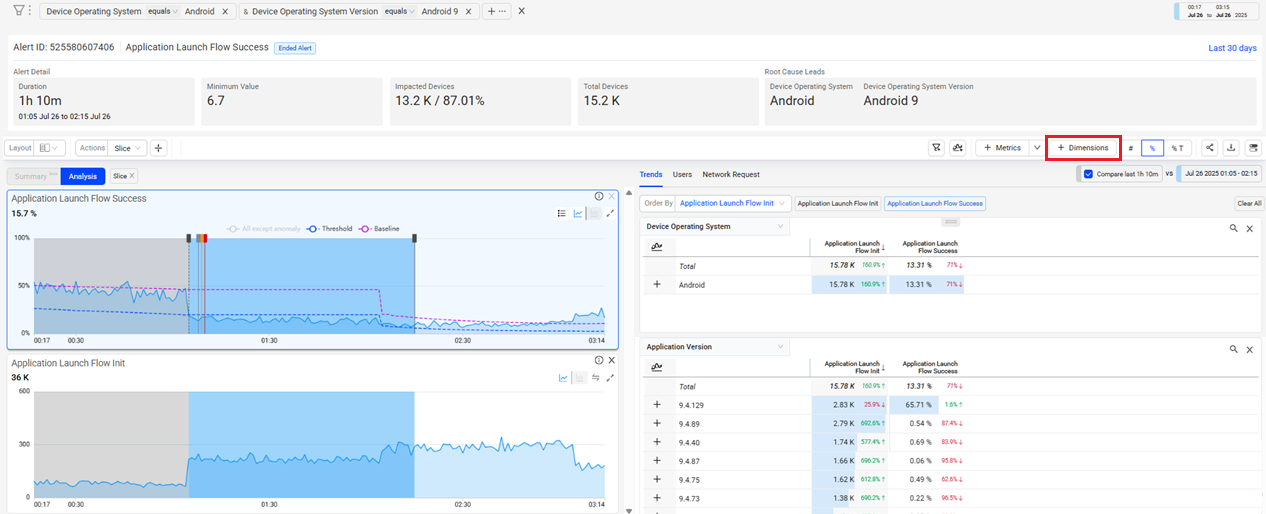
Also, based on the requirement add the flow dimensions by clicking the Dimensions button.

AI Alerts Success Metrics Success Metrics AI Alerts Diagnostics AI Alerts High Minutes with Network Request Response Code