Conviva DPI provides a robust set of features to drive e-commerce operations and performance:
-
Improve user experience and impact notifications to drive continuous business outcomes, leveraging artificial intelligence alerting and instant root-cause analysis.
-
Empower connected decisions across devops, application, analytics, and other teams to prioritize for highest business outcomes.
-
Reduce existing data warehouse ingest and query costs through Conviva's time-state technology and experience-centeric architecture.
Note: Lightweight integration of Conviva DPI sensor enables automatic, semantic-less data collection. Conviva’s light-weight DPI sensor module consists of several basic scripts accessible from the Conviva GitHub Repositories with basic README instructions and the related script files for each the supported DPI application platforms. Conviva also provides an DPI Integration Tool for UI-based integration. For more details, see Drop-in the Conviva Sensor.
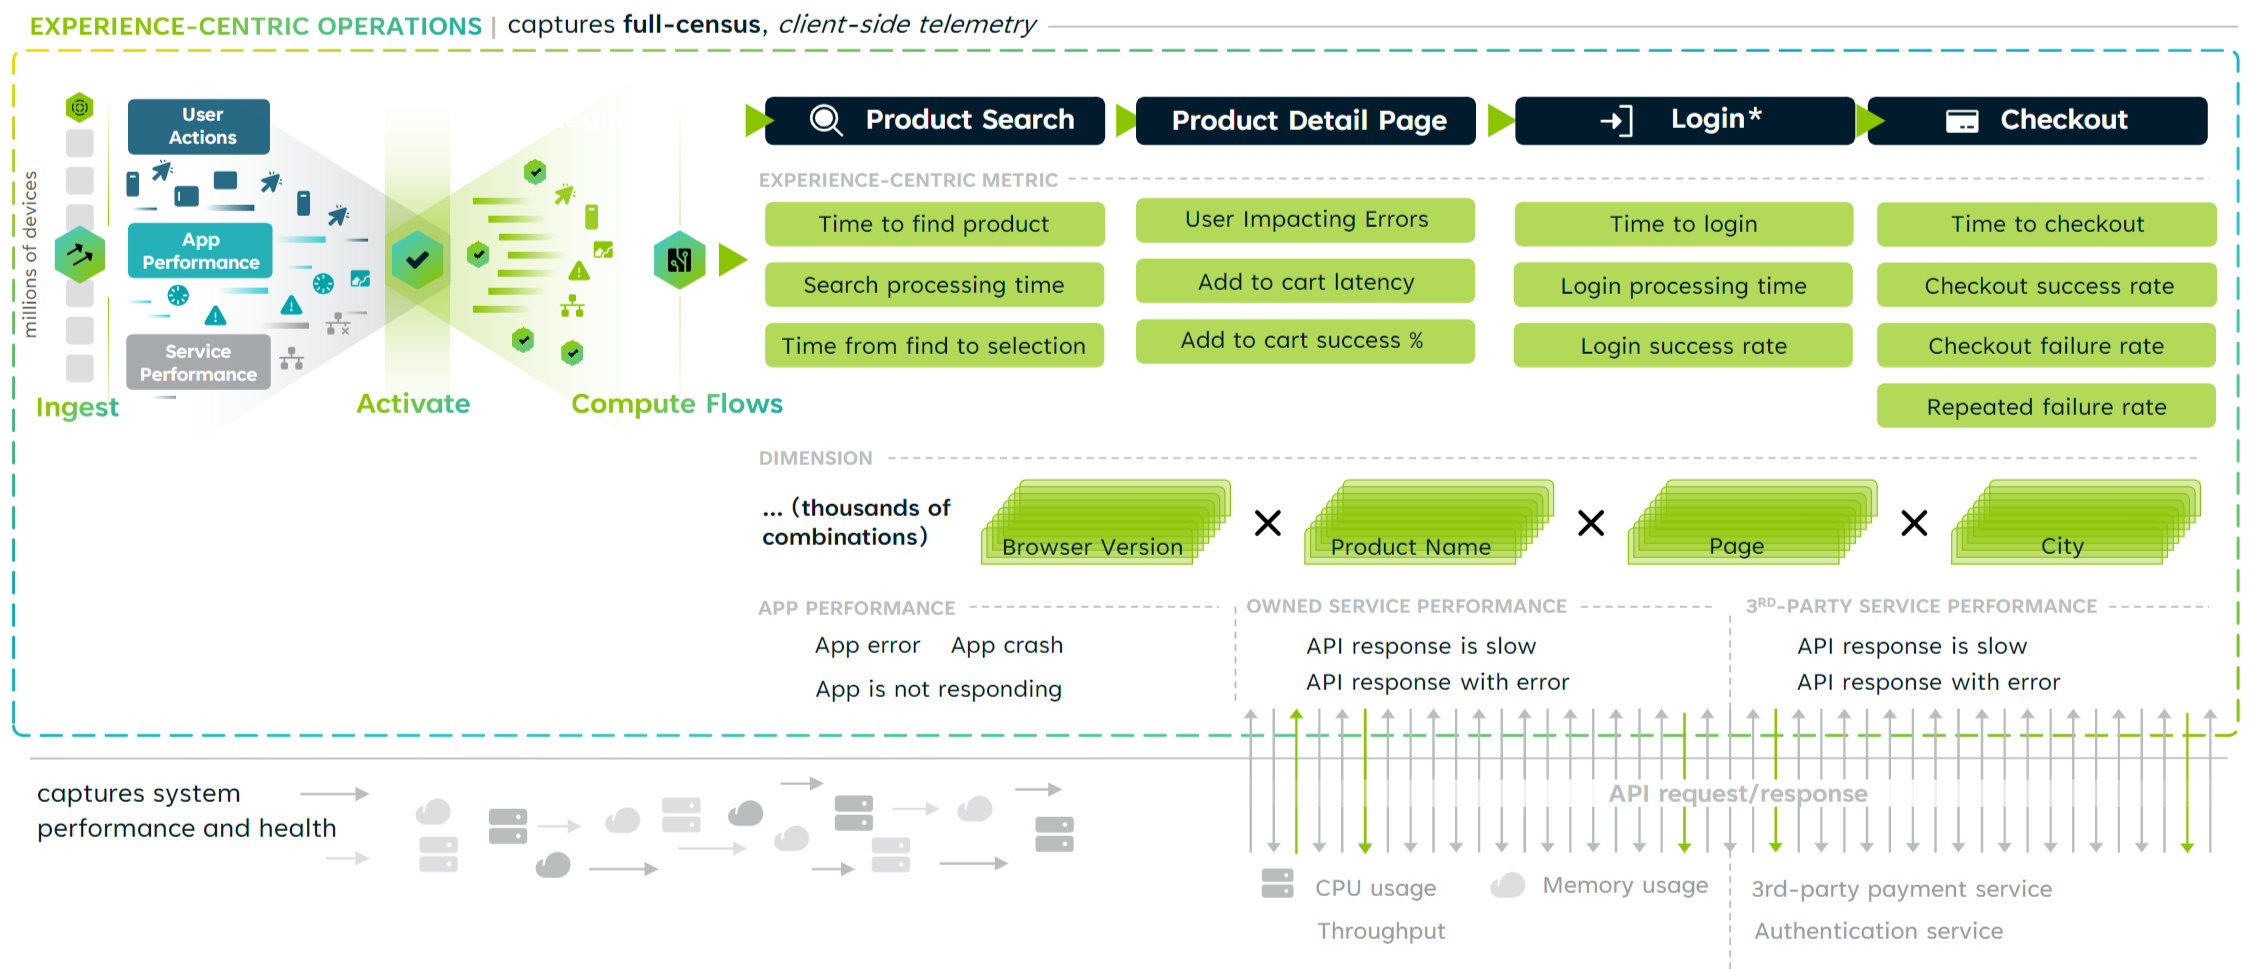
Out-of-Box DPI E-Commerce Features
Conviva provides a rich set of out-of-box application performance metrics based on auto-collected app events, such as page_view, screen_view, button_click, app crashes, network_requests, and overall Quality of Experience (QoE) index. Using these readily availalbe metrics, quickly analyze critical experience-centric performance of your most critical workflows, such as user logins and purchase success.
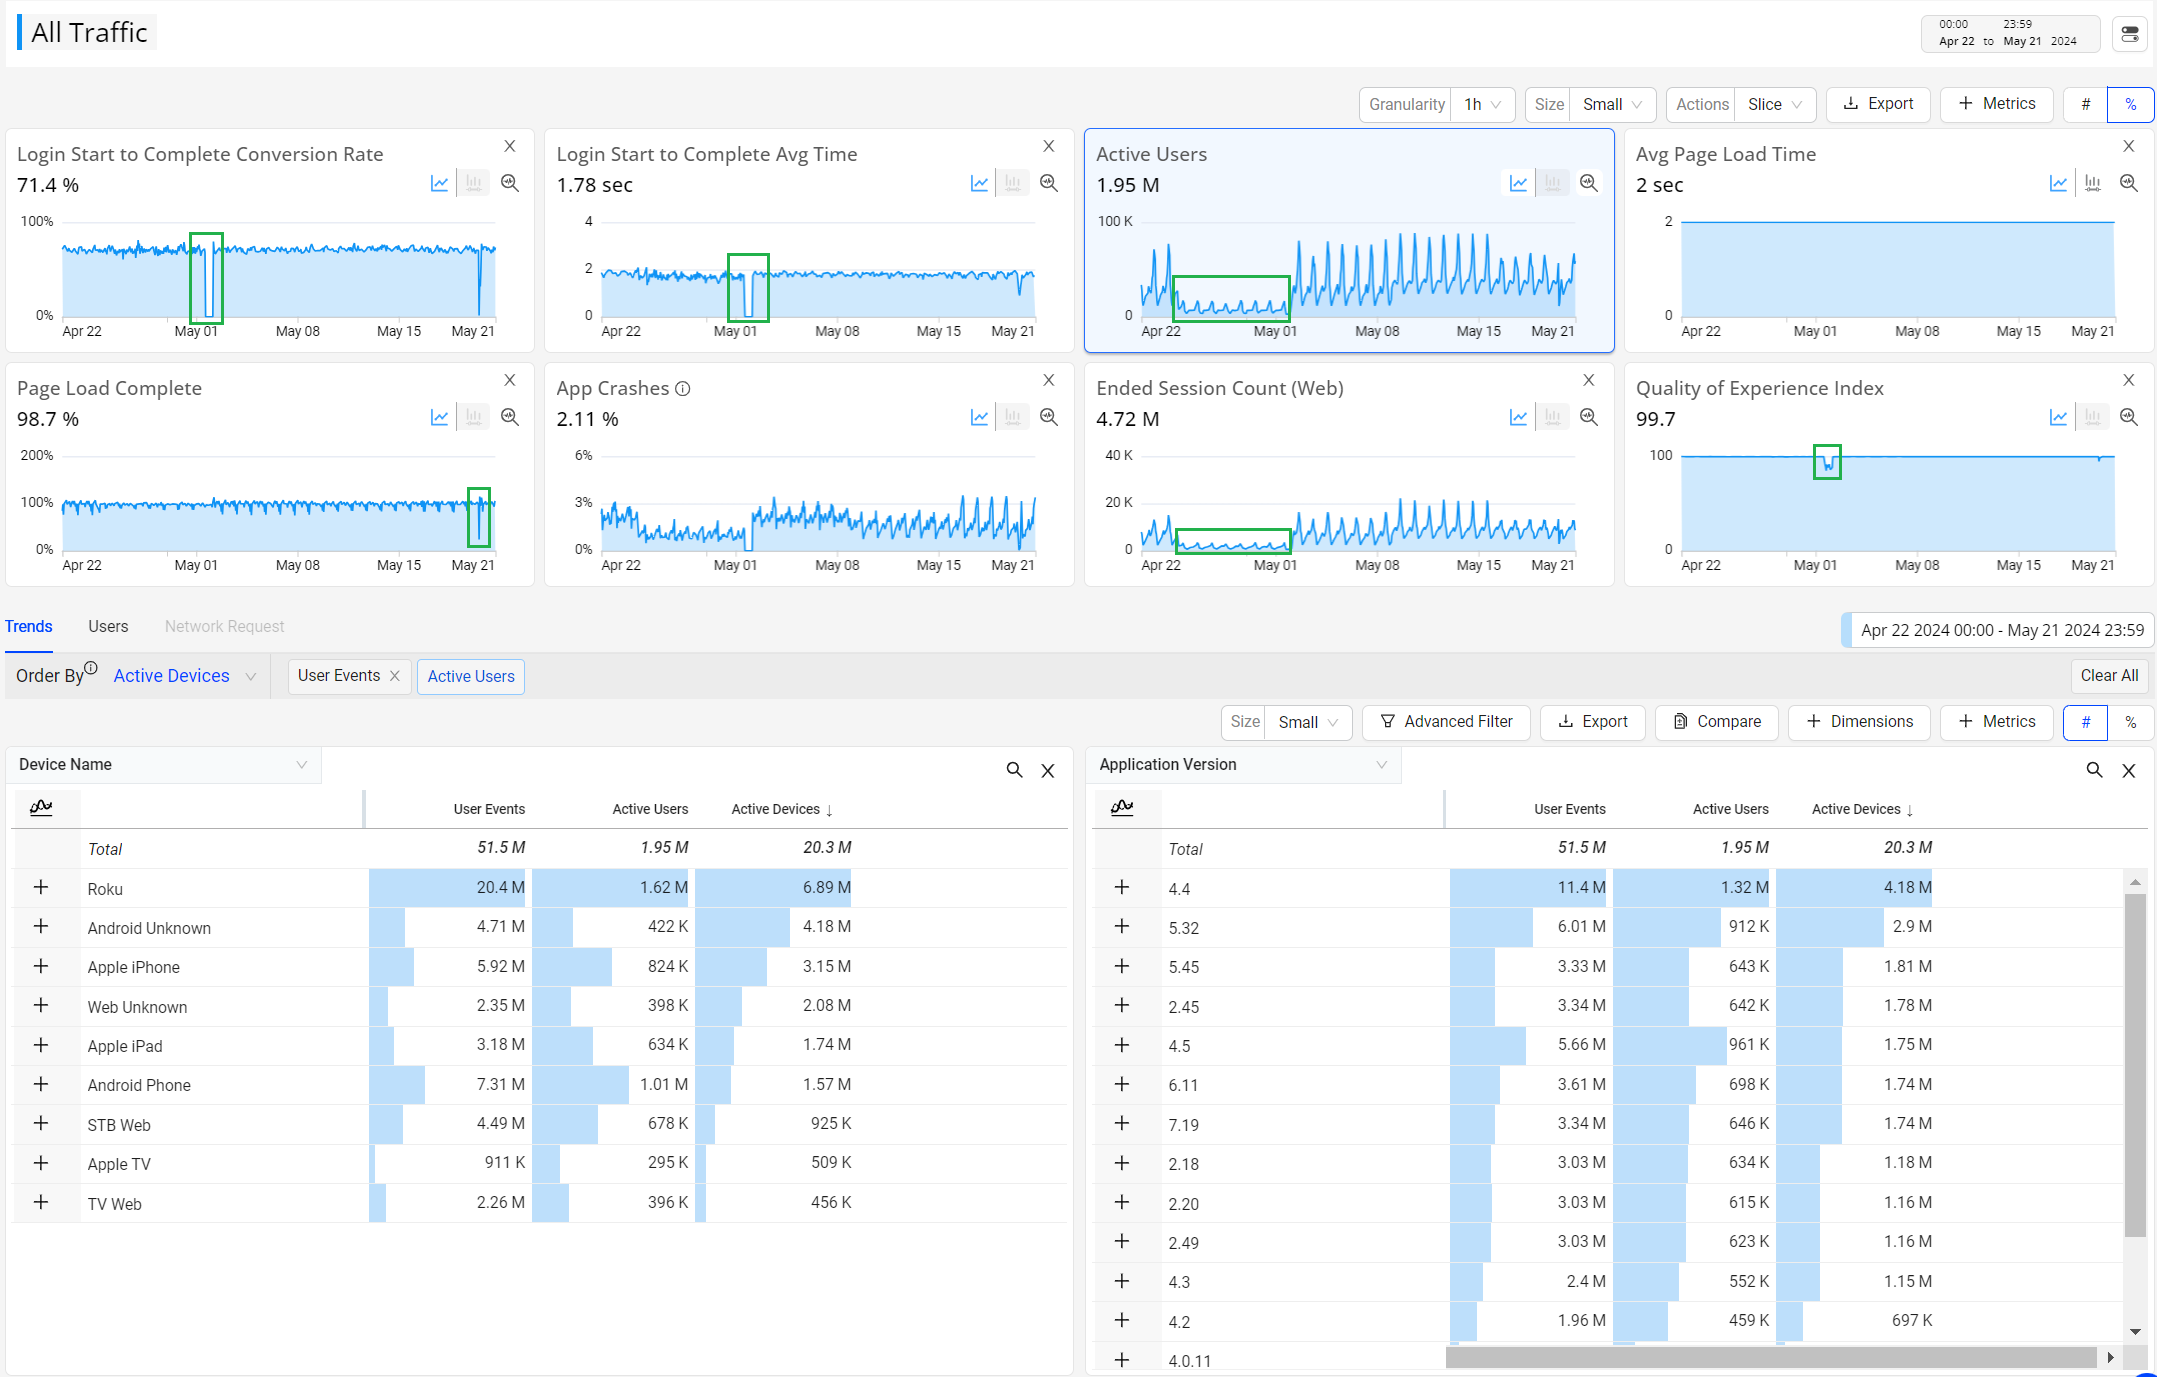
Baselines and Anomalies in Performance Metric Time Series
In the Trends metric widget timeseries, based on events transformed into actionable metrcis, visually detect experience-centric performance levels to establish operational baselines and identify performance spikes and drop-offs. Discover root causes with cross-dimensional analysis using dimension drill-down tables across app versions, device, geo location, and more. Time serices highlights indicate performance anomalies for focused analysis.
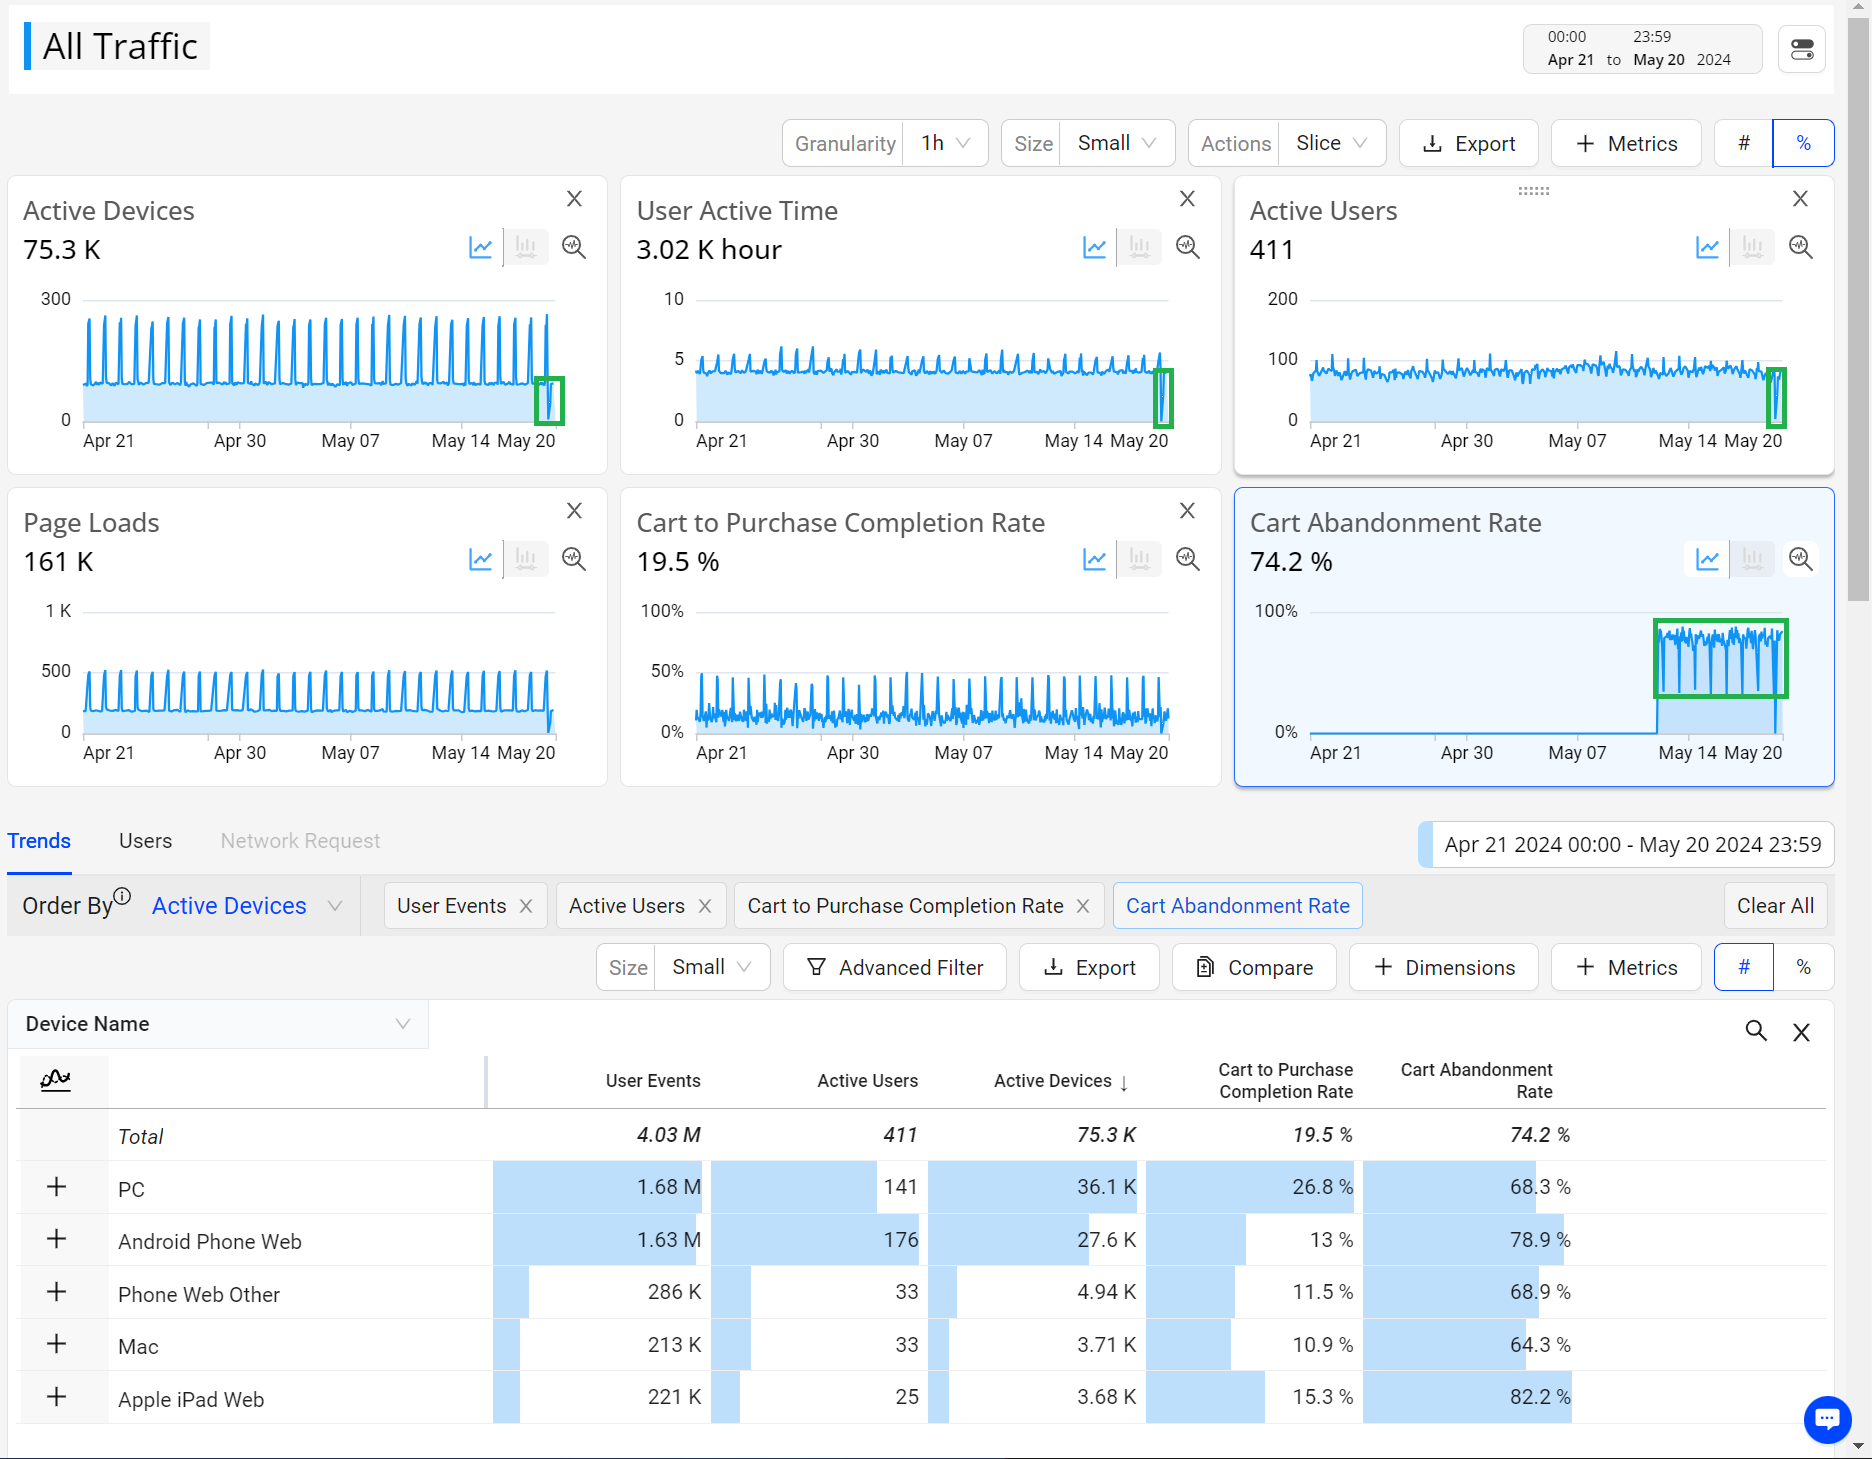
Flexible Analytics Workflows
Using Conviva DPI Trends, quickly view the real-time performance of critical user experiences, such as user active time and cart activities, to discover the issues that matter to complete monization flows and realize business value. Additionally, explore cross-dimensional analysis to further expand the related cause groups, such device type or location.
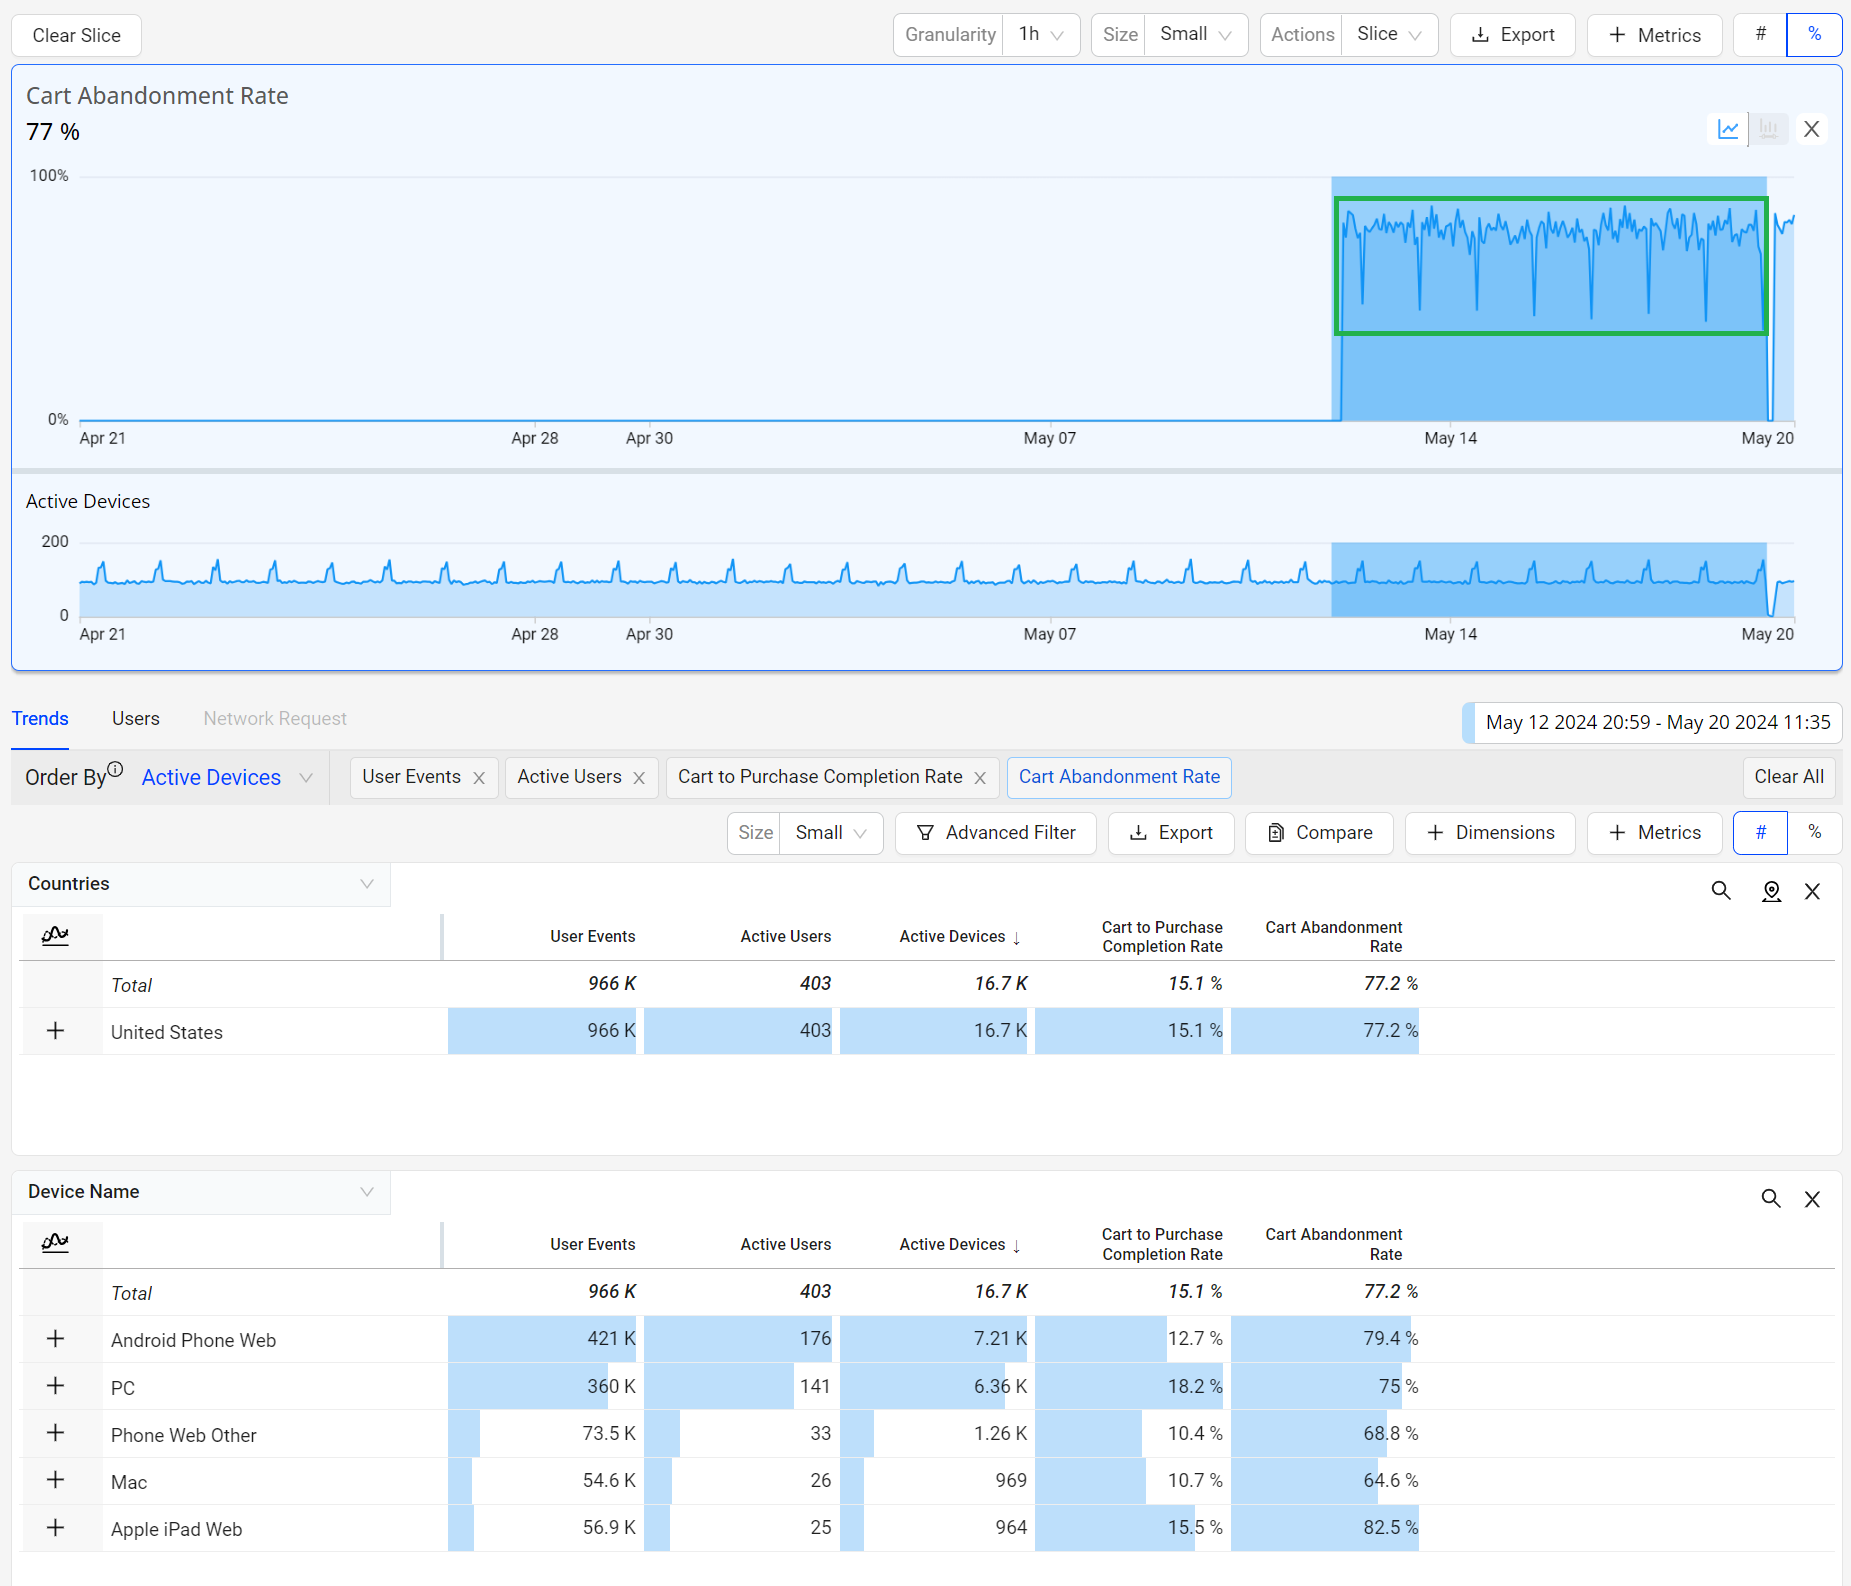
Drill-Down for Root Cause Analysis Details
Slice spikes and anomalies to focus your app sesssion data on only that period and activity. Quickly isolate and discover more detail about the root cause impacts. In this case, fcousing on cart abandonment rates within US sessions to compare device performance across cart ops and active users to prioritize remedial actions.
Historical Baselines (Up To 13 Months)
High performance queries (responses in seconds) are available for up to 13 months of historical data. This comprehensive data access enables the same Trends features to be used for baseline experience improvement use cases by Product and Engineering teams, along with Real-Time monitoring by Ops and Support Teams.
Build Your Own Custom Metrics
With Conviva DPI, you can also easily leverage all your captured events to enable your own experience-centric metrics, based on event combinations and user behaviors. Captured events can be configured and unified for consistency across all your events and actitivity flows. For more detail about mapping events, see Activate Events.
Create your own experience metrics, using the mapped events and metric templates with the assistance of pre-filled fields and commonly used event associations. For more detail about building metrics, see Building Metrics.

AI-Based Alert Notifications
AI alerting is an advanced feature that eliminates the need to manually determine the thresholds, identify the relevant dimensions that you need to monitor, and set alert notifications for related individuals and groups. With real-time anomaly detection and automatic diagnostics across thousands to millions of cohorts, AI alerts help Operations and Support Teams maximizing flawless online shopping experiences.
The Conviva AI Alerting system continuously checks for anomalies and computes a baseline along with a range of variation for the metric(s) based on the mean and standard deviation derived from historical data. AI monitors the range of variation and builds performance patterns that evaluate the traffic in the past few minutes. If the upper boundary range or threshold is exceeded, an anomaly is detected, which then triggers the diagnosis process to determine if an alert should be fired based on the sensitivity control settings and the root cause of the event.
When an alert condition returns to the accepted range of variation and sensitivity control limits, the AI alert ends and the alert condition clears, adding the alert to the Alert Ended totals. The specific threshold for each severity level is configured in the sensitivity controls. For more details on setting the sensitivity controls, see AI Alert Sensitivity.
AI alerts offers automatic anomaly detection and fault isolation across the following key metrics and key dimensions, along with the ability to a custom dimension combinations.
| Metrics |
|
|---|---|
|
Dimensions (Root-cause) |
|
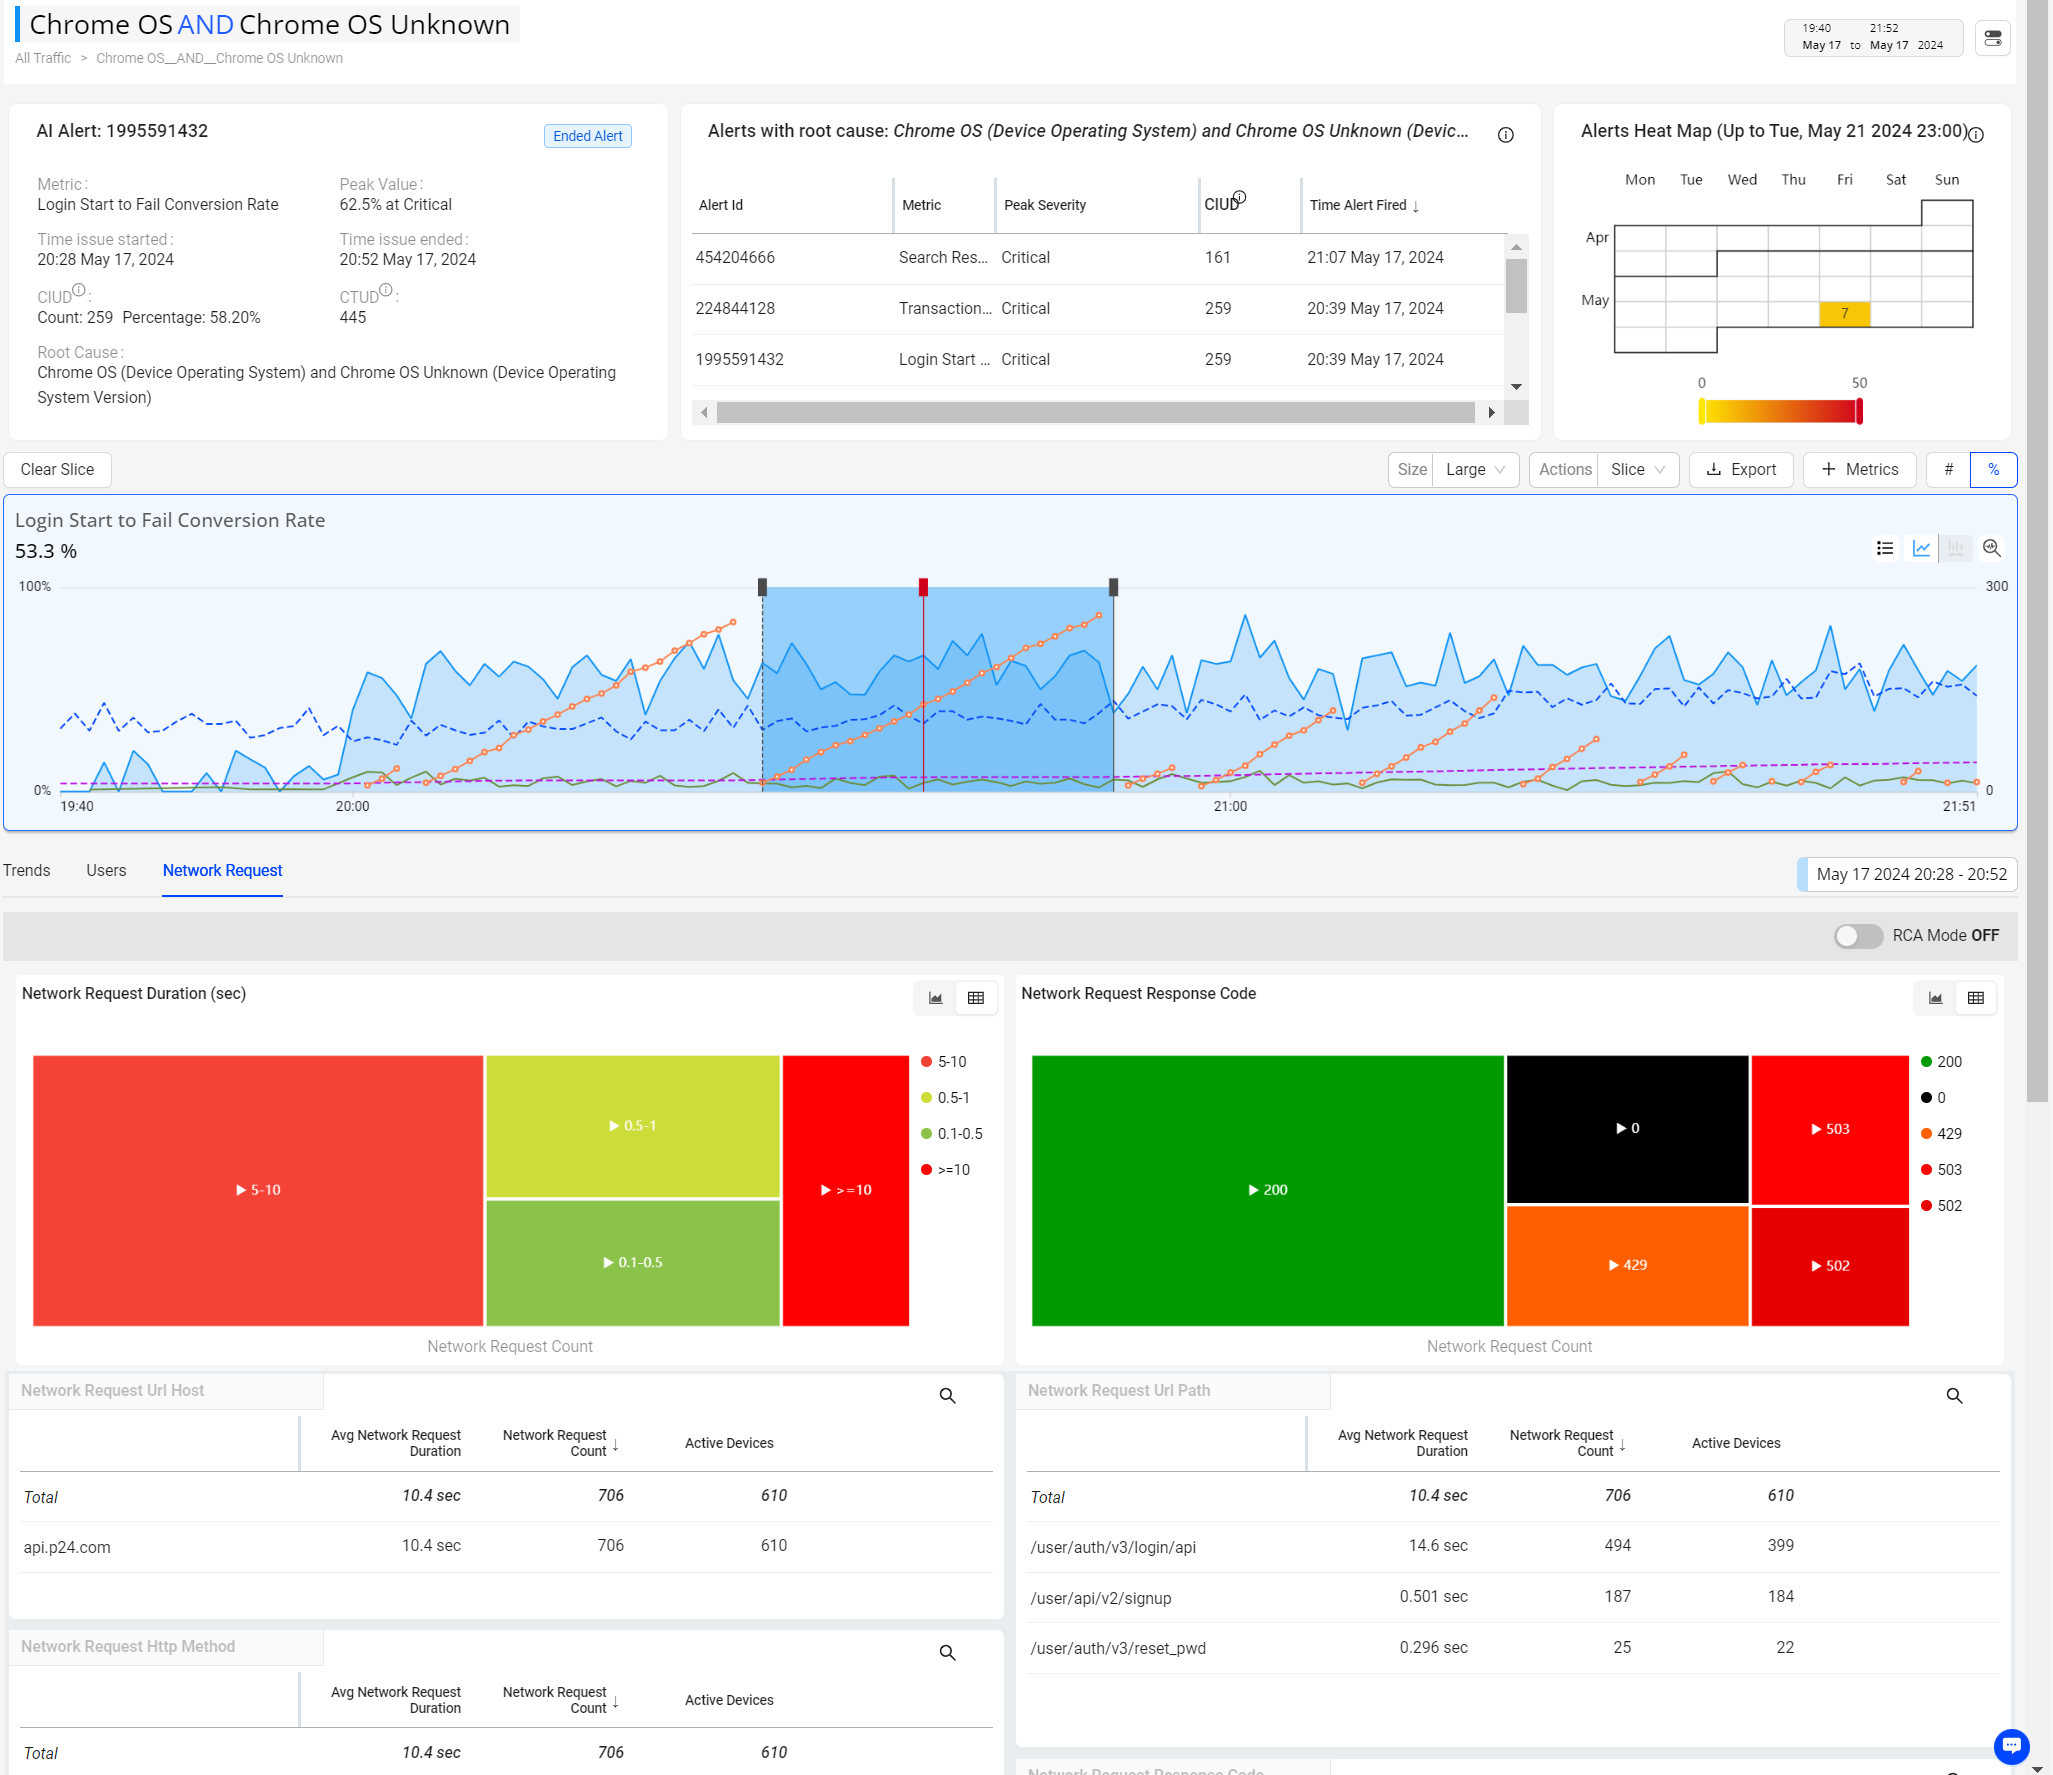
From AI markers in metric widgets or alert summaries, launch deailed alert analysis to trace alert progression across device and user impacts, along with related network request performance.
In this example, follow the Login Start to Fail Conversion Rate anomalies, with the shaded alert area showing increasing impacted devices until the alert ended. The network request duration data indicates the offending request.
Flexible Analytics in Custom Dashboards
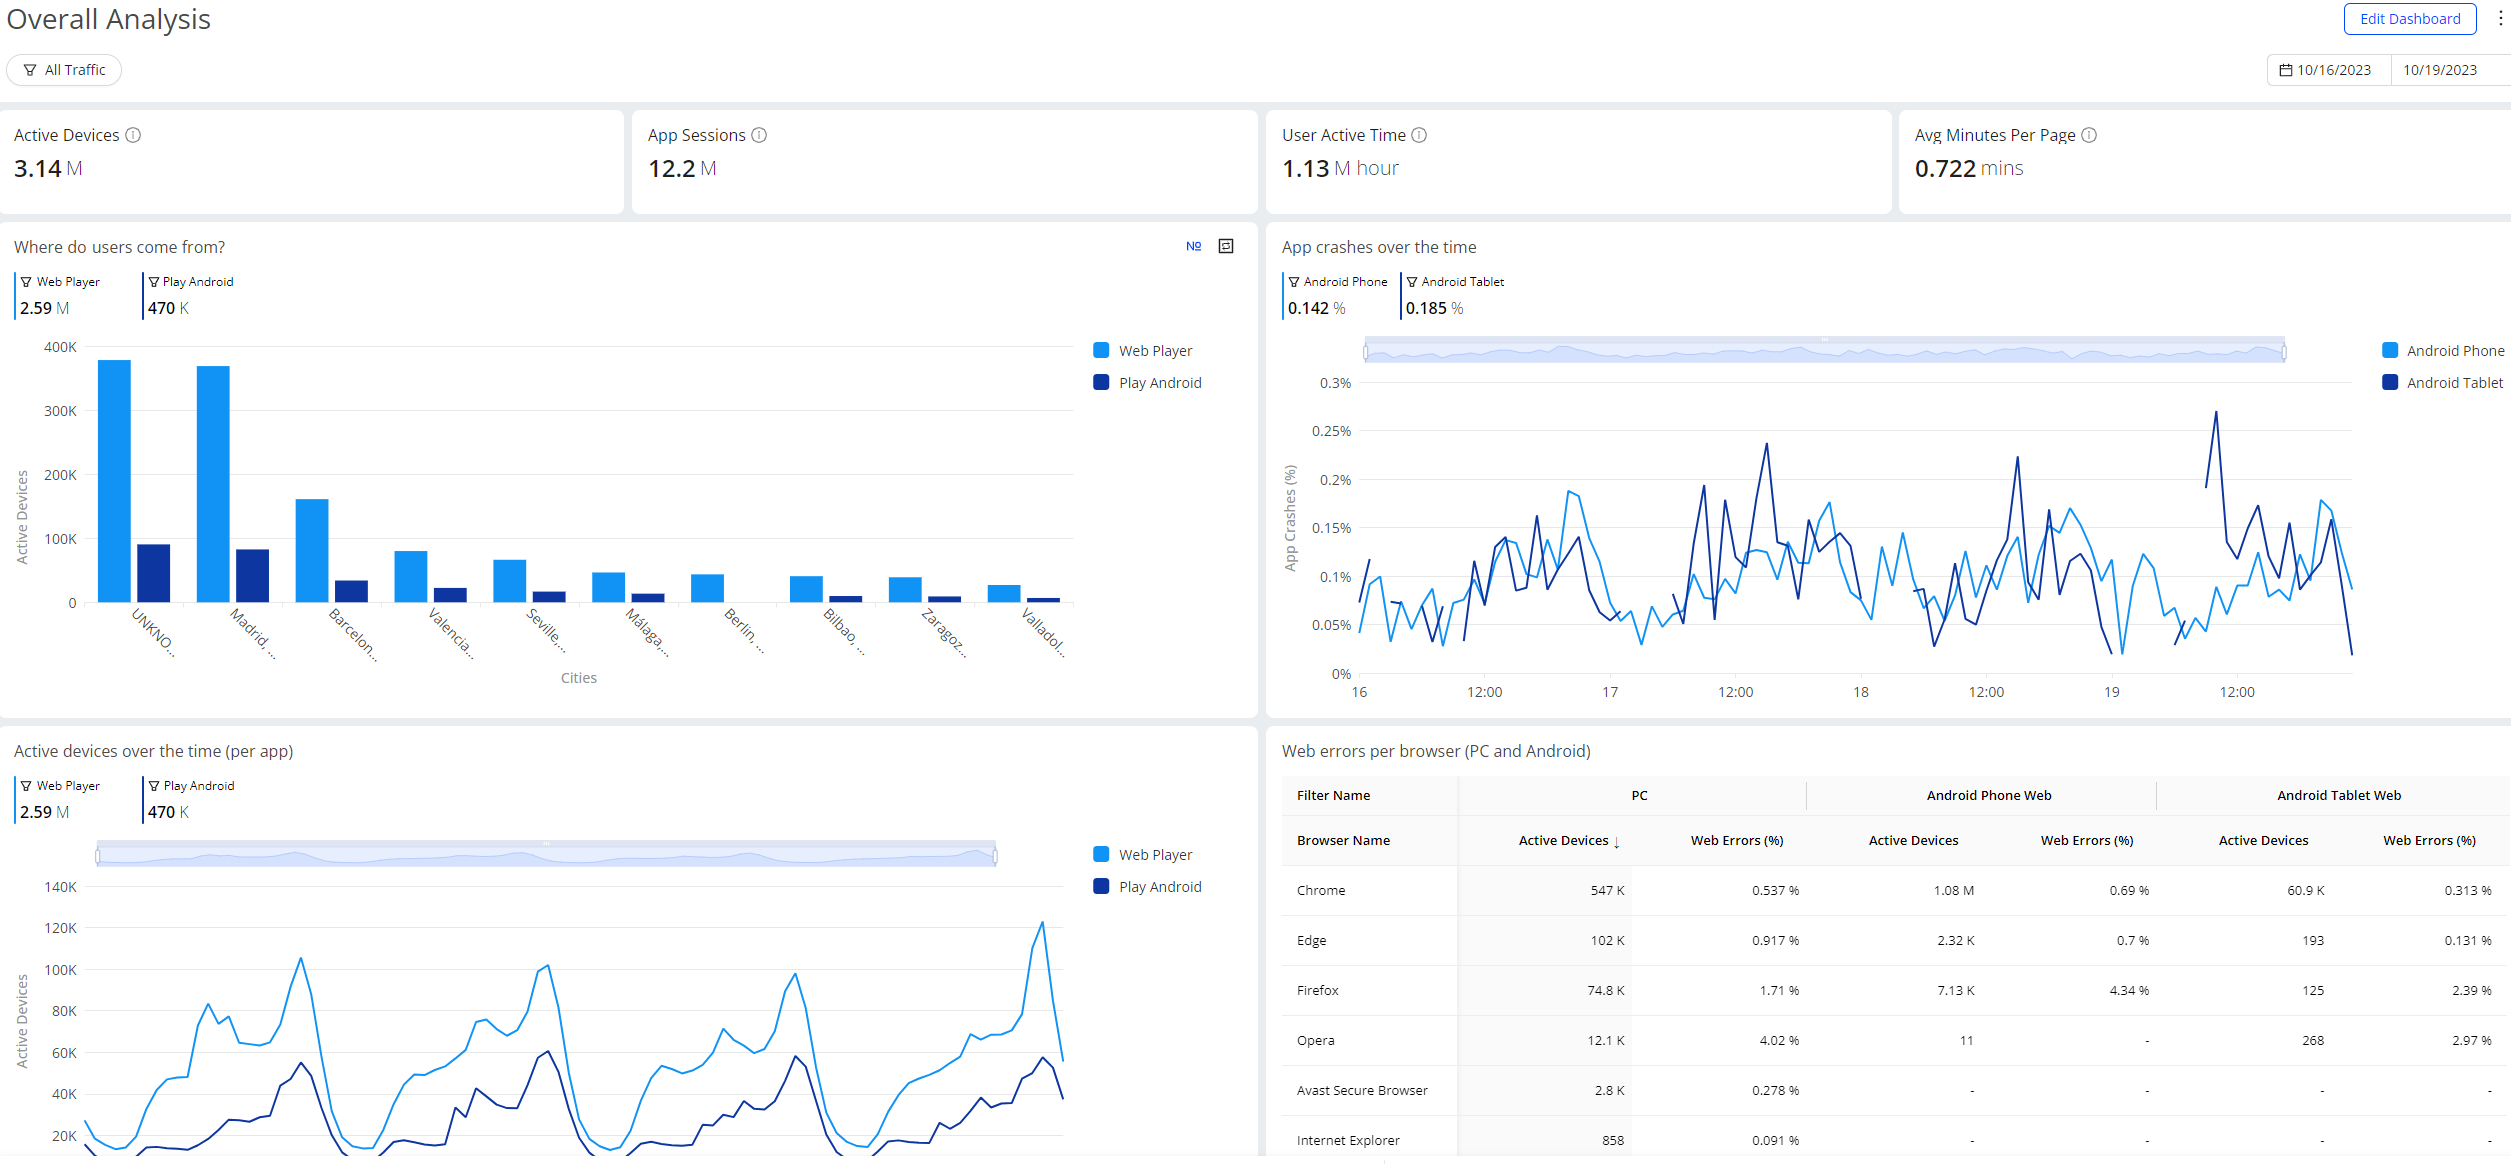
Custom dashboards enable flexible combinations of widgets and display options to highlight the insights that are most meaningful to your users and business goals. Customized widgets display metrics and dimensions in summary, table, and distribution formats with data from multiple data sources.
In addition, filter settings for each dashboard allow you to target specific dimension groups, such as Roku devices in US cities with app access viewed during the last 30 days.
Share Custom dashboards with all or select users to boost collaboration and team communication.
For more details, see DPI Experience Metric Use Cases.