
Conviva Docs
Welcome to Conviva Docs!
Our documentation resources are designed to familiarize you with Conviva features, workflows, and common use cases. Get started with Conviva’s real-time performance analytics using Conviva Digital Product Insights (DPI) and Conviva Video Streaming Insights (VSI).
Discover Conviva’s DPI Capabilities
Conviva’s DPI connects real-time end-user experiences with digital application performance, enabling a new level of integrated application performance, network services, and critical user journey analysis.
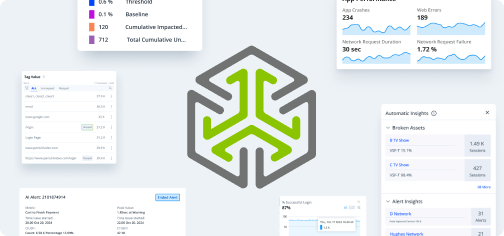
Real-Time User Monitoring
Measure app performance and user experience, focusing on critical user journeys (Flows), tracking success along with failure rates, and journey durations.
AI-Driven Alerts
Proactively identify and alert on real-time anomaly detection and performance deviations in critical user journeys and overall application performance.
Continuous Improvement
Set clear baselines and gain ongoing insights into user engagement, experience quality, and technical performance.
Flexible Ad Hoc Analytics
Easily apply semantic mappings and user-defined metrics at the Conviva Platform to better understand and improve digital experiences with minimized client-side updates.
Minimal Client-Side Instrumentation
Effectively ingest events and monitor sections of user journeys in real-time with minimal front-end effort by leveraging backend-driven event management and remote mapping.
OpenTelemetry-Compatible Trace IDs
Easily connect front-end experience issues with backend APIs, reducing diagnostics along with MTTD and MTTR.
Get Started in 3 Quick Steps
![]()
Activate Data
![]()
Monitor and Analyze Performance
Monitor Out of Box Metrics
Explore DPI Features
Explore VSI Features