Conviva ODP Explained
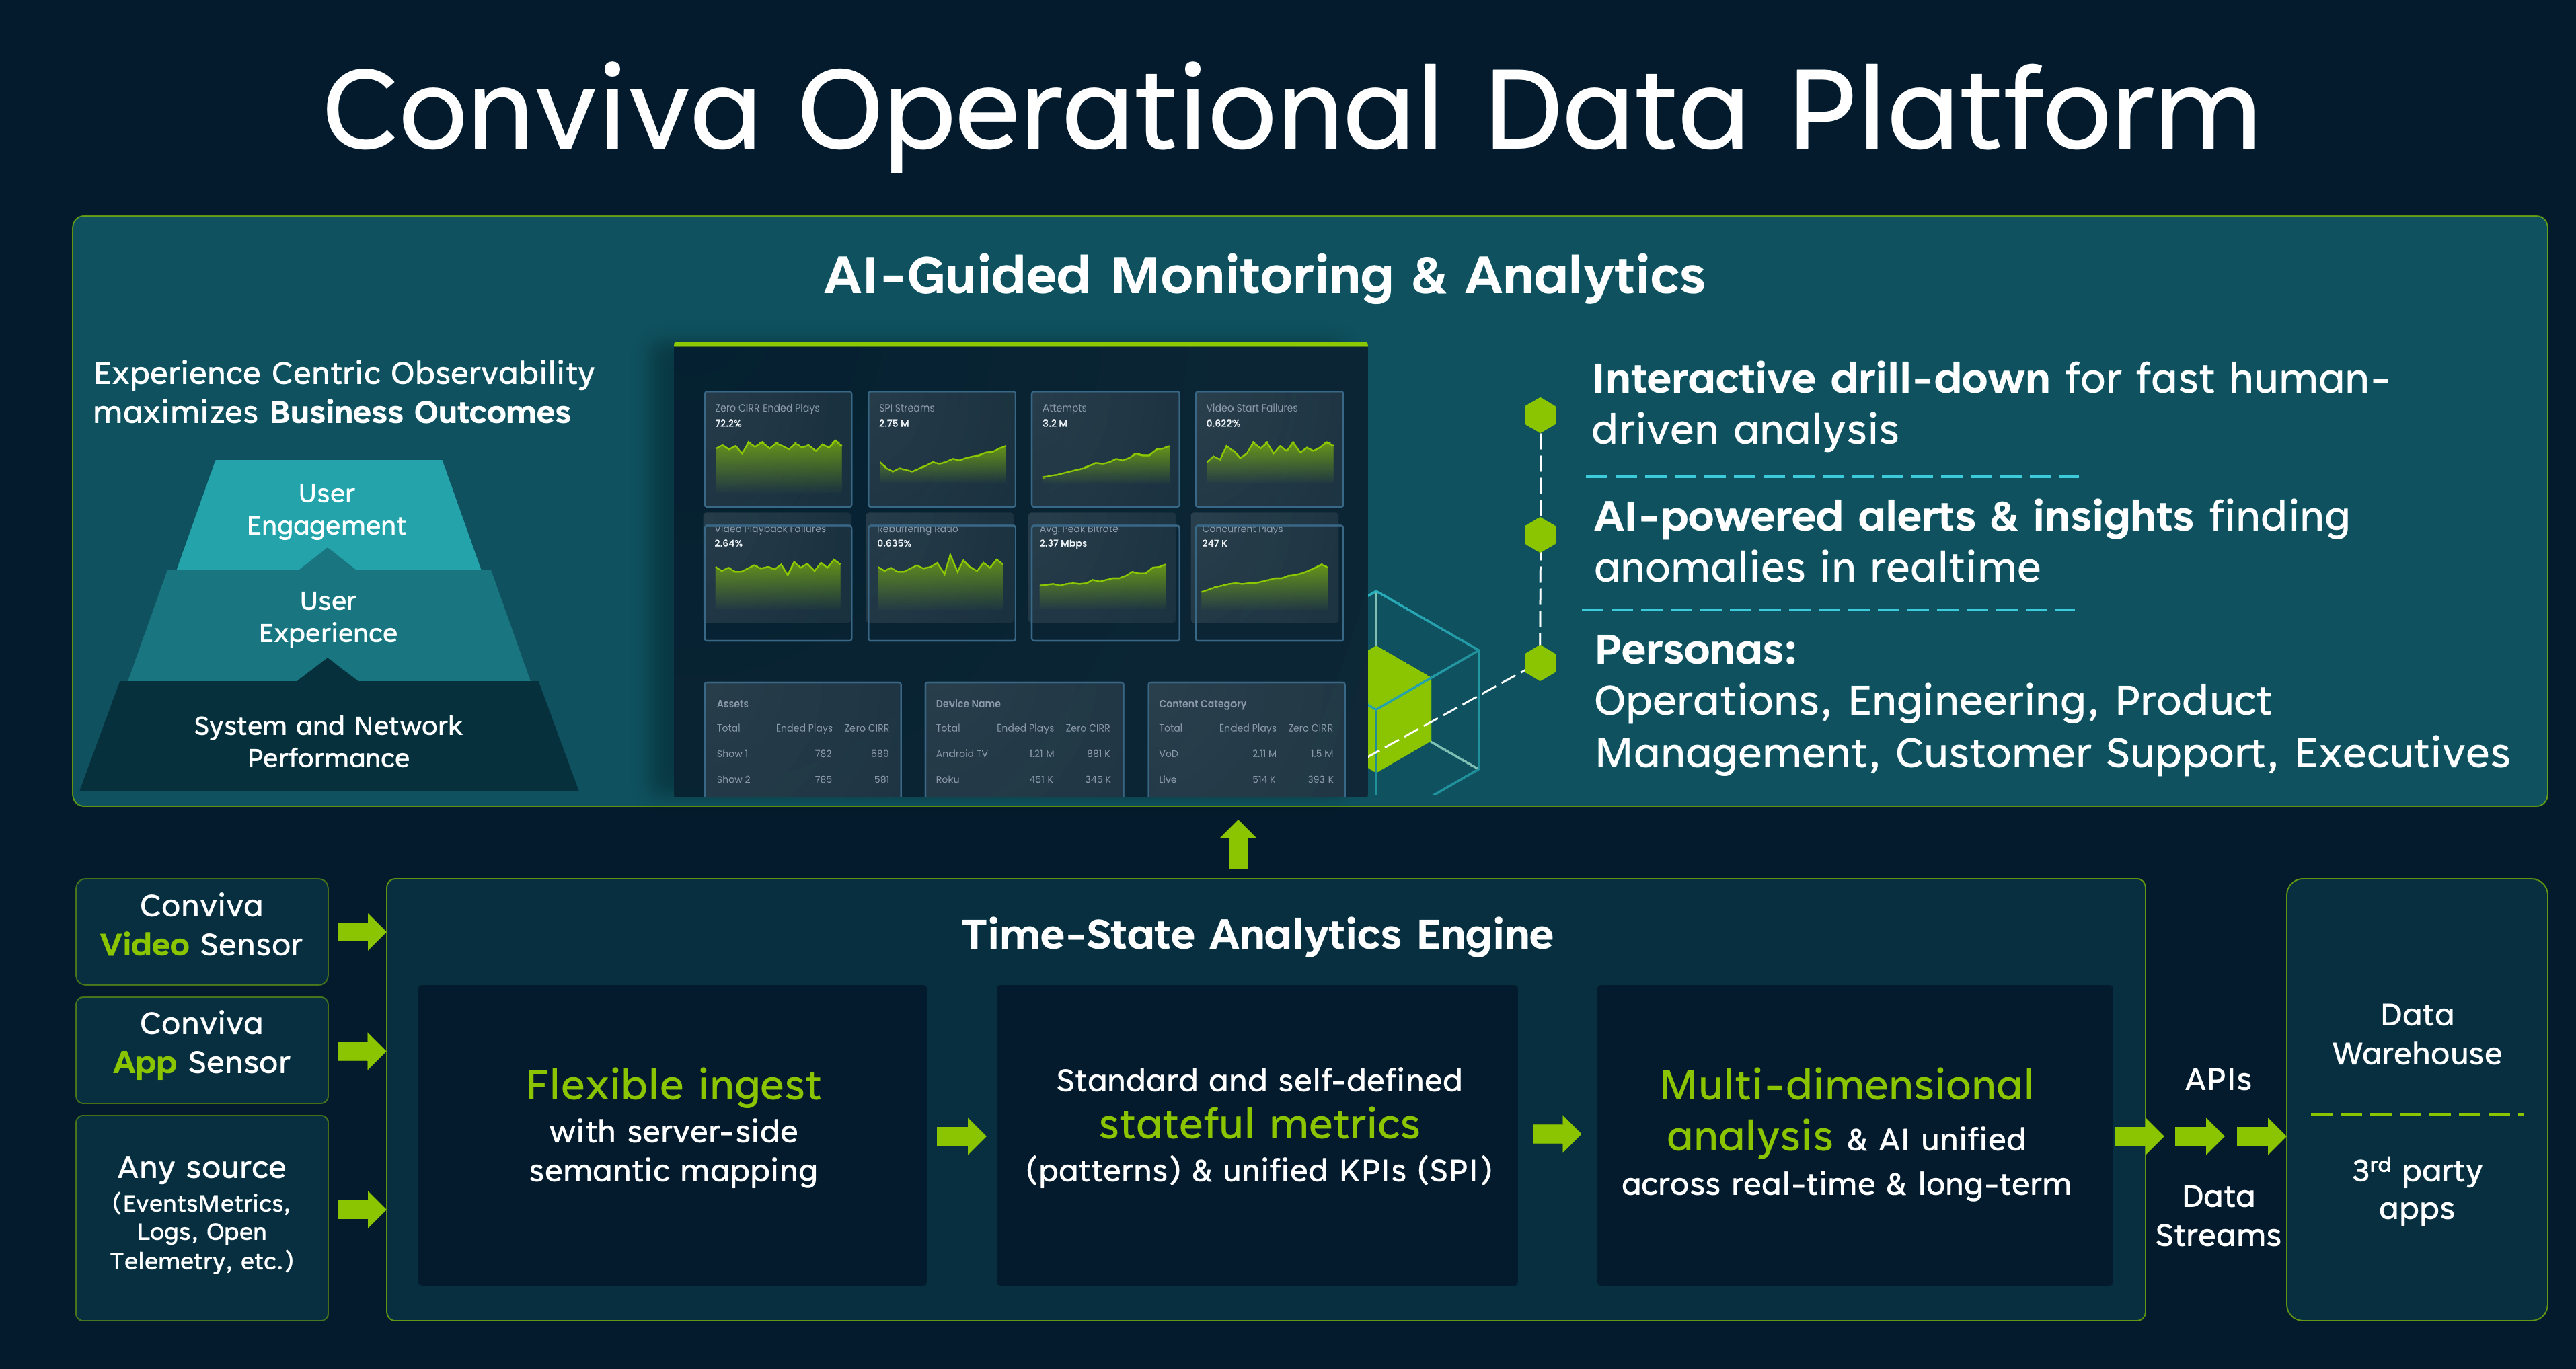
Conviva Operational Data Platform enables experience-centric operational analysis for real-time optimizations connecting user impacts with backend infrastructure performance across applications, networks, platforms, video streams and other event stream sources.
To support real-time, connected, business and operational decisions, Conviva delivers an industry-leading operational data platform with Stateful Analytics and Explainable AI, that together enable a new paradigm of Digital Product Insights (DPI).
Most observability and monitoring tools rely only on a bottoms-up approach traversing logs, traces, and performance metrics in search of pinpointing the technology paths that may or may not connect with the impacted user experience touch points.
Enter, Conviva; its Pulse VSI and DPI applications with actual user experience measurements and metrics that empower insightful real-time data alerting and drilldowns into the affecting session and application root-cause layers--enabling rapid issue isolation and root cause resolution of actual experience impacts.

Stateful Metrics and Server-Side Sessionization
Conviva VSI and DPI apply stateful processing across the tech stack and user experiences maintaining real-time observability of the events, requests, and state changes that occur during each video and application session, enabling intelligent computations across these data points within each active session. No need to wait for session end and latency-plagued historical data gathering. The combination of sessionization, extensive dimensional metadata, and real-time metrics enable enhanced user experience observations and technology stack correlations, so teams can focus on resolving actual experience-impacting issues in real-time.
In Conviva Pulse, stateful metrics consider the time video and app sessions spend in a given state or sequences of states and events. For example:
-
Video Start Time is the time from when a user clicks play to the first playing state that lasts longer than 200 miliseconds (avoiding counting false player states where just a frame displays but the player only buffers content).
-
Connection Induced Rebuffering Time is the time spent in buffering state after a playing state, excluding buffering after seek events (which counts as Video Restart Time).
-
Login Process Duration is the time from when a user initiates a login process to when login successfully completes.
-
Good Subscription Experience tracks when a user starts and finishes the subscription process within X seconds.
-
Count of IP-enabled STB reboots with x minutes after firmware update.
Without the limits of stateless processing that only maintain isolated instantaneous data values stored independent of other previous event/state changes, Conviva stateful metric processing activates real-time operational analysis, letting you know when user experiences flag video and application issues so you can act quickly to rectify engagement and revenue impact risks.
For example, with Conviva DPI:
|
App Issues Impacting User Experience |
Conviva Metrics |
Conviva Root Cause Dimensions |
|---|---|---|
|
|
|
Furthermore, session and user timelines allow you to debug app issues based on the actual video and app session events.
Hypercube Engine
Designed from the ground up for advanced real-time stateful metric comparisons at the scale, theConviva Hypercube engine analyzes a vast array of combinatorics across video and app dimensional entities, enabling pattern correlation in session and user experience impacts. The correlation possibilities scale to match the complexities of modern web technology stacks and experience-centric observations, for example, performing comparative analysis drill downs to isolate application sessions with Login Times that spiked only on specific device operation systems in a limited geographic area.
Furthermore, Conviva’s real-time, time-state pipeline and computations run at the scale of Internet audiences with high availability and cost efficiency, performing context-sensitive computation over continuously evolving session states at a fraction of the latency and cost of traditional SQL-based computations.
-
Real-Time - Low latency from raw event ingest to actionable insights enabling actionability in seconds to minutes.
-
High Performance – Fast, interactive multi-dimensional queries with high concurrency on real-time and historical data enabling quick analysis by many users simultaneously.
-
Fully Integrated – Integrated platform from raw event ingest to actionable insights, including the UI, eliminating the need for customers to piece together multiple big data systems.
-
Internet Scale – Able to handle millions of concurrent endpoints with high volume of measurements.
-
High Efficiency – Low cost (as much as 10x lower) compared to other technologies.
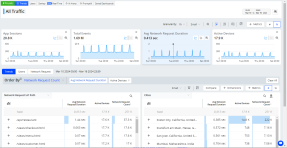
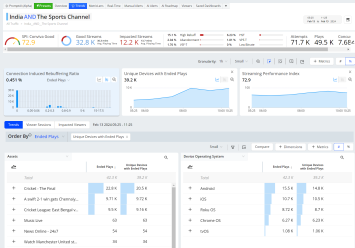
Conviva VSI and DPI display stateful metrics in time series and distributions for session selection based on metric performance, along with dimensional tables that enable real-time comparative analysis of complex drill-downs across the session dimensional entities, such as specific network request durations across multiple page URLs.
For example, session selection based on a network request duration spike and average page load times from 0 to 5 seconds.
Dimension drill-down by offending network request API to compare page URL performance.
Standard and Self-Defined Stateful Metrics
Conviva provides a robust set of out-of-box metrics for both DPI and VSI so you can quickly get started with operational and experience-centric performance improvements.
DPI Out-of-Box Metrics
DPI standards metrics include:
-
App Crashes
-
Time To First Attempt
-
Avg Screen/Page Load Time
-
Network Request Count
-
Avg Network Request Duration
-
Total Devices
-
and many more...
These metrics, along with your custom metrics and metadata appear in metric time series and distribution widgets in dimension drill-down tables.
For a complete list of the standard DPI metrics, see DPI Out-of--Box Metrics and Metadata. For VSI metrics, see VSI Out-of-Box Metrics and Metadata.
Build Your Own Custom Experience Metrics
Conviva empowers an innovative layer between the Conviva sensor and Pulse that visualizes the data pulled into Conviva from your app for custom experience metric compilation. Specifically, Metric Builder options enable custom time-interval and conversion metrics so that you can analyze complex app and video flow scenarios, such as analyzing the delay between when users login to their account and the start of video playtime.
-
Time Interval Metric: Measures the duration between two events, such as the duration between the login screen event and the login success event.
-
Conversion Metric: Measures the count or conversion rates of events from one stage to another, such as the count of sessions with successful login after opening the login screen.
Create your own custom experience metrics for tracking interval and conversion based event analysis.
VSI Metrics
ConvivaVSI provides a rich set of standard metrics enabled through data ingest from Conviva SDK and player libraries, such as Video Startup Time, Connection Induced Rebuffering Ratio, and Video Playback Failures.
These metrics, along with your custom experience metrics and metadata appear in metric time series and distribution widgets along with dimension drill-down tables.
For a complete list of the standard VSI metrics, see Metric Dictionary.
Explainable AI-Driven Insights
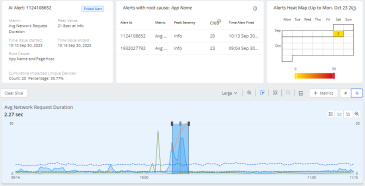
Often complex application performance and user experience issues remain undetected; here too, Conviva has you covered. AI-based algorithms and AI-driven alerts automatically surface anomalous events and insights to identify the under-performing root cause group that crossed the established performance base line with significant unique user impacts. This example shows an AI alert for Avg Network Request Duration with performance baseline (dashed blue line), highlighted deviation spike (solid blue line) and impacted unique devices (orange line) and alert start/peak/end markers.
For more details about AI alerts, see DPI AI Alerts and VSI AI Alerts.
Conviva Connect APIs and Data Feeds
With integrated API calls and data feeds, access and share real-time and historical experience, engagement, and identity data in a variety of methods for reporting, analysis, enrichment, and activation purposes.
Conviva provides the following APIs and Data Feeds:
-
Real-Time APIs for monitoring use cases (e.g power a real-time monitoring iOS app or a Graphana Dashboard where multiple data sources are combined). Query any metric across any metadata cohort.
-
Historical APIs to retrieve historical data to power custom applications or store data in a data warehouse system. Query any metric across any metadata cohort.
-
Individual Viewer APIs (Real-Time and Historical) for Customer Care use cases, supporting integrations with other tools as an alternative to the Conviva Pulse Users/Viewers Module.
-
Sessions API enables viewer sessions data based on specific criteria of metrics and metadata. Example: return sessions with more than 2% Rebuffering or Playback Errors in a given time interval.
-
Sessions Data Feed 24hour - all user sessions from the past 24 hours. Typically for data warehouse stores to run non-operation use cases or operational use cases not yet supported directly in Pulse.
-
Sessions Data Feed 1hour - similar as above but with all sessions delivered every hour.
-
Precision API to automate multi-CDN optimization with flexible business policies, ensuring the best CDN is used for each and every stream while respecting commercial CDN commitments.
For more details see, https:developer.conviva.com and Conviva Connect.
ODP ODP Stateful Stateful Metrics Hypercube Engine


