Explore Video Streaming Features
VSI provides a robust set of metrics to enable streaming performance monitoring and user behavior analysis across your streaming applications. Metric values appear as time series and distributions in metric widgets, and alongside dimensional values in the dimension drill-down tables.
In addition, use the advanced features for detailed metric time series analysis and advanced drill-downs across sessions, impacted view, and impacted devices.
This example shows the Preset for an overview of viewer experience metrics.
-
Access the Preset for Experience Overview
-
Slice the spike in Abandonment metric time series
-
Drill-down to impacted Assets dimension
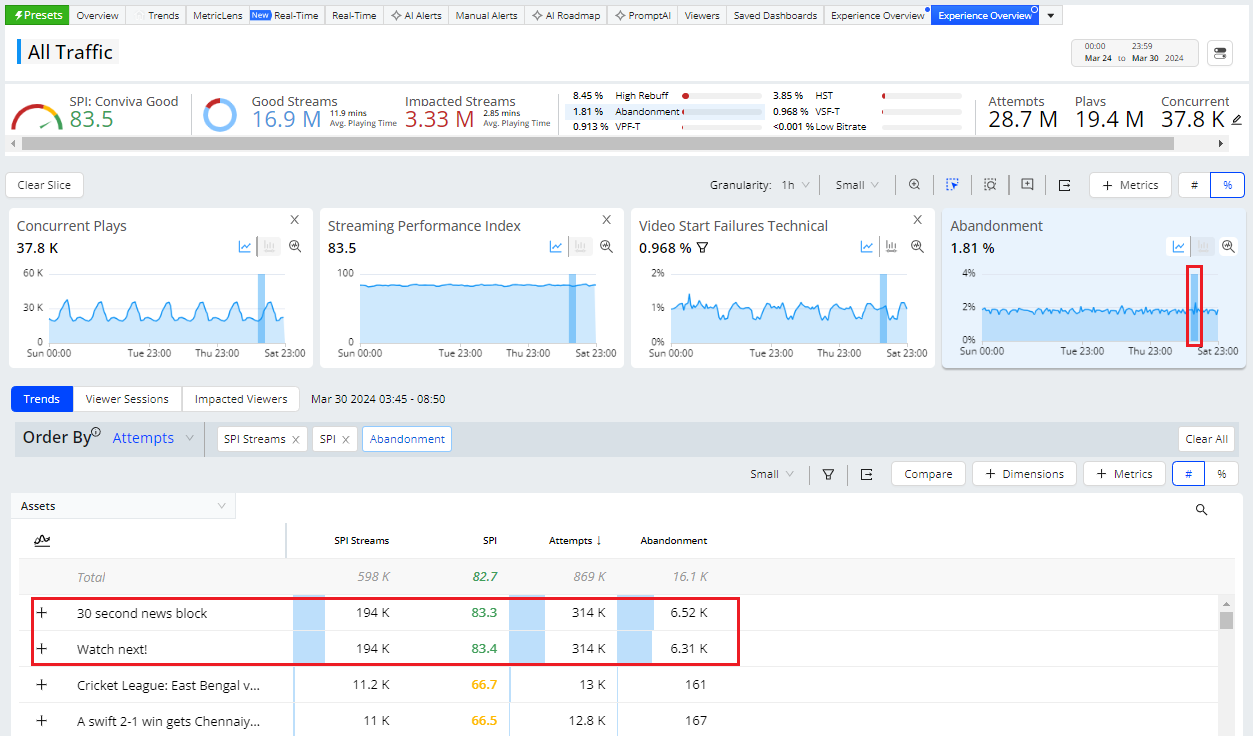
Preset: Experience Overview Example
You can also get started with other VSI Presets for pre-configured dashboards set up with metrics and metadata for the most common use cases.
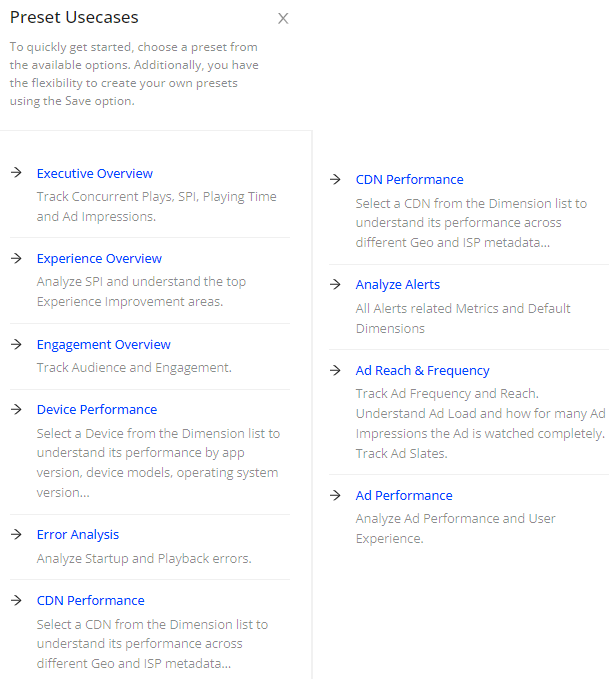
Video Presets
 Advanced Filters
In addition to standard filters, ConvivaVSI supports several advance filtering techniques for:
-
Quick instant filtering across dimension values
-
Basic and advanced filtering modes for complex AND/OR logic
-
Secondary filters for dragging across distributions for another layer for filtering, such as sessions with high CIRR and high bitrates.
-
Comparisons across dimension values for comparative analysis
Example of applying secondary filters for VST and rebuffering.
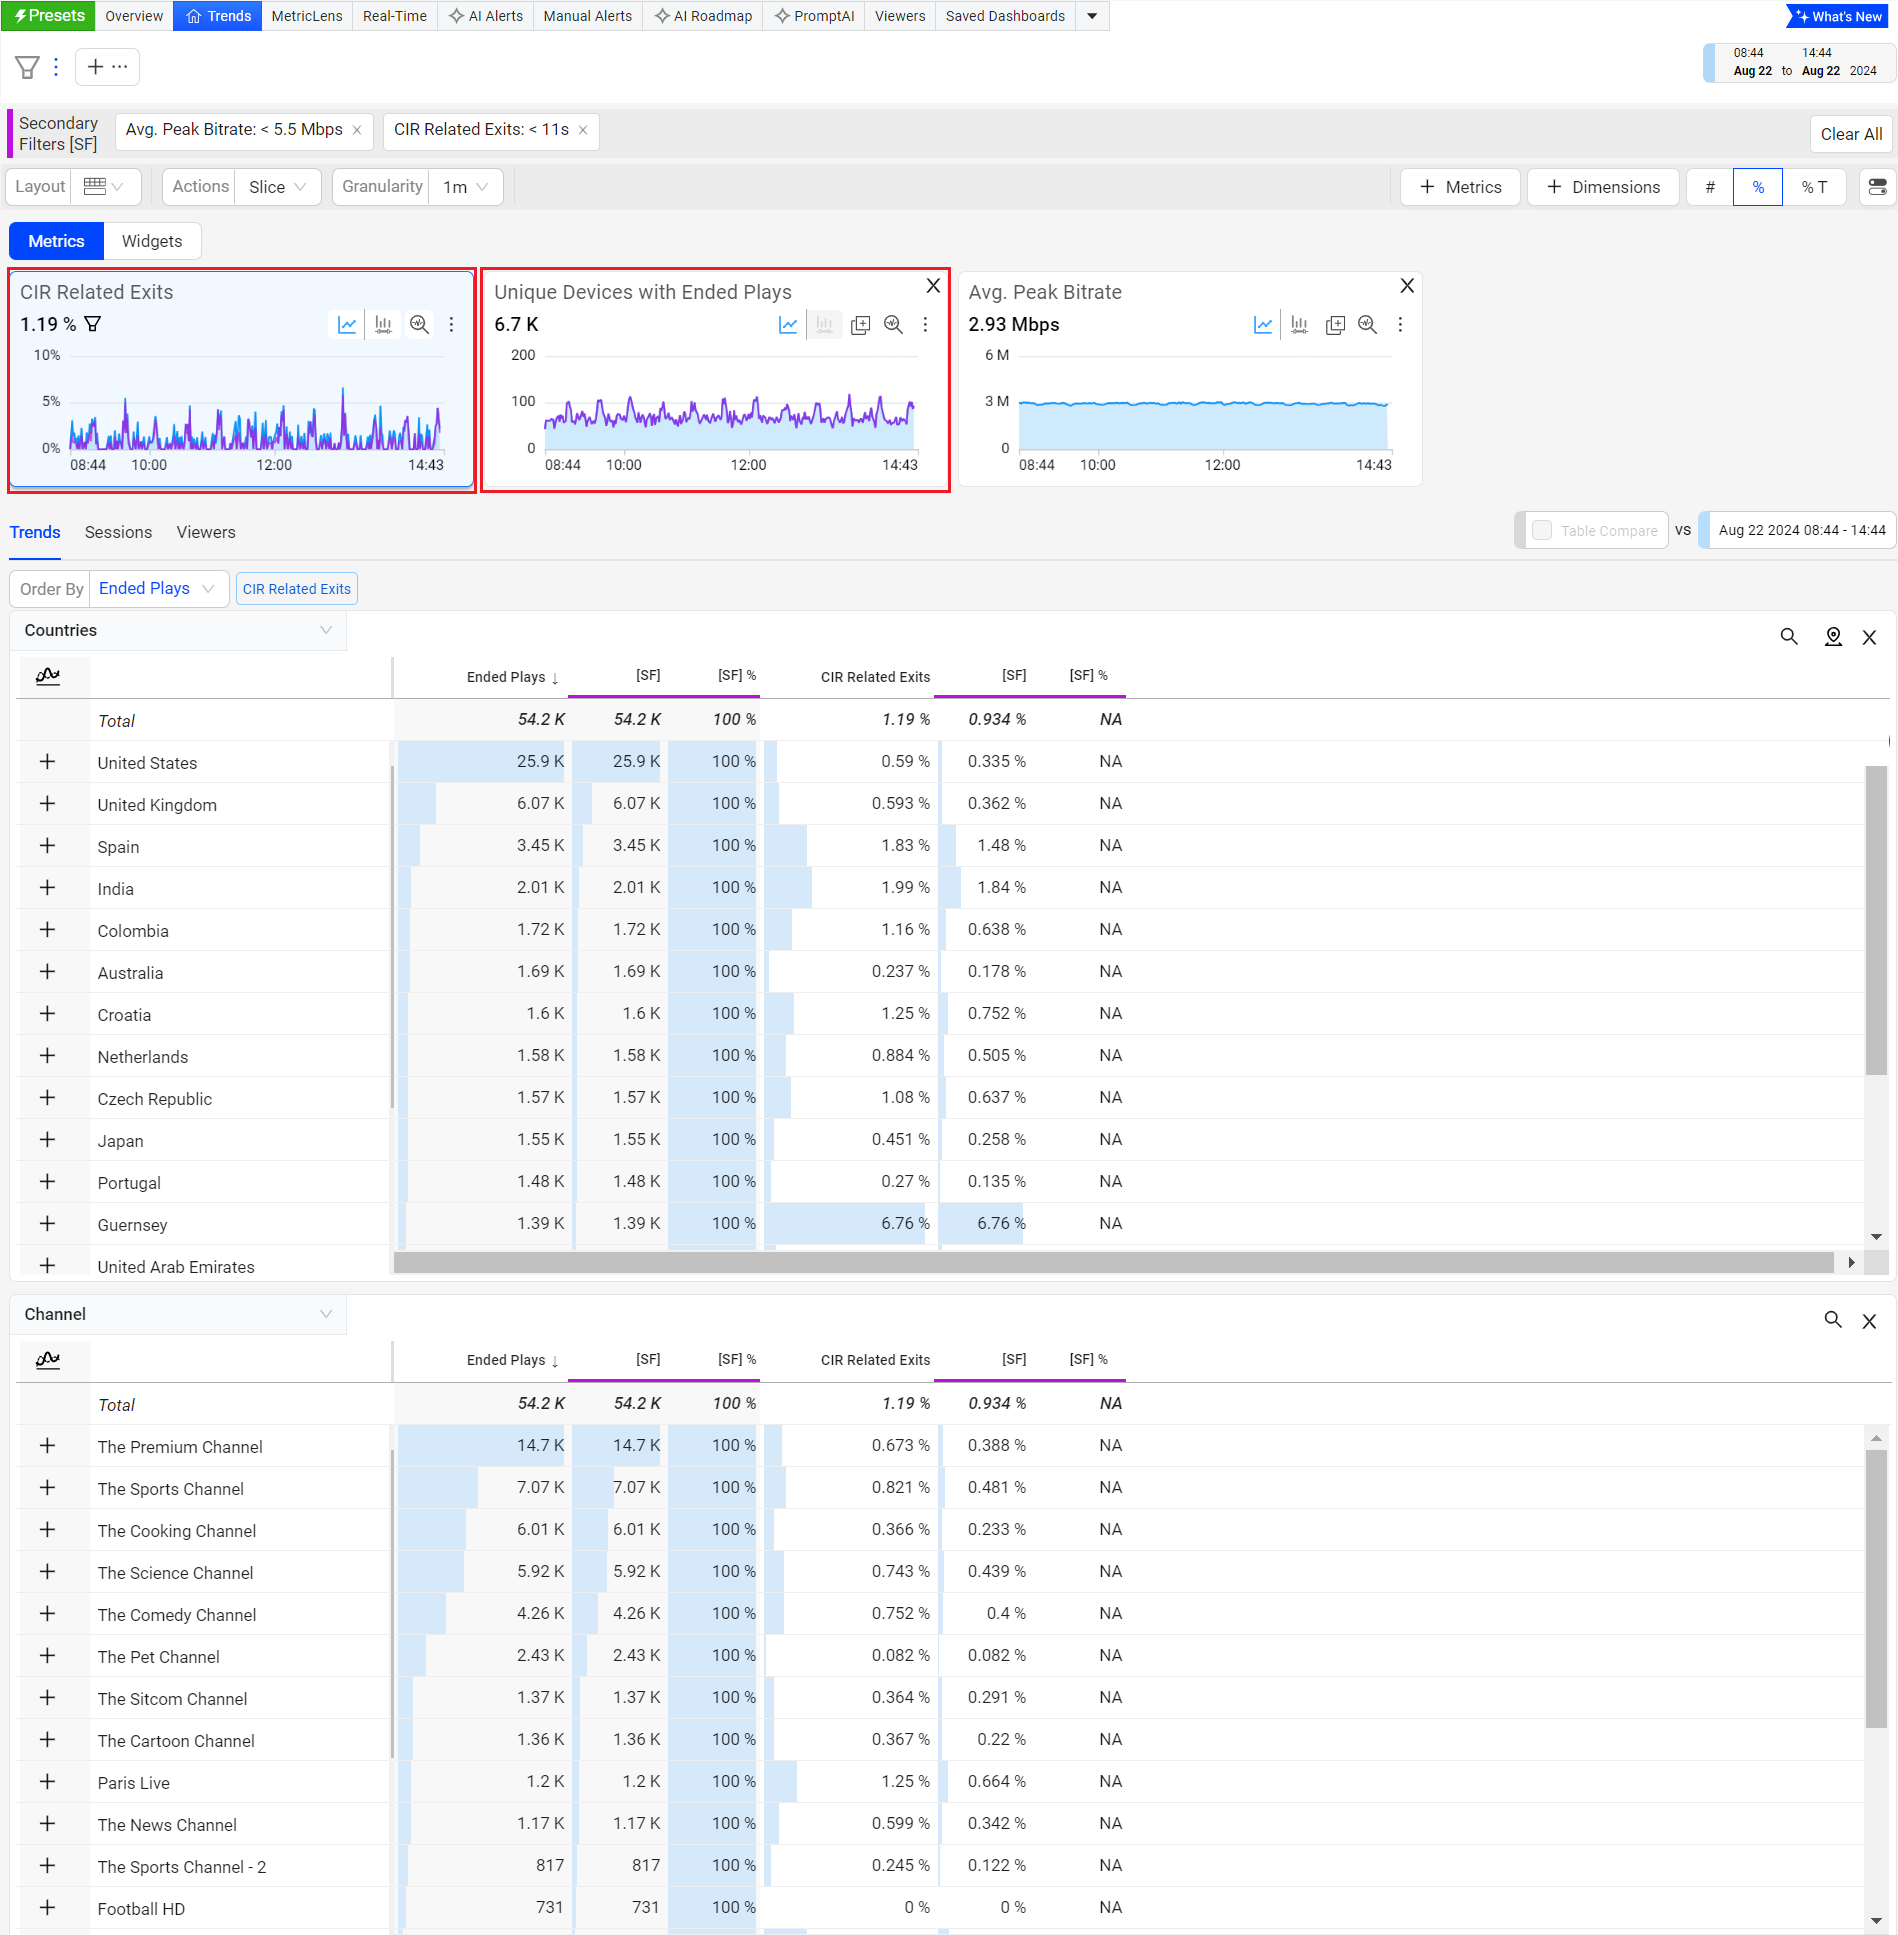
Secondary Filter Example
For more details on filtering, see Trends Filtering.
 Rich Set of Diagnostics
ConvivaVSI supports numerous advance techniques for diagnosing issues both in real-time for issue resolution, and across patterns for continuous improvements.
Example of using SPI to discover performance issues impacting KPIs.
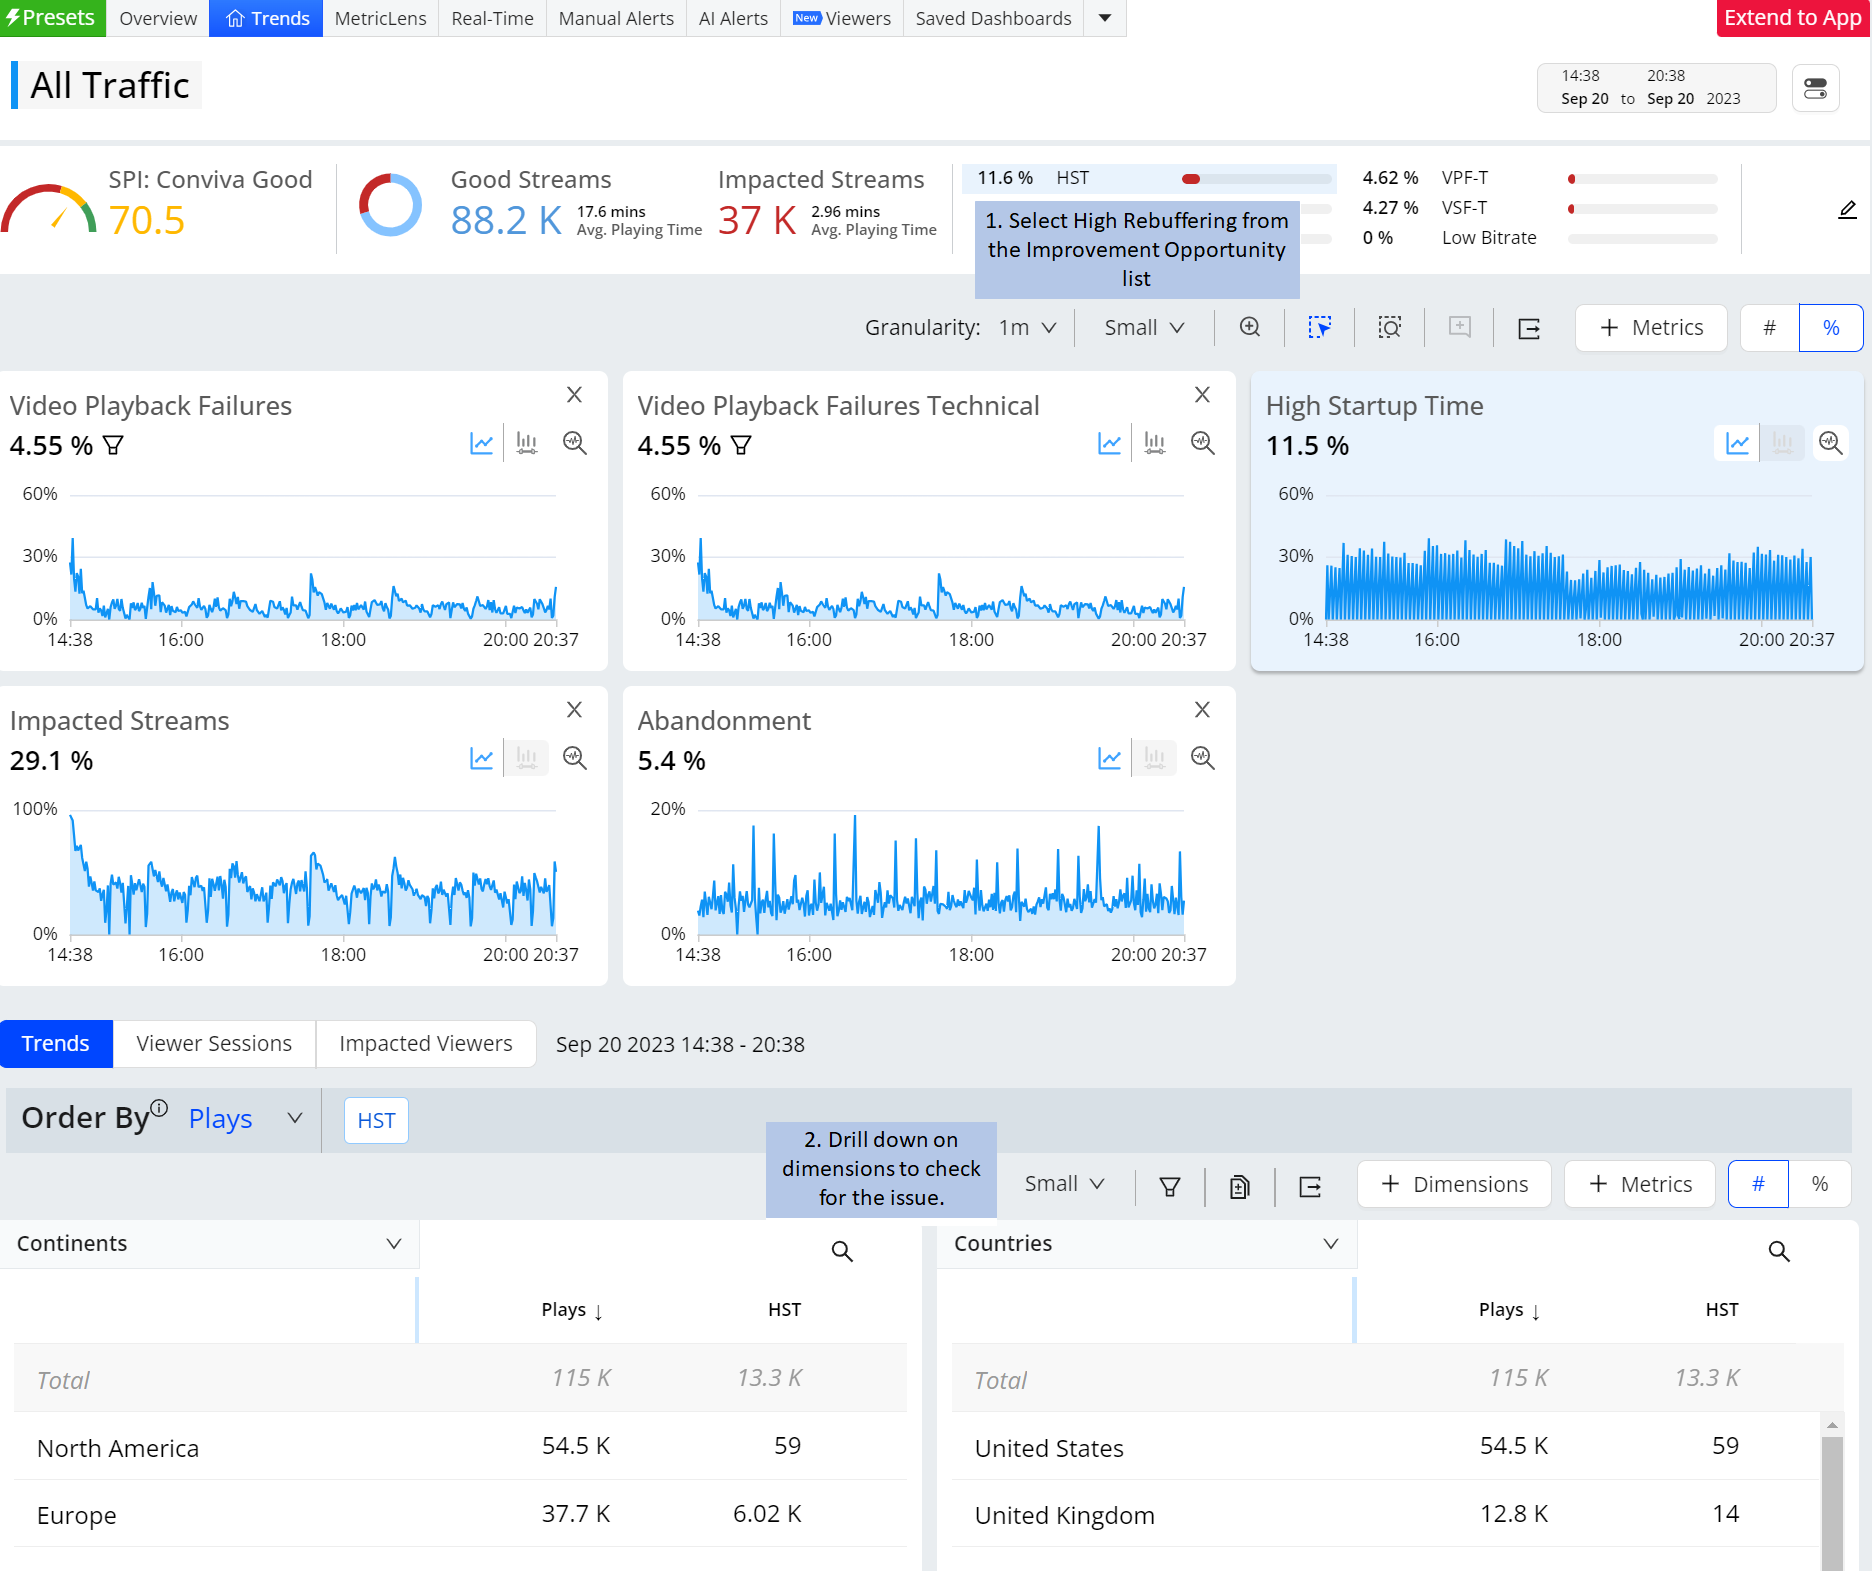
SPI Performance Example
For a complete list of VSI diagnosistics, see the Trends Diagnostics.
 Impacted Viewer Sessions and Timelines
Within Trends, slice an anomaly and quickly access data for the impacted sessions.
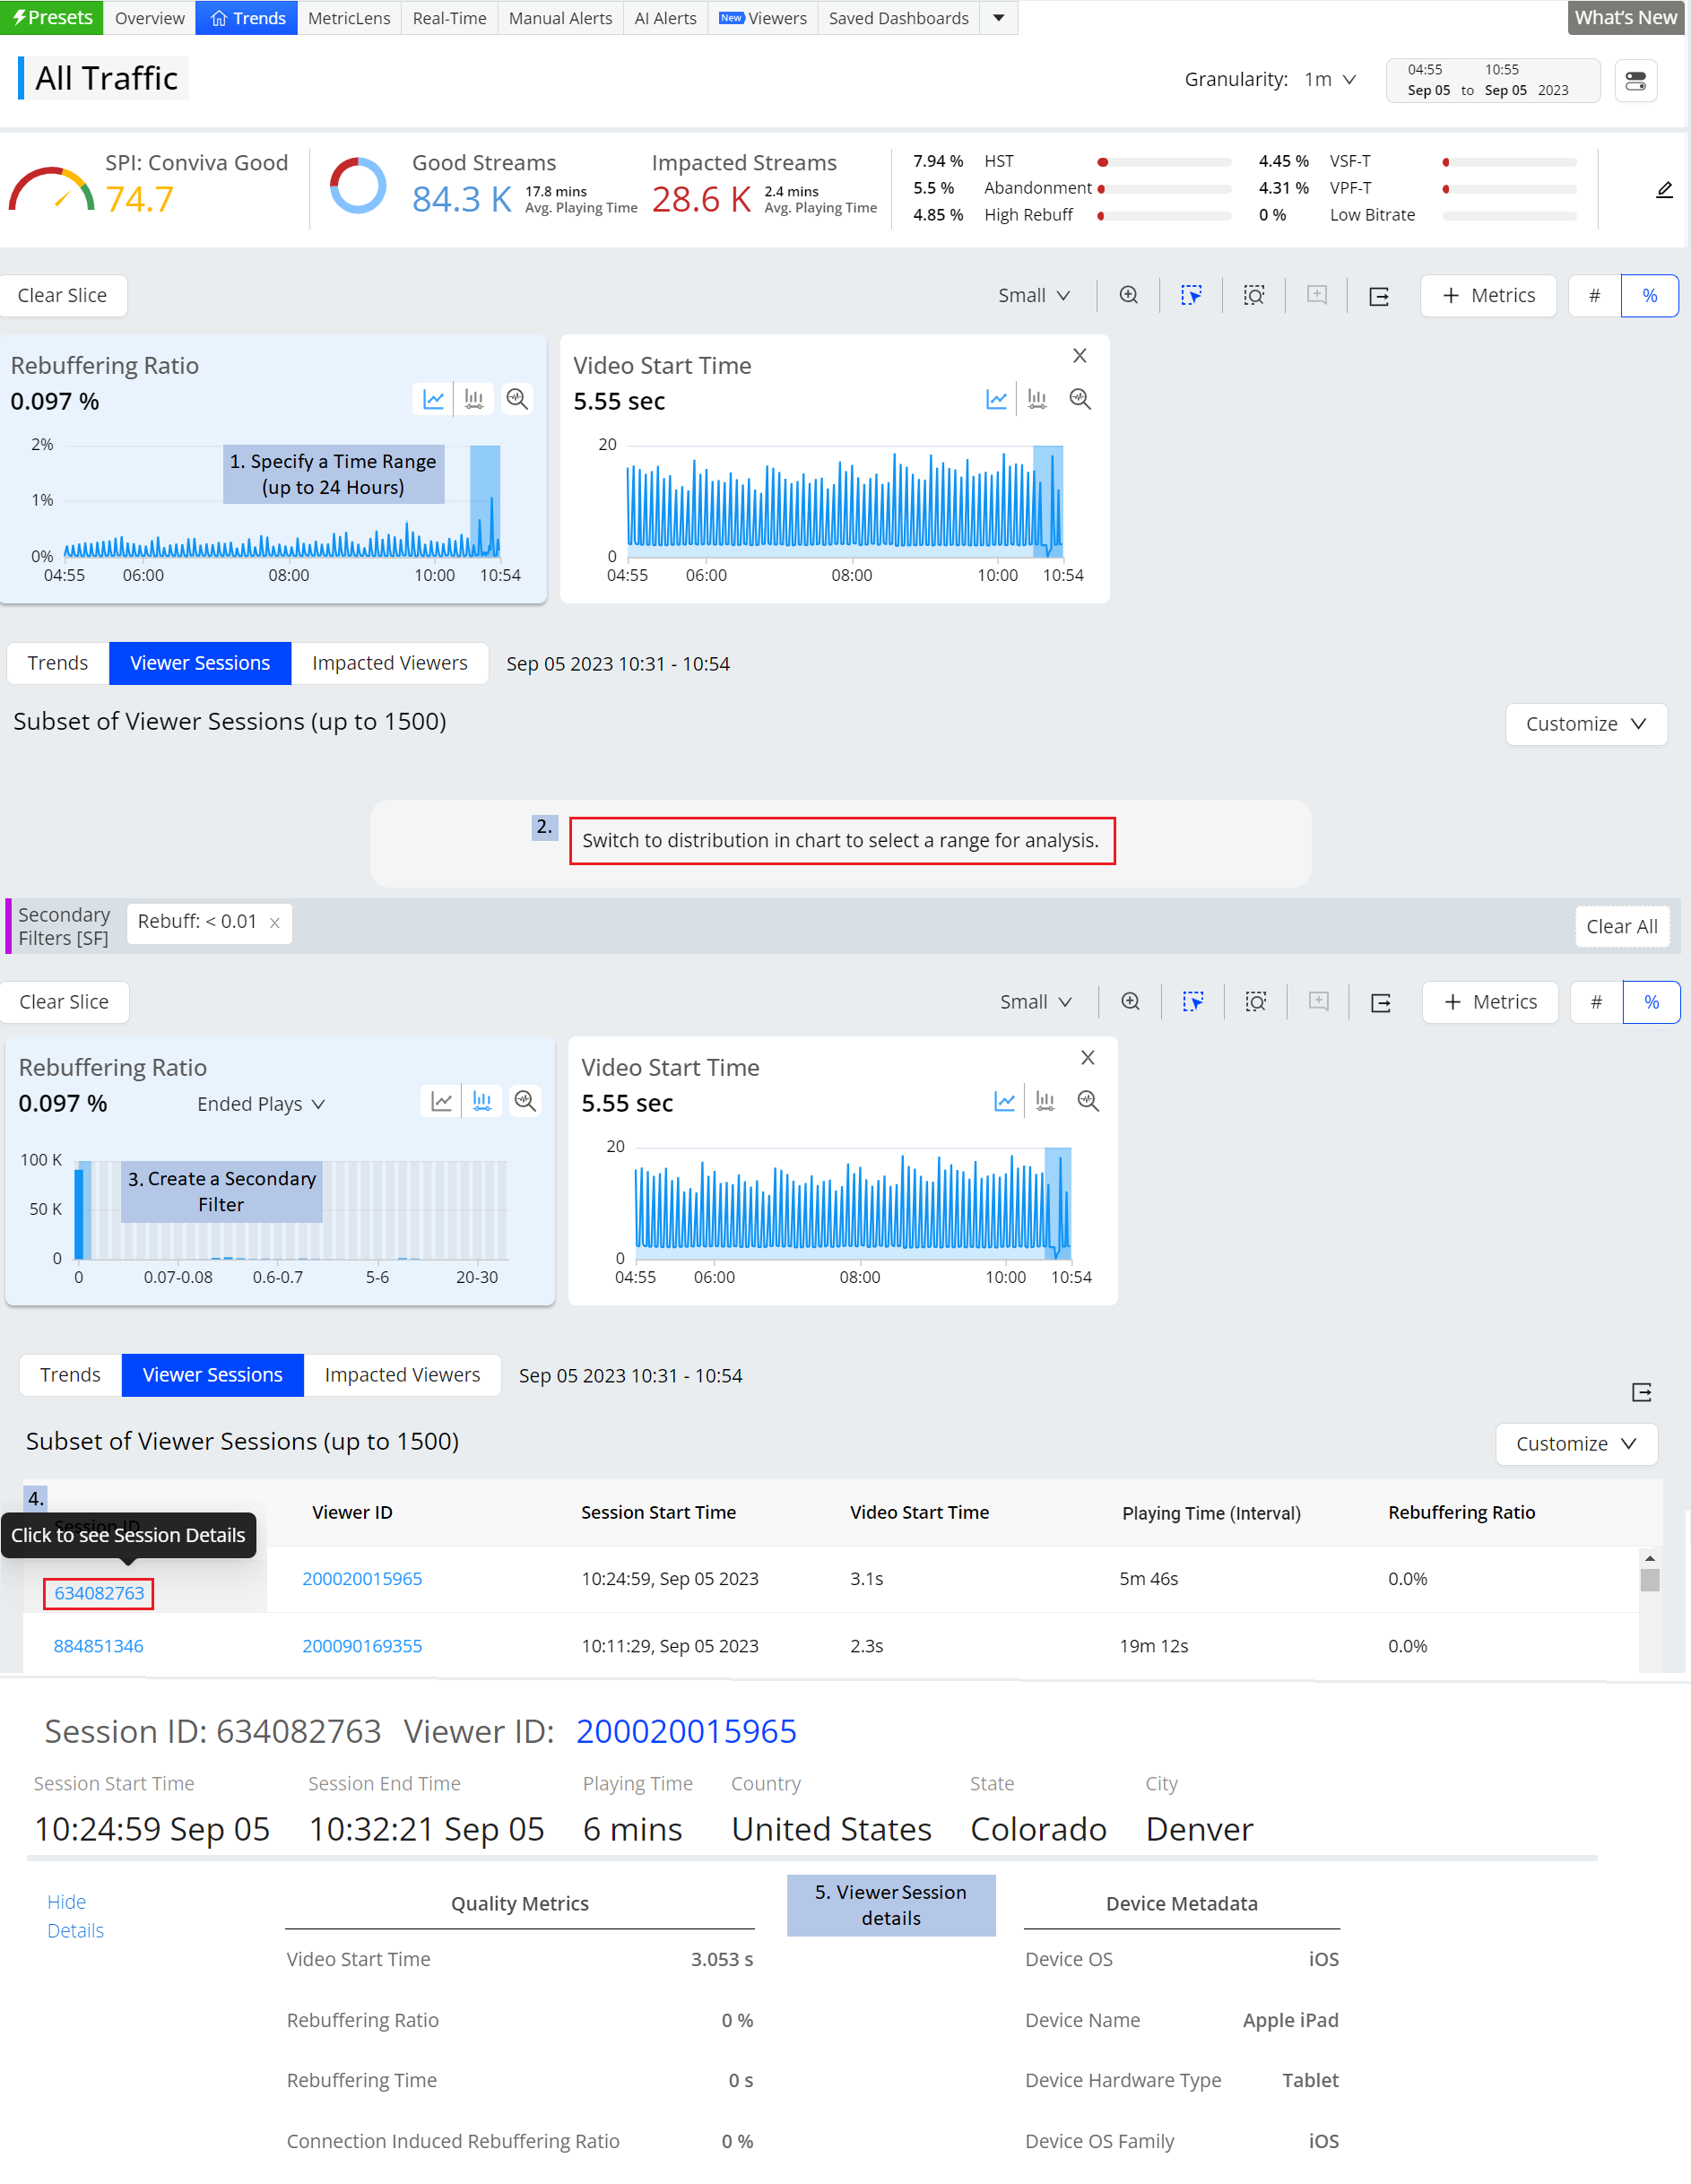
Viewer Sessions Example
Within Trends, slice an anomaly and quickly access data for the impacted sessions. Click the session link to drill into second-level session events and status to diagnosis the stream performance details.
For more details about viewer and session diagnosistics, see the Trends Diagnostics. For session timeline details, see the Session Timelines.
 Overview and Streaming Performance Index (SPI)
The Overview dashboard provides a highlight of your streaming activity and performance so you can quickly view your level of streaming activity, compare your streaming performance with the Conviva Streaming Performance Index, and analyze opportunities for improvement with dimensional analysis across key performance areas. This comparative analysis includes analyzing performance across sessions with and without ads, and your performance versus benchmarks of Conviva cohorts.
In addition, you can set custom values for the KPIs used to determine the thresholds for improvement opportunities and performance analysis, such as zero CIRR, low rebuffering, and high average bitrate levels, for customized streaming activity and performance analysis.
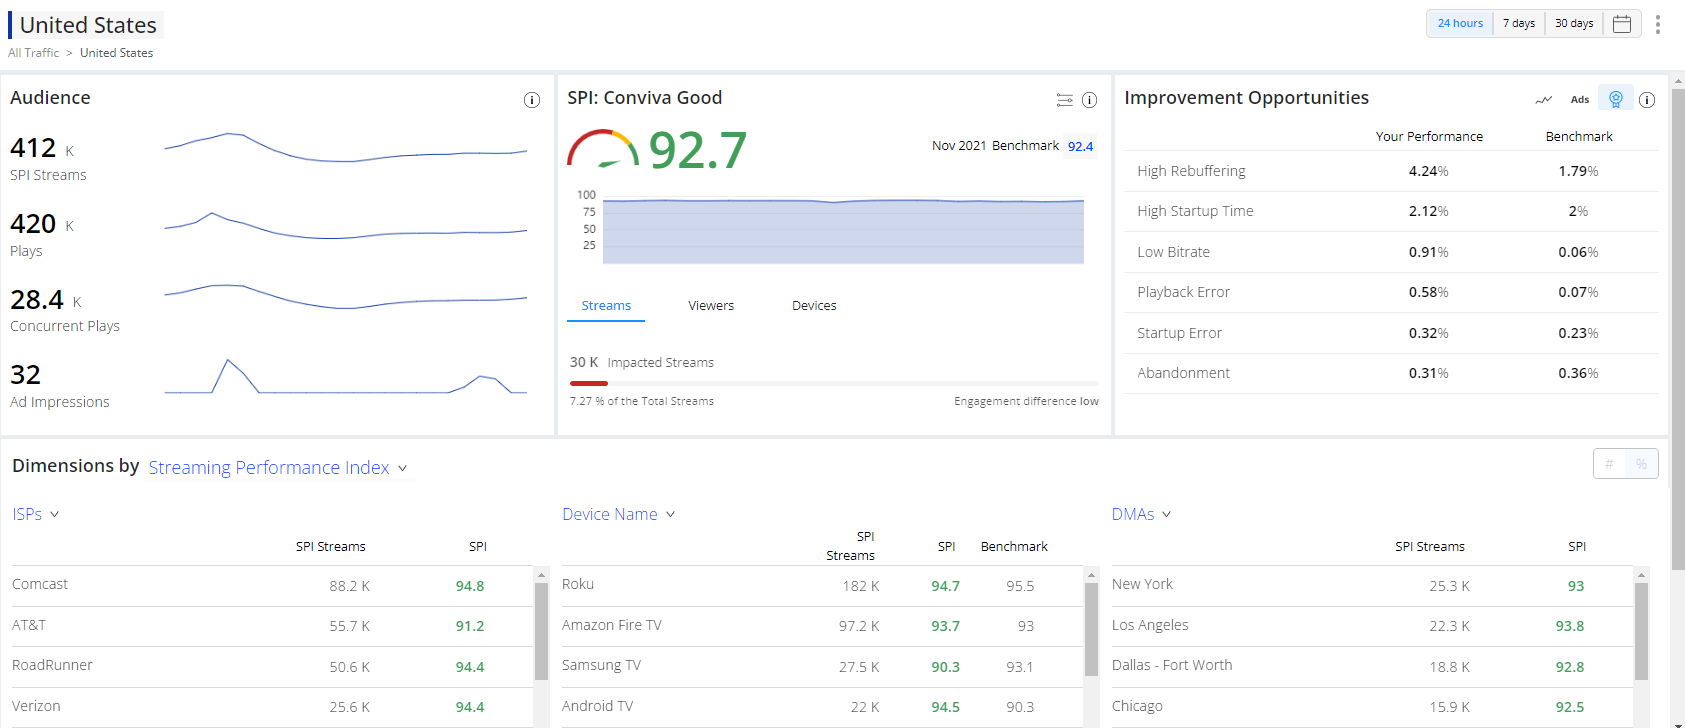
SPI Thresholds Example
For more details, see Overview dashboard.
 Viewer Sessions and Timelines
When viewing diagnostics for supported metrics, VSI enables you to discover the most critical causes of viewer impacts and failure patterns across the impacted sessions. Conviva VSIprovides the ability to quickly access an analysis of the impacted viewer sessions.

Viewer Sessions Example
For more details, see Viewer Sessions.
You can also view second-level sessions timelines showing the session events and state changes to discover session details, such as bitrate changes and patterns of rebuffering.

Session Timeline Example
For more details, see Viewer Session Timelines.
Next Step: Explore More Conviva Video Features