Build Experience Metrics
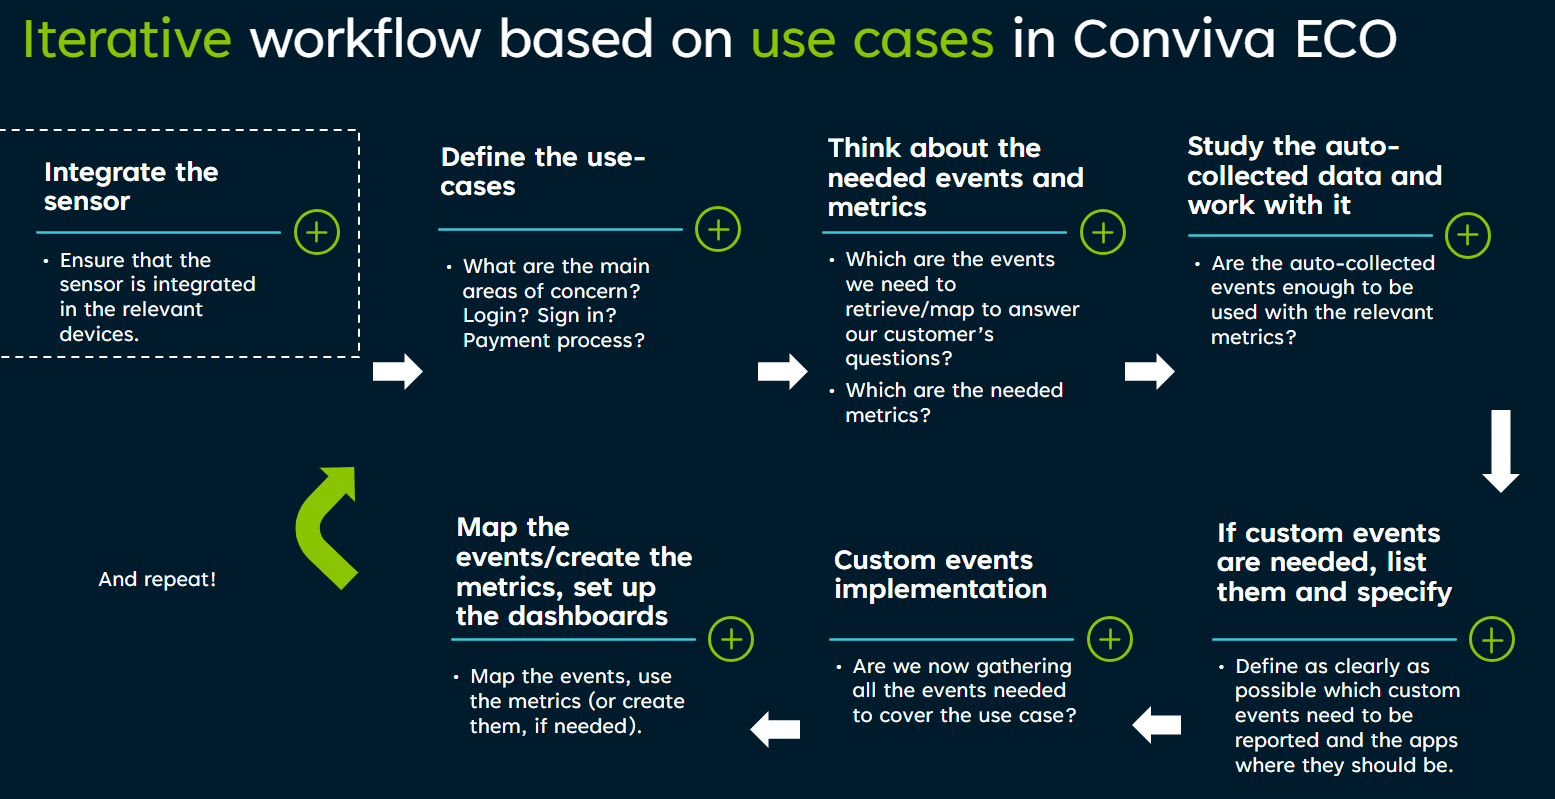
Conviva provides a robust set of options for mapping events and transforming the events and event combinations into application and video experience metrics. Custom experience metrics are commonly used for analyzing the application performance and user experience. Typical workflow to create an experience metric:
-
Semantic Mapper: Confirm that mapped event(s) are available. If they are not, map event(s).
-
Metric Builder: Assign event(s) to the experience metric, using the metric templates when applicable.
-
Semantic Mapper: Deploy new metric to Trends and other pages.
-
DPI: Display the new metric for advanced experience analysis.
DPI Workflow Diagram

Build Your Own Metrics
With Conviva DPI, you can easily leverage all your captured events to enable your own experience metrics, based on event combinations and user behaviors. Create your own experience metrics, using the metric templates with the assistance of pre-filled fields and commonly used event associations or with the Semantic Mapper and Metric Builder options.
Experience Metric Templates
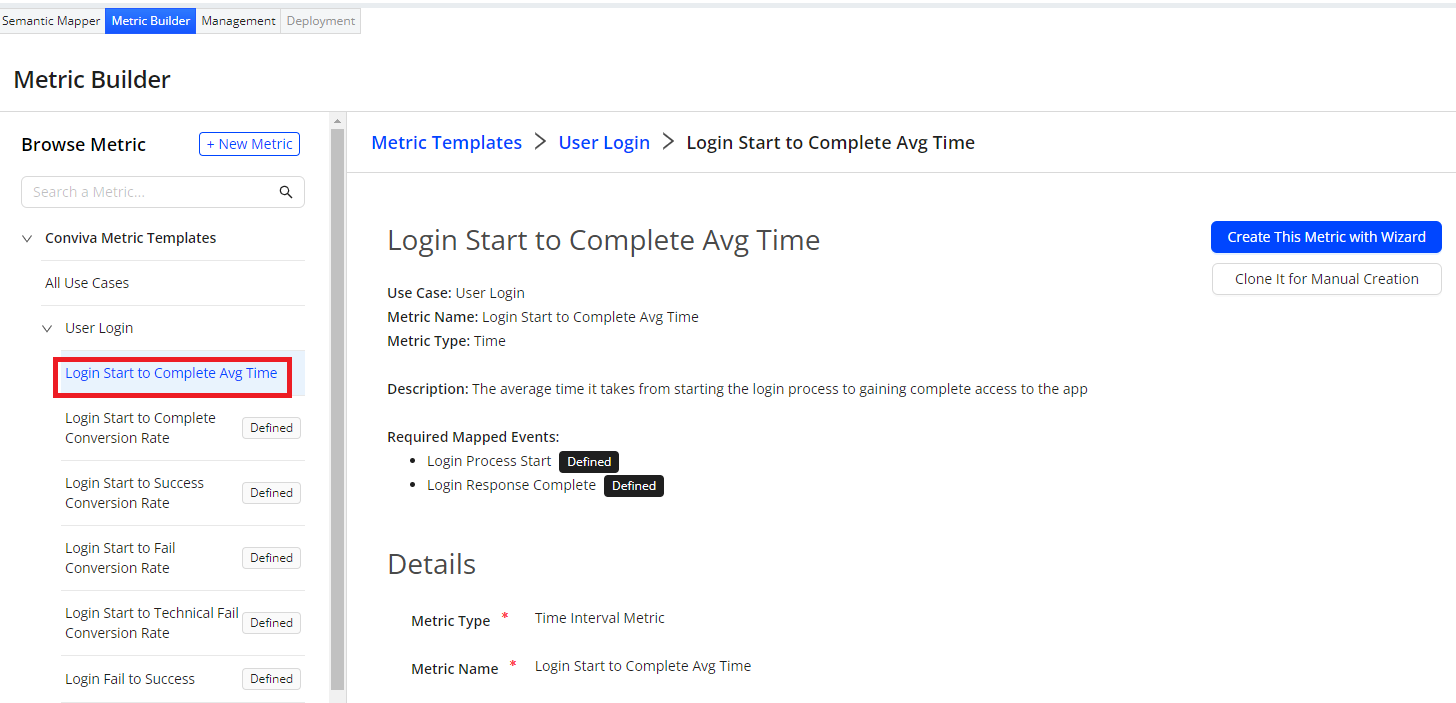
With pre-filled fields and common event associations, metric templates help you quickly build experience metrics, in this example using the login temple to create an Login Start to Complete Avg Time metric.

Metric Template Example
For more details, see metric templates.
Semantic Mapper and Metric Builder
With Semantic Mapper, map events into logic event groups for unified event processing. The Semantic Mapper provides convenient methods for setting raw events as mapped events, commonly with the Map New Event and Quick Map options.

Semantic Mapper Example
Use Metric Builder to complete and deploy the custom metrics including using metric templates or custom event selection for quick metric compilation.

Metric Builder Example
After deploying the mapped events, the mapped events appear as dimension data to enable deeper analysis using dimensional drill-down.
App and Video Experience Metric Use Cases
Typical custom experience metric use cases for application and video experience analysis include:
-
Full Login Time: measuring the duration between login button click and Home page loading
-
Full Registration Time: measuring the duration between registration click and registration success.
-
Time to First Play: measuring duration between Home page load and play start event.
-
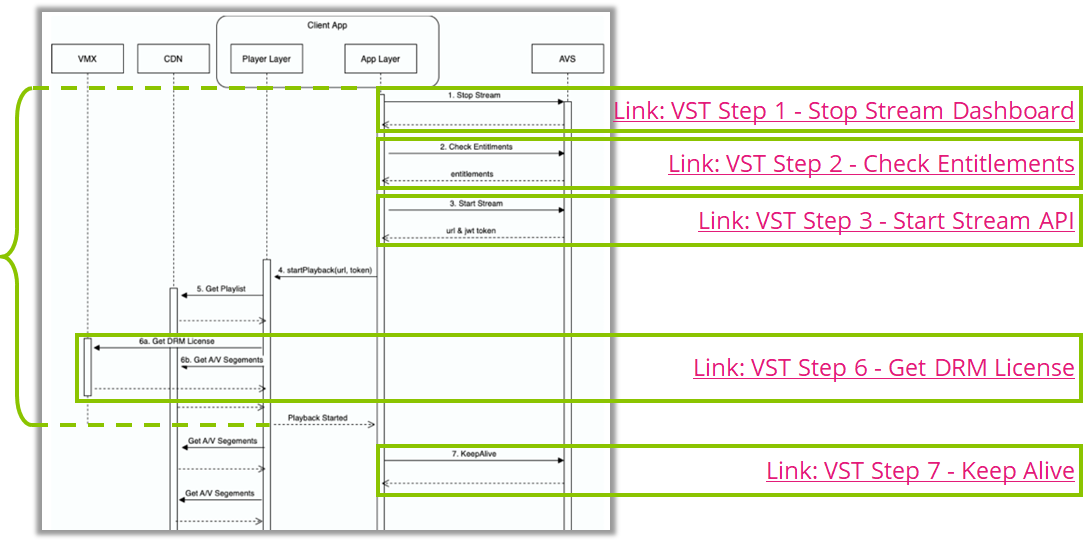
Video Startup Time: measuring full VST and incremental video startup stages, such as entitlements check and DRM requests.
For example, a typical VST process consists of seven stages with events that can be mapped as custom experience metrics across the player and application layers to monitor the complete VST process along with specific stages, such as the duration of the Get DRM License request.

VST Events Example
For more details, see DPI Experience Metric Use Cases.
Next Step: Monitor Out-of-Box Metrics