What's New in Video 2023
2023 Releases
 2023 Releases: AI-Driven Automation - Actionability, Enhanced Analysis, and Improved User Experience
|
Automatic Insights |
Metrics and Metadata
|
Custom Dashboards |
Trends Enhancements |
Trends Enhancements |
December 14,2023
Enhanced Dimensions in AI Alerts Diagnostics
Enhanced Dimensions in AI Alerts Diagnostics
|
|
Feature Update:
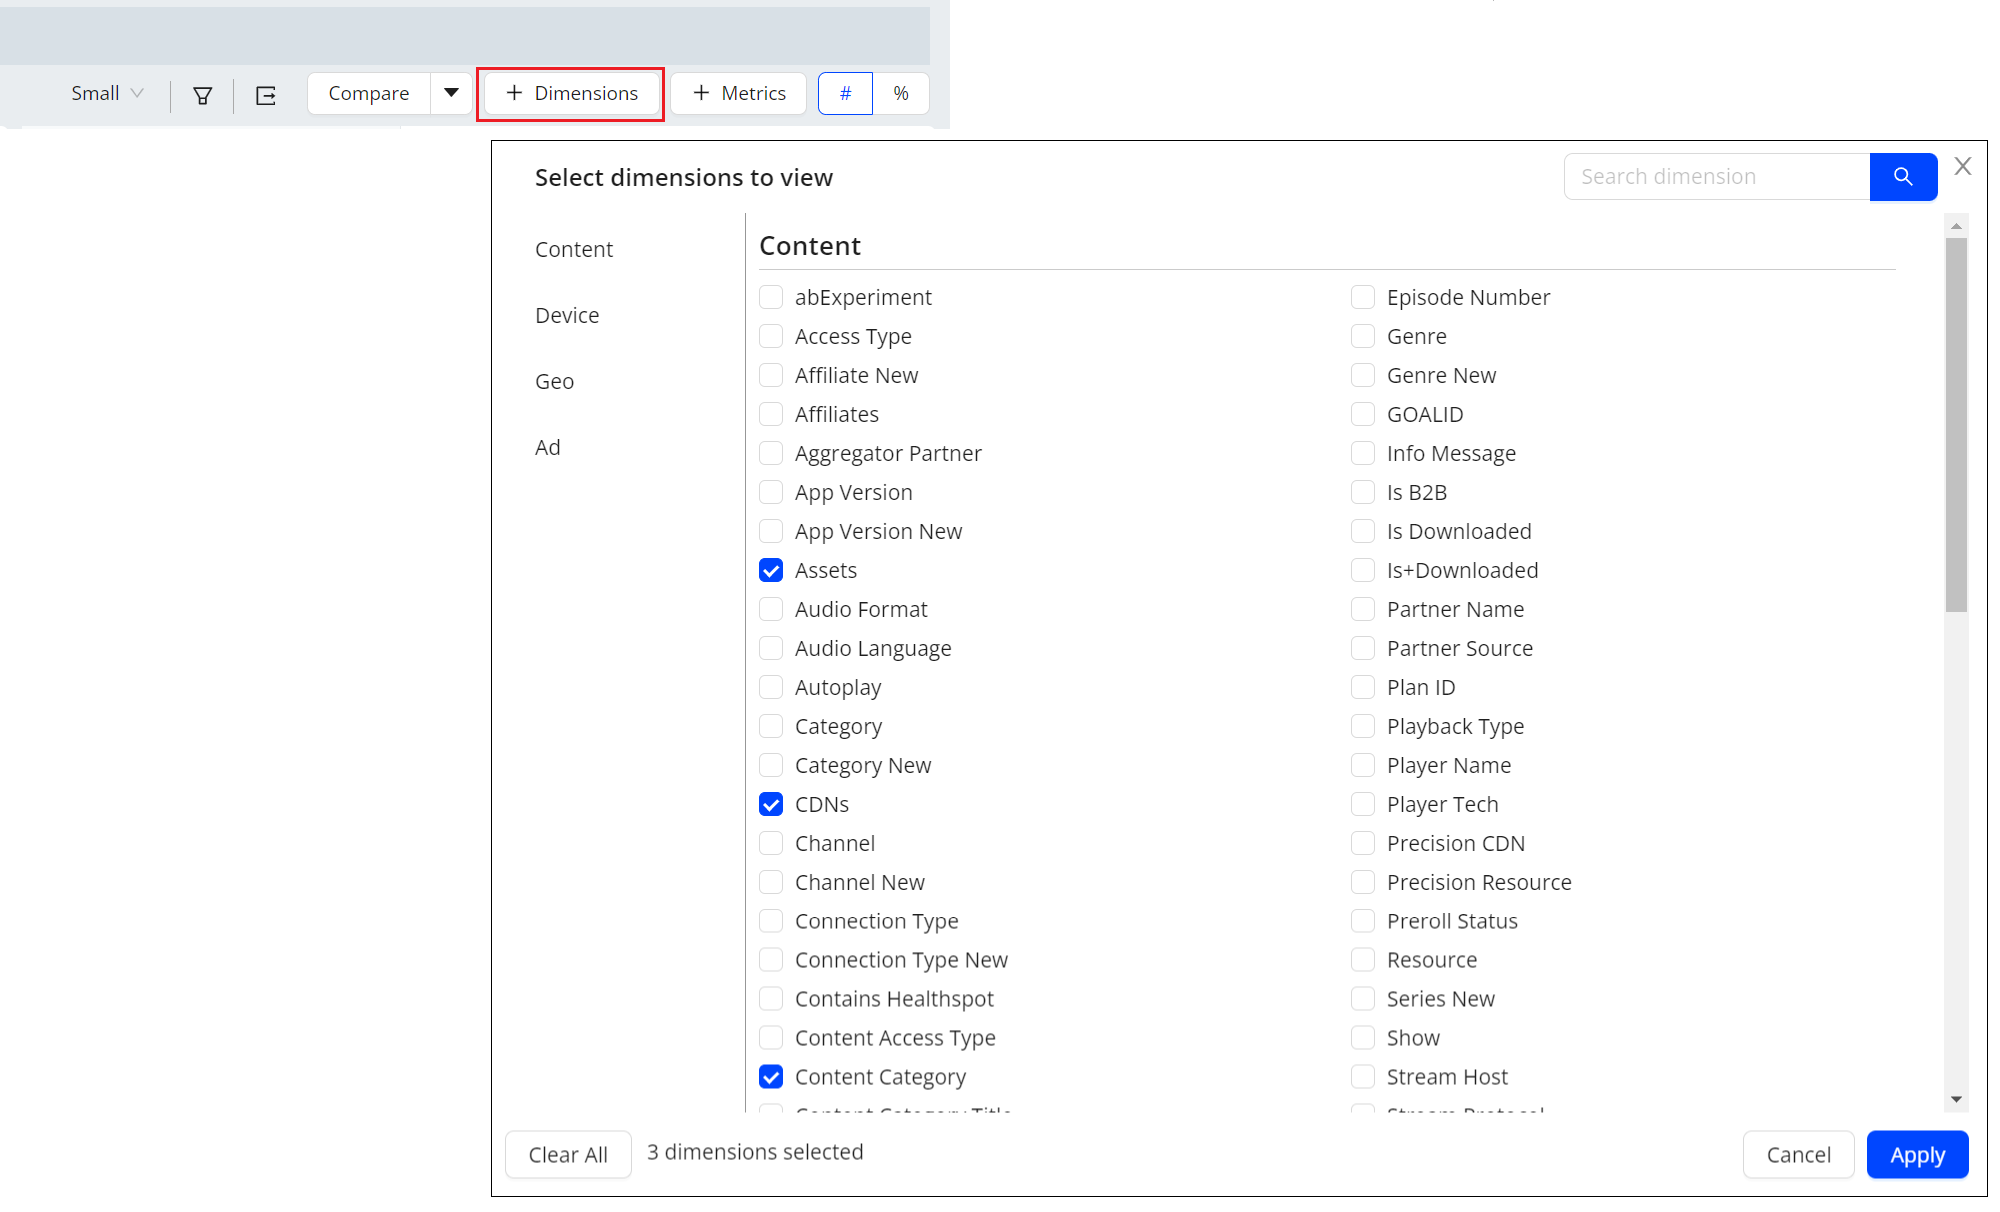
Enhances the AI Alert Diagnostics with a Dimensions button for custom dimension selection and drill down. The dimension associated with the root cause group is automatically displayed as the first dimension.
Feature Impact:
Adds a new Dimension button in the drill down toolbar of the AI Alert Diagnostics page. For easy drill down in the root cause diagnostics, the dimension associated with the AI alert root cause displays as the first dimension.
Use Case:
Quickly discover dimension entities related to the root cause of an AI alert, such as AKAMAI (CDNs), Vod (Content Category), and Brightcove Web Player (Player Name), with an automatic display of these dimensions.
More Details: AI Alert Diagnostics.
November 2,2023
Compare in Trends
|
|
Feature Update:
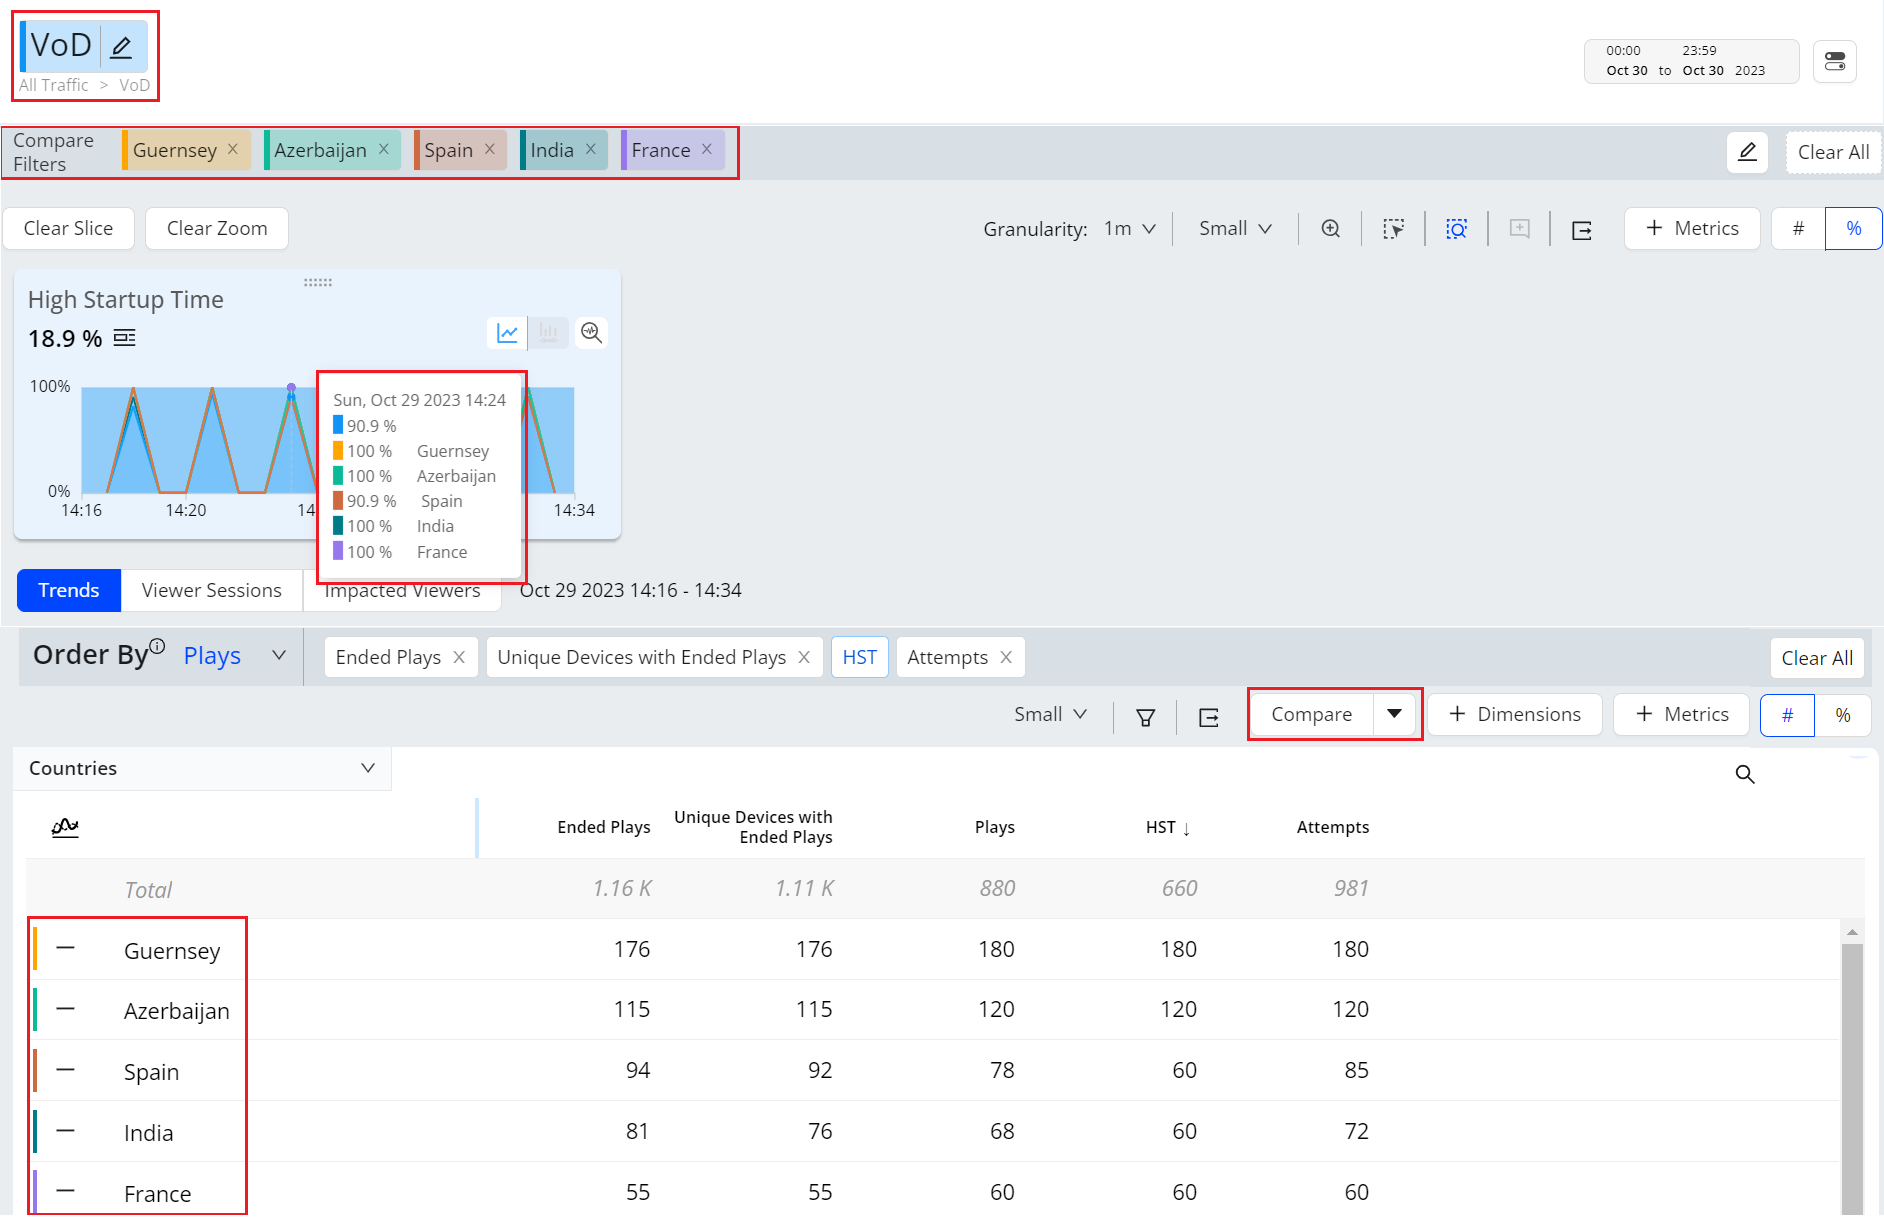
Provides instant compare in Trends with a new compare workflow so you can quickly compare filters for the top five dimension entities or you can compare across the custom list of dimensions filters.
Feature Impact:
Adds a Compare Top Filters icon in the dimension tables to quickly create instant comparisons of top dimension entities in metric widgets.
Adds a Compare button in action bar for custom comparisons based on logical AND/OR dimension combinations and custom entity selection.
Use Case:
You can easily compare the multiple dimension values in metric widgets for analysis in Trends, such as High Startup Time across countries.
More Details: Compare and Trends.
October 19,2023
Custom Dashboards Updates:
Pulse 4 Update:
Custom Dashboards: Support Multiple Data Sources
|
|
Feature Update:
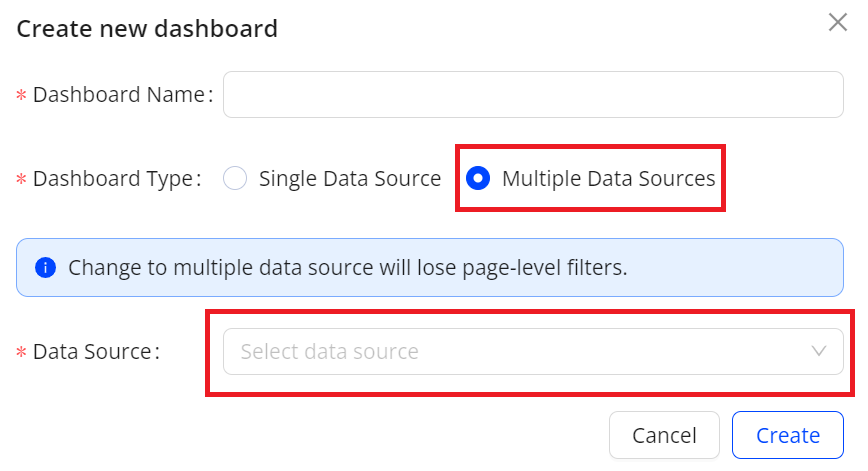
Adds support for multiple data sources in Custom dashboards to enhance analysis across your video streams, ads, and application performance.
Note: Page-level filters are not available when using multiple data sources.
Feature Impact:
-
Adds a new pop-up window for creating a new Custom dashboard. The new window includes:
-
Dashboard Name field to enter a dashboard name.
-
Dashboard Type check box to enable the selection of a single data source or multiple data sources.
-
Data Source drop-down list to select a data source type or multiple data sources.
-
-
Adds a Data Source drop-down list to select a data source type on both the Add New Widget page and the Edit Widget page in the edit mode.
Use Case:
To provide an executive overview of streaming and app performance in a single dashboard, select VIDEO and APP as data sources when creating the Custom dashboard, and add widgets for streaming SPI and app crashes metrics.
More Details: Custom Dashboards
Custom Dashboards: Enhanced Filter Comparison
|
|
Feature Update:
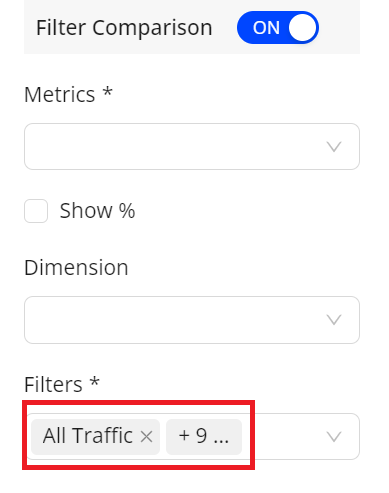
Enhances the filter comparison feature by increasing the number of filters from 5 to 10.
Feature Impact:
Increases the number of filters from 5 to 10 when using the filter comparison feature.
Use Case:
To compare data in a widget from different filters, click Edit in the edit mode, enable Filter Comparison, select desired filters, and click OK.
More Details: Custom Dashboards
Custom Dashboards: Enhanced Bar and Map Filter Functions
|
|
Feature Update:
Enhances the bar and map filters by providing these functions:
-
Set the number of values that can be displayed in the bar or map.
-
Select static values as advanced filters in the bar or map.
-
Toggle between the visual view and the table view.
Feature Impact:
Adds these new field and icons to support the new feature:
-
Row limits field to set the number of values that can be displayed.
-
Advanced Filter icon to select static values as advanced filters in the bar or map.
-
View Table and View Chart icons to toggle between the visual view and the table view.
Use Case:
To compare attempts from specific countries in a created bar chart, click the Advanced Filter icon at the top right corner of the bar in the Edit mode, select the specific countries, and click OK. The bar chart data updates to reflect your selection.
More Details: Custom Dashboards
Deprecate the Email 1.0, Quality, Audience, Engagement, Real-Time Dashboards from Pulse 4 OR Deprecate Pulse 4
|
|
Feature Update:
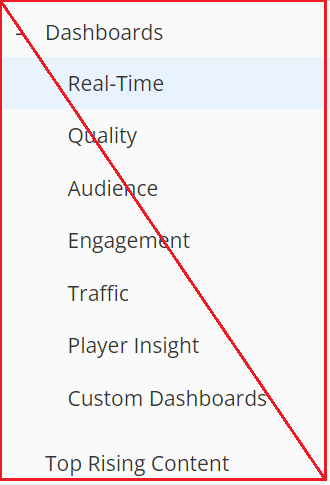
All the Pulse 4 dashboards expect for device validation and Top Rising Content are no longer available in the Navigation menu.
Feature Impact:
The Pulse 4 Real-Time, Quality, Audience, Engagement, Traffic, Player Insights, Custom Dashboards and Top Rising Content is no longer available.
In new Pulse,
-
Trends dashboard introduces a range of new capabilities designed to enhance streaming performance and metric analysis.
-
Experience Overview highlights your streaming activity and performance. It enables you to assess your streaming level swiftly, compare performance against the Conviva Streaming Performance Index, and analyze improvement opportunities across key performance areas.
-
Real-Time dashboard provides a visual presentation of QoE metrics for actionable streaming intelligence in real time.
-
The MetricLens dashboard is enhanced to enable dimensional analysis of quality and audience metrics in a unified visual presentation of metric comparison bars and time series with 1-hour granularity.
Use Case:
Instead of Legacy Pulse, customer should use the new Pulse with improved and more powerful Pulse Dashboards which provides advanced analytics, performance optimization and enhanced user experience.
More Details: Trends, Experience Overview, and MetricLens
October 5,2023
Remove the Legacy Pulse link from Pulse Navigation Menu
|
|
Feature Update:
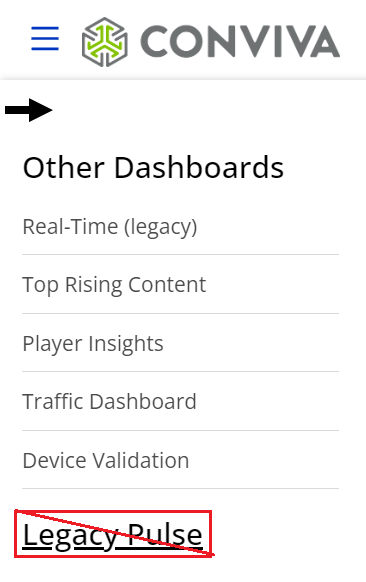
The Legacy Pulse link in the left menu is now removed.
Feature Impact:
Access to Legacy Pulse is no longer available from the left Navigation menu. Customers still migrating from Legacy Pulse can still access the app through the direct URL.
Use Case:
Instead of Legacy Pulse, customers should use the new Pulse dashboards and features for impacted viewers and session analysis, enhanced dimensional drill-downs, SPI analysis, advance metric filtering, real-time data in Trends, and other enhancements.
More Details: Trends Dashboard.
Deprecate the MetricLens and Viewers Features from Pulse 4
|
|
Feature Update:
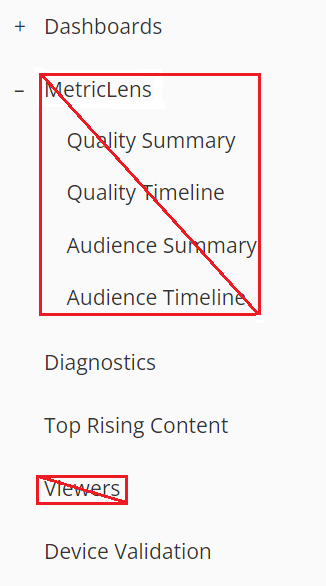
The Pulse 4 Viewers and MetricLens feature links no longer available from the left menu.
Feature Impact:
The Pulse 4 Viewers and MetricLens features are deprecated and are no longer available.
In new Pulse, Viewers is enhanced to include persistence, pagination, impacted sessions indicator, and an advanced simple mode view for custom tags. The MetricLens dashboard is enhanced to enable dimensional analysis of quality and audience metrics in a unified visual presentation of metric comparison bars and time series with 1-hour granularity.
Use Case:
Instead of Legacy Pulse, customer should use the new Pulse Viewers for enhanced viewer activity and impact analysis, and MetricLens for analyzing the quality and audience metrics.
More Details: Viewer Sessions and MetricLens
September 22,2023
Custom Dashboards: Enhanced Sharing Capability
|
|
Feature Update:
Enhances the sharing capabilities to grant edit or view permissions to individual users within the same C3 account and invite collaborators to make changes to custom dashboards.
Feature Impact:
-
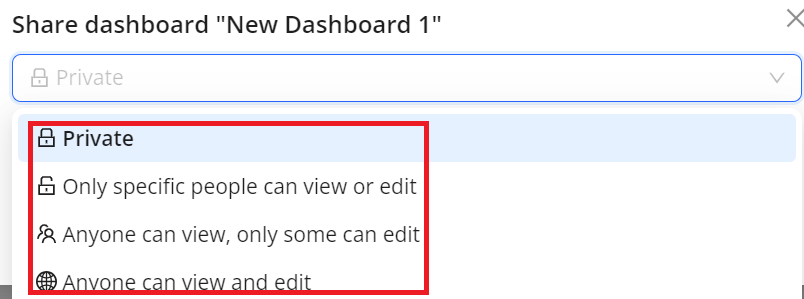
Adds a drop-down list for selecting preset options on the pop-up window after clicking Share for assigning edit or view permissions to individual users.
-
Adds the Edit Dashboard button to enter the edit mode.
-
Adds the Edit Mode switch button in the edit mode to indicate your editing status and to exit when needed.
Use Case:
To collaborate with other users on a dashboard you created, open the kebab menu, choose Only specific people can view or edit from the drop-down list of pop-up window, and do these steps:
-
To grant view permissions to some users, select the email addresses, select Can View, and click Apply.
-
To grant edit permissions to some users, select the email addresses, select Can Edit, and click Apply.
More Details: Custom Dashboards
Viewer Sessions: Max Time Range Expanded to 24 Hours

|
Feature Update:
Enhances the viewer sessions maximum time range from three hours to 24 hours.
Feature Impact:
This features displays the viewer session for a 24 hour time range during the timeline analysis.
Use Case:
You can precisely drill-down to the impacted sessions during an entire day for deeper analysis.
More Details: Viewer Sessions
Expand Error Code Character Limit to 256 Characters

|
Feature Update:
Expands the error code character limit from 128 characters to 256 characters to display more robust error codes.
Feature Impact:
This features displays the error code (up to 256 characters) in Trends.
Use Case:
You can easily see long error code text during the error code analysis.
More Details: Trends
Ad Unique Devices and Ad Minutes/Unique Device metrics added to EI Metric selector

|
Feature Update:
Adds the metrics Ad Unique Devices and Ad Minutes/Unique Device to the EI Metric selector.
Feature Impact:
This features displays the metrics Ad Unique Devices and Ad Minutes/Unique Device under the Ad Experience section of the EI Metric selector pop-up screen.
Use Case:
You can gain better insights into the ad experience by monitoring the total number of minutes and devices that had Ad Ended Plays during the selected interval.
More Details: Trends
AI Alerts Custom Dimensions (Beta)
|
Feature Update:
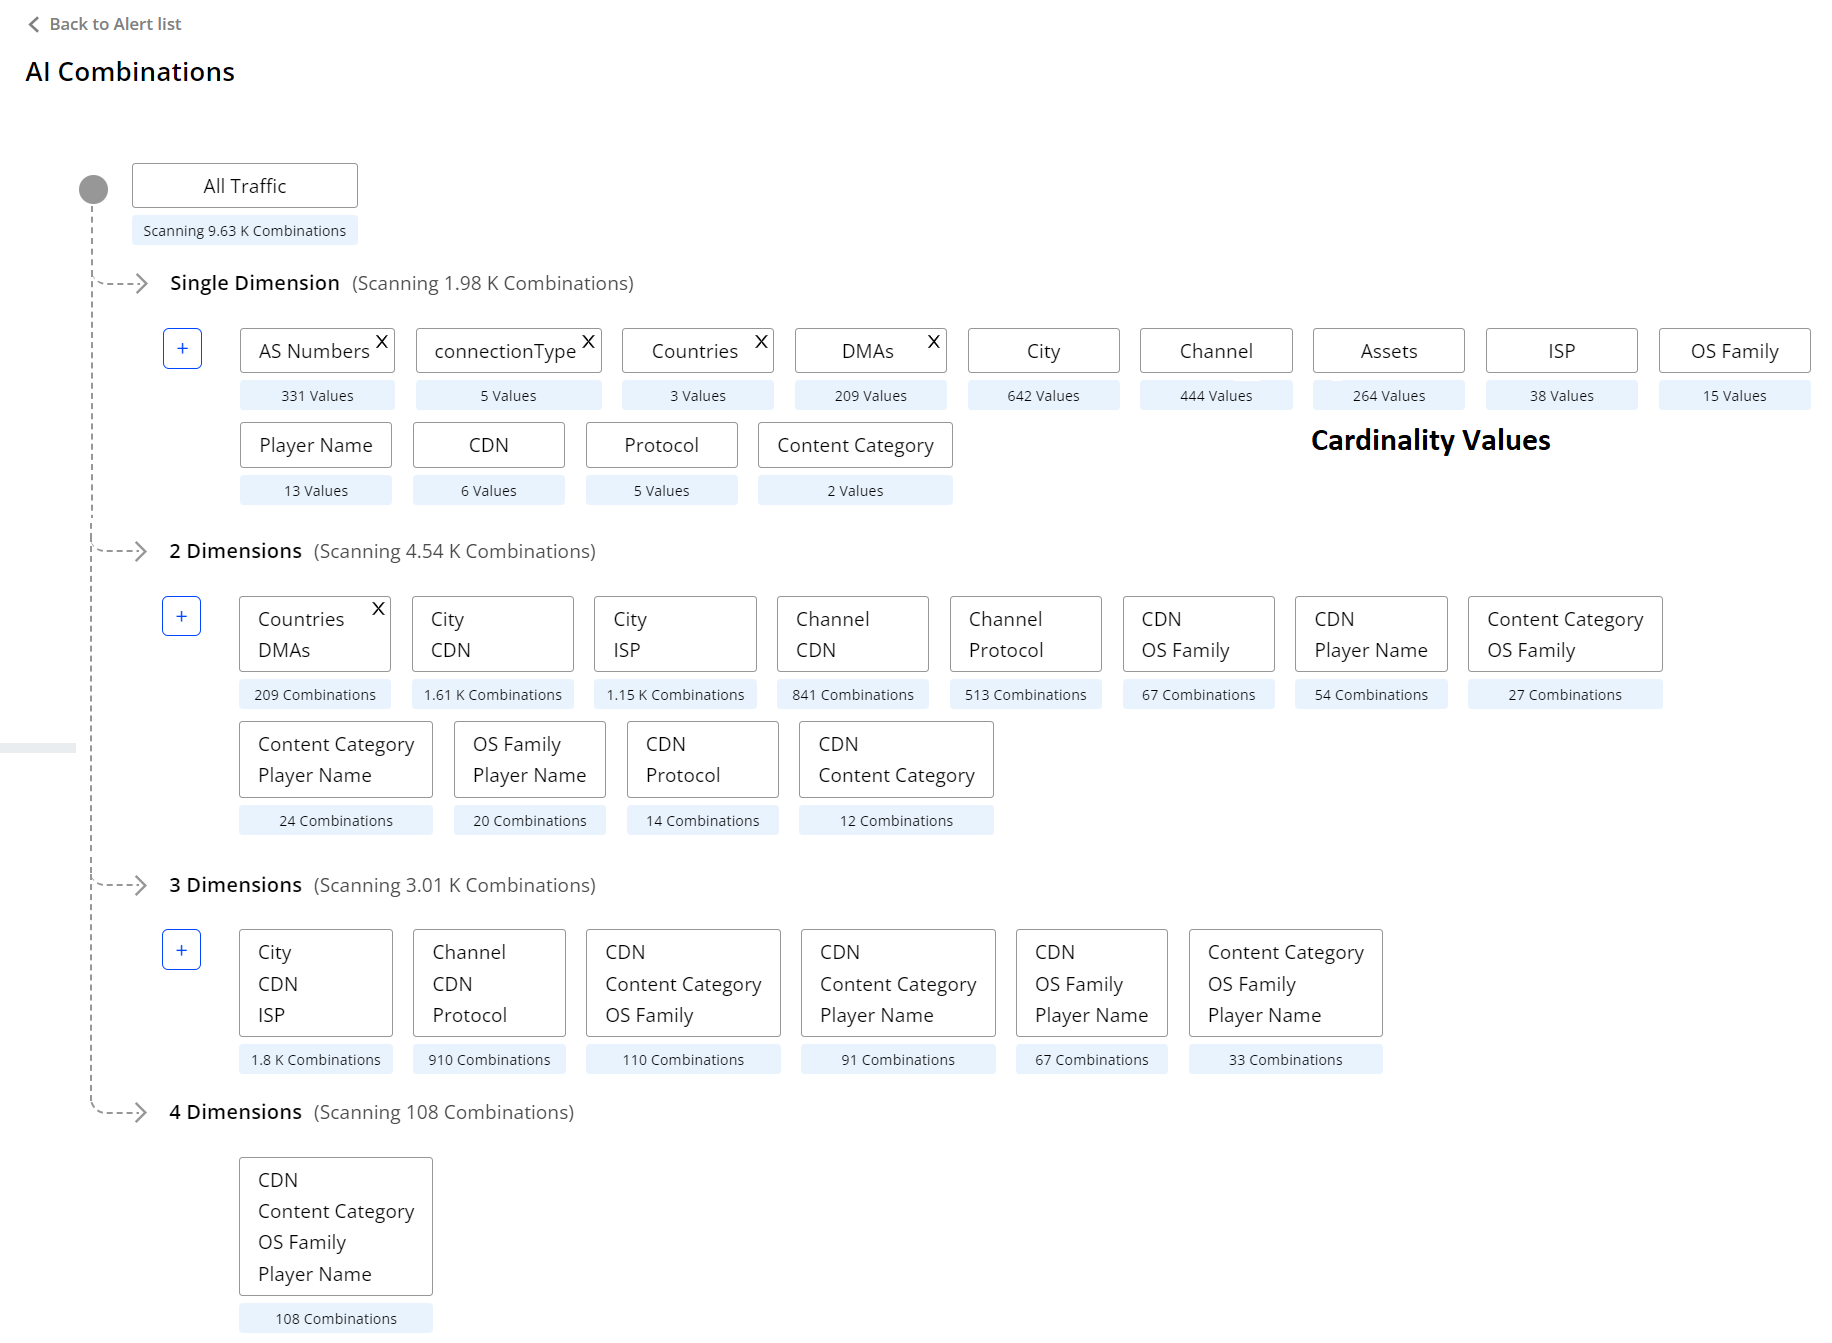
Introduces the AI Alerts Custom Dimension, allowing you to configure custom dimensions as single dimensions or group dimensions.
Feature Impact:
This features displays the AI Combinations page, navigating from the AI alerts dashboard.
Use Case:
You can easily configure custom dimensions as single dimensions or in groups of two or three dimensions to focus AI alerting on specific performance areas, such as an underperforming channel or CDN edge server / OS family combination.
More Details: AI Alert Custom Dimension
September 7,2023
Custom Dashboards: Map Visual Type
|
|
Feature Update:
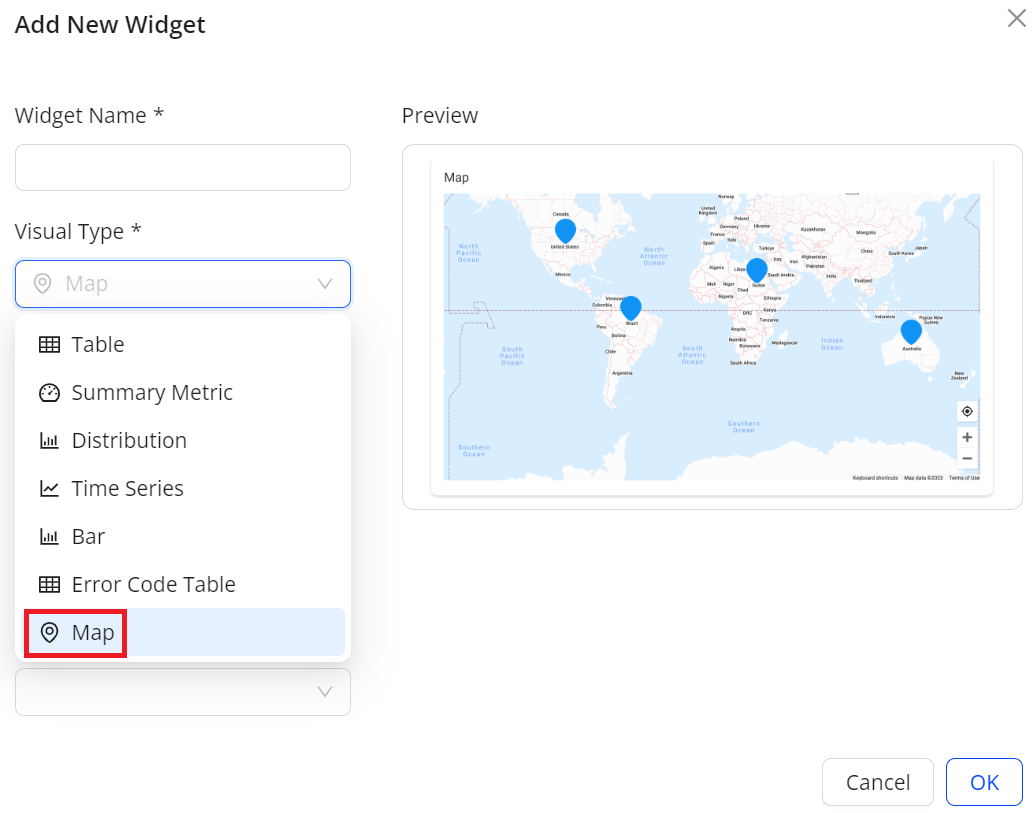
Adds support for the Map visual type when setting up a new widget. This feature enables an intuitive way to check metrics from geographical perspectives, such as country, state, and city.
Feature Impact:
Adds Map to the Visual Type drop-down list when setting up a new widget to enable an intuitive way to check metrics from geographical perspectives.
Use Case:
To monitor the Concurrent Plays metric in different countries from an intuitive way, create a dashboard using VIDEO as a data source, and then create a widget by selecting these options:
-
Visual Type: Map
-
Metric: Concurrent Plays
-
Dimension: Countries
More Details: Custom Dashboards
Secondary Filter Data for Viewer Sessions
|
Feature Update:
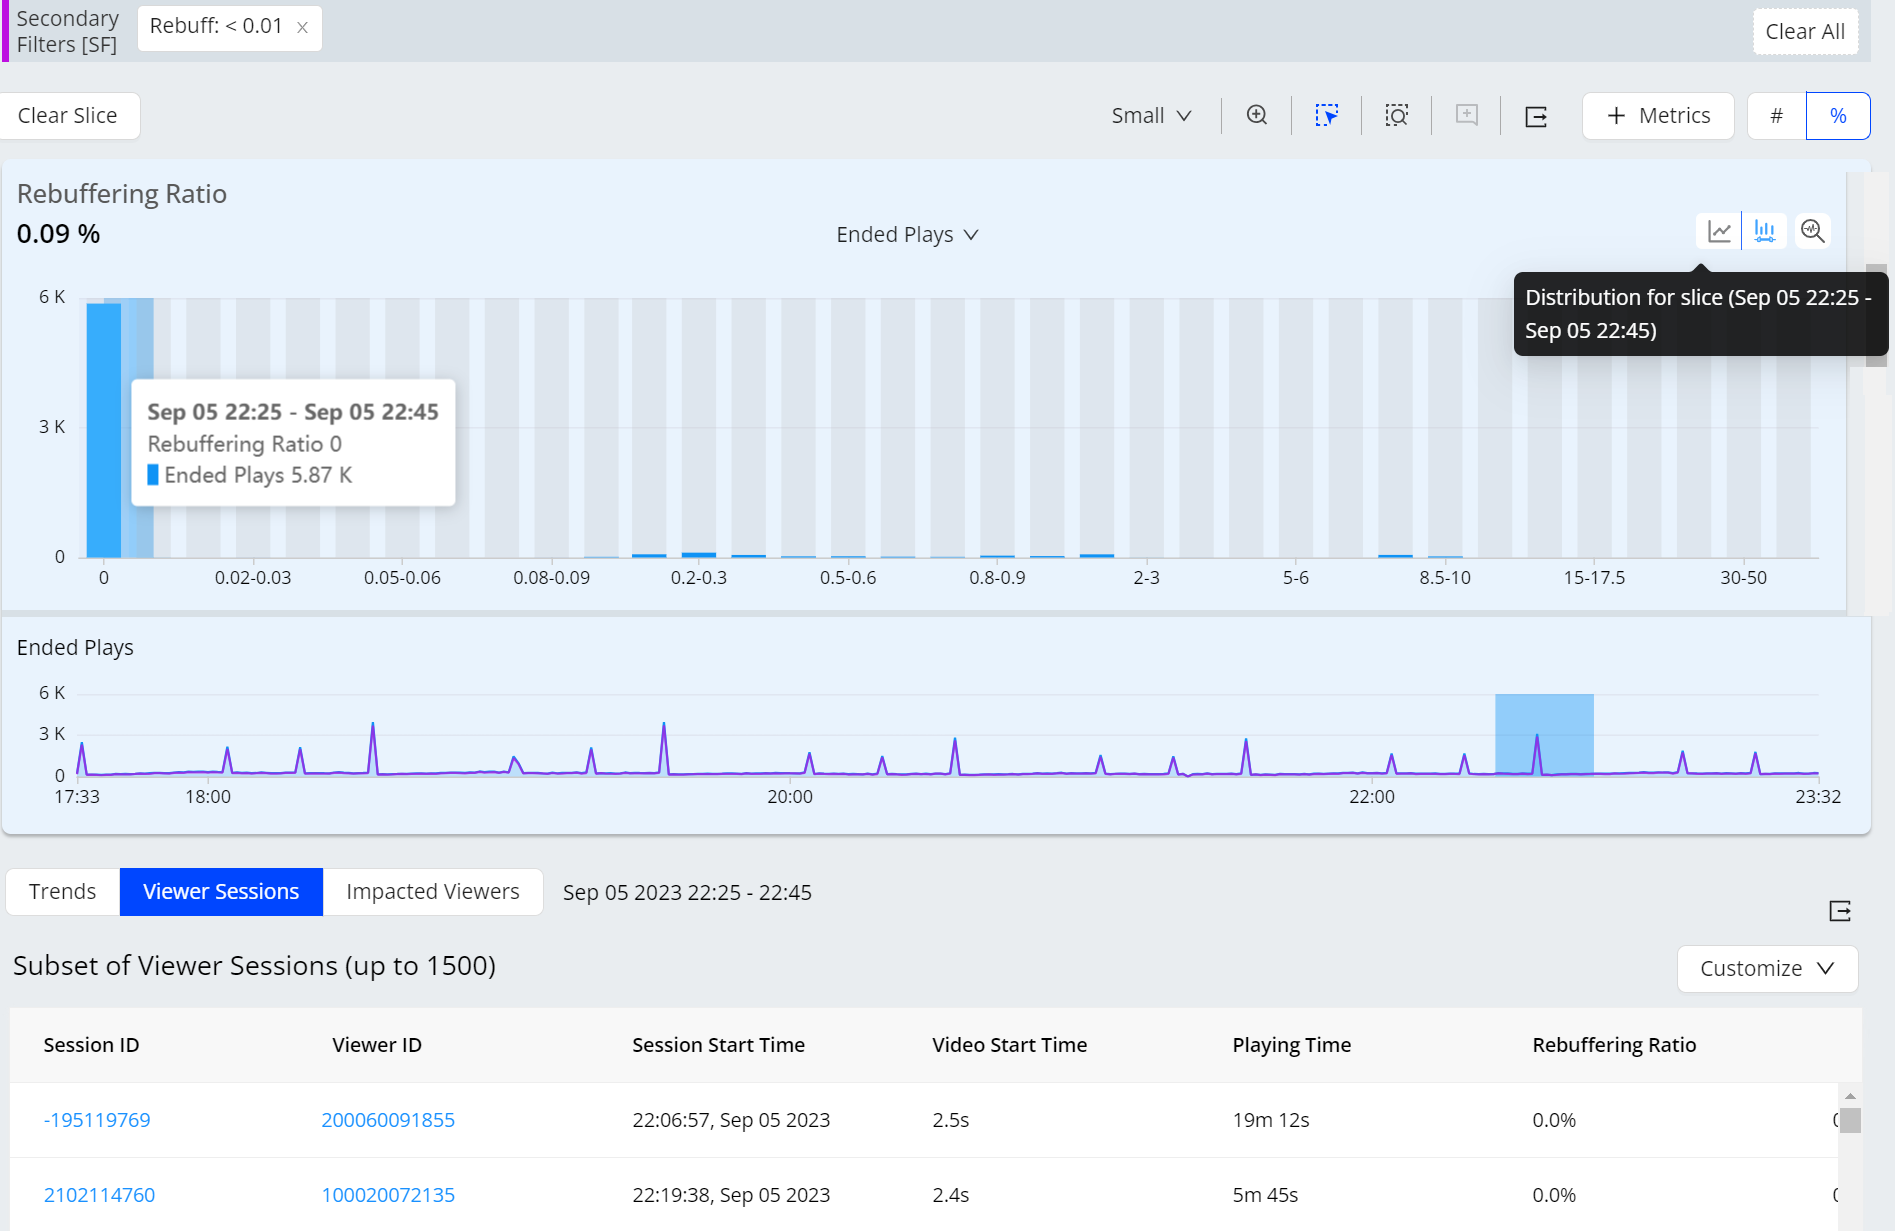
Applies the secondary filter settings to the displayed viewer sessions, enabling a deeper analysis of impacted sessions based on additional metric performance.
Feature Impact:
This features displays the viewer sessions based on the applied secondary filter.
Use Case:
You can precisely drill-down to the impacted sessions for deeper analysis.
More Details: Viewer Sessions
Presets - Alerts
|
Feature Update:
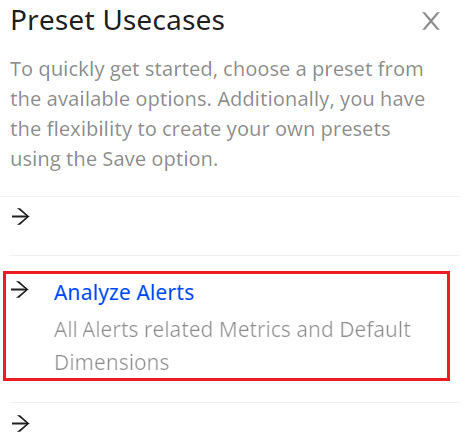
Adds (AI+Manual) Alert use case to the Presets dashboard, showing the key metric widgets with callouts for any alerts that fired during the current period.
Feature Impact:
This features provides a dashboard for the (AI+Manual) Alerts, displaying the key metric widgets and dimensions for alert analysis.
Use Case:
You can easily analyze and correlate the last seven days alert annotations (AI+Manual) with multiple diagnostic widgets during the data analysis.
More Details: Basics
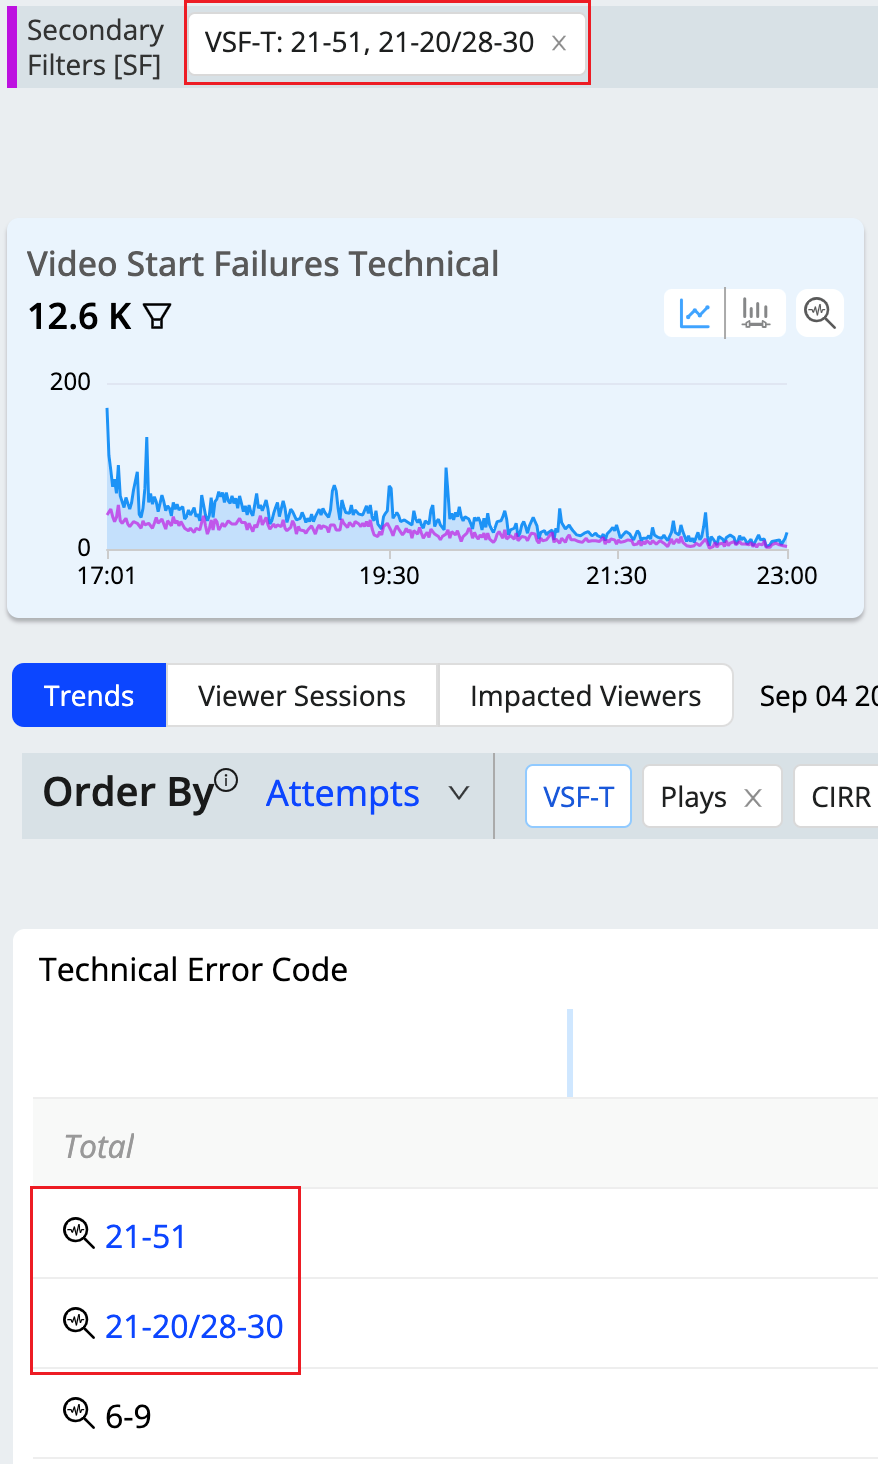
Secondary Filter on Multiple Error Codes
|
Feature Update:
Enhances the secondary filters to allow you to filter on multiple error codes at once.
Feature Impact:
This features enables you to select multiple error codes at once.
Use Case:
You can easily filter on related error codes together to see the aggregated impact.
More Details: Filtering
August 10,2023
Support APP (Beta) as a Data Source in Custom Dashboards
|
|
Feature Update:
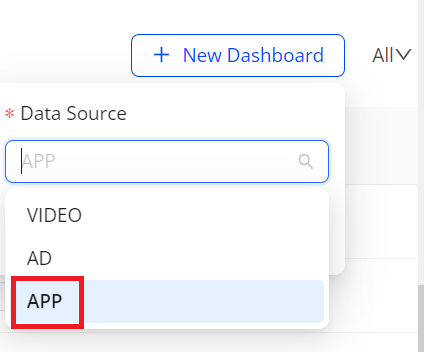
Adds support for APP as a data source when creating custom dashboards. This feature enables you to create custom dashboards for tracking app performance based on different app metrics and related dimensions, such as App Sessions.
Note: When creating a dashboard, you can only select one data source type. The available data source types depend on your account access.
Feature Impact:
-
Adds APP in the Data Source drop-down list after clicking New Dashboard on the Custom Dashboards page to enable you to create a dashboard using APP as a data source.
-
Adds APP in the drop-down list located at the right corner of the Custom Dashboards page to enable you to filter the created dashboards with the APP data source type.
Use Case:
To track app performance, create a dashboard that uses APP as a data source and then create a widget with required APP metrics and dimensions.
More Details: Custom Dashboards
Enhanced Visual Type in Custom Dashboards
|
|
Feature Update:
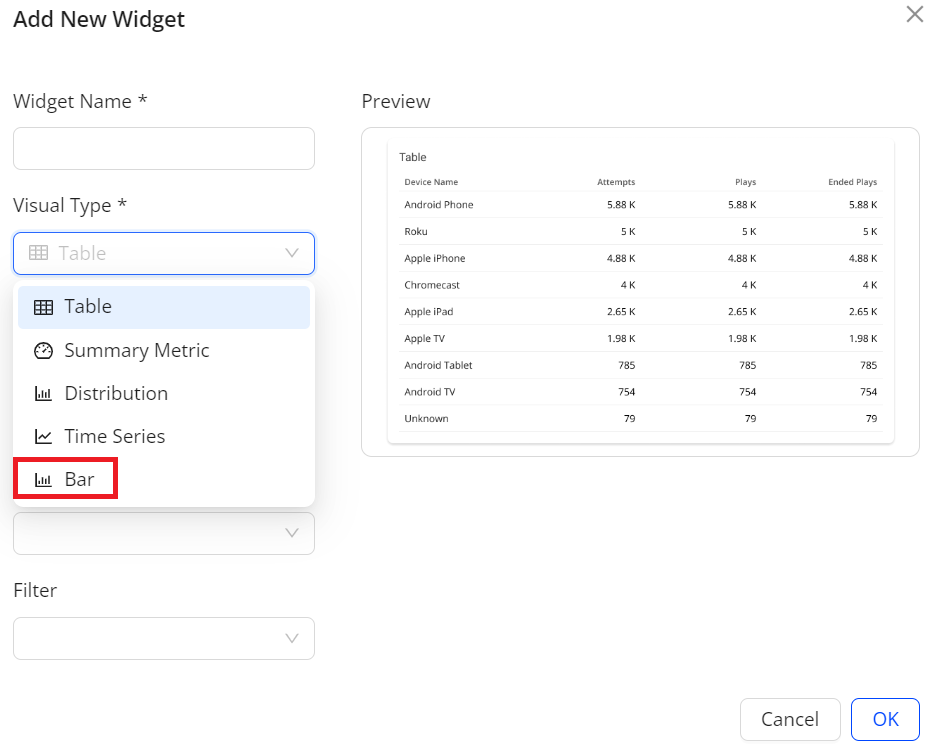
Adds support for the Bar visual type when setting up a new widget. This feature enables efficient comparison of discrete data sets.
Feature Impact:
Adds Bar in the Visual Type drop-down list when setting up a new widget to enable efficient comparison of discrete data sets.
Use Case:
To monitor a live event that airs across countries and compare attempts of selected countries against each other in a bar chart, create a dashboard using VIDEO as a data source, and then create a widget by selecting these options:
-
Visual Type: Bar
-
Metric: Attempts
-
Dimension: Country
-
Filter: Live
More Details: Custom Dashboards
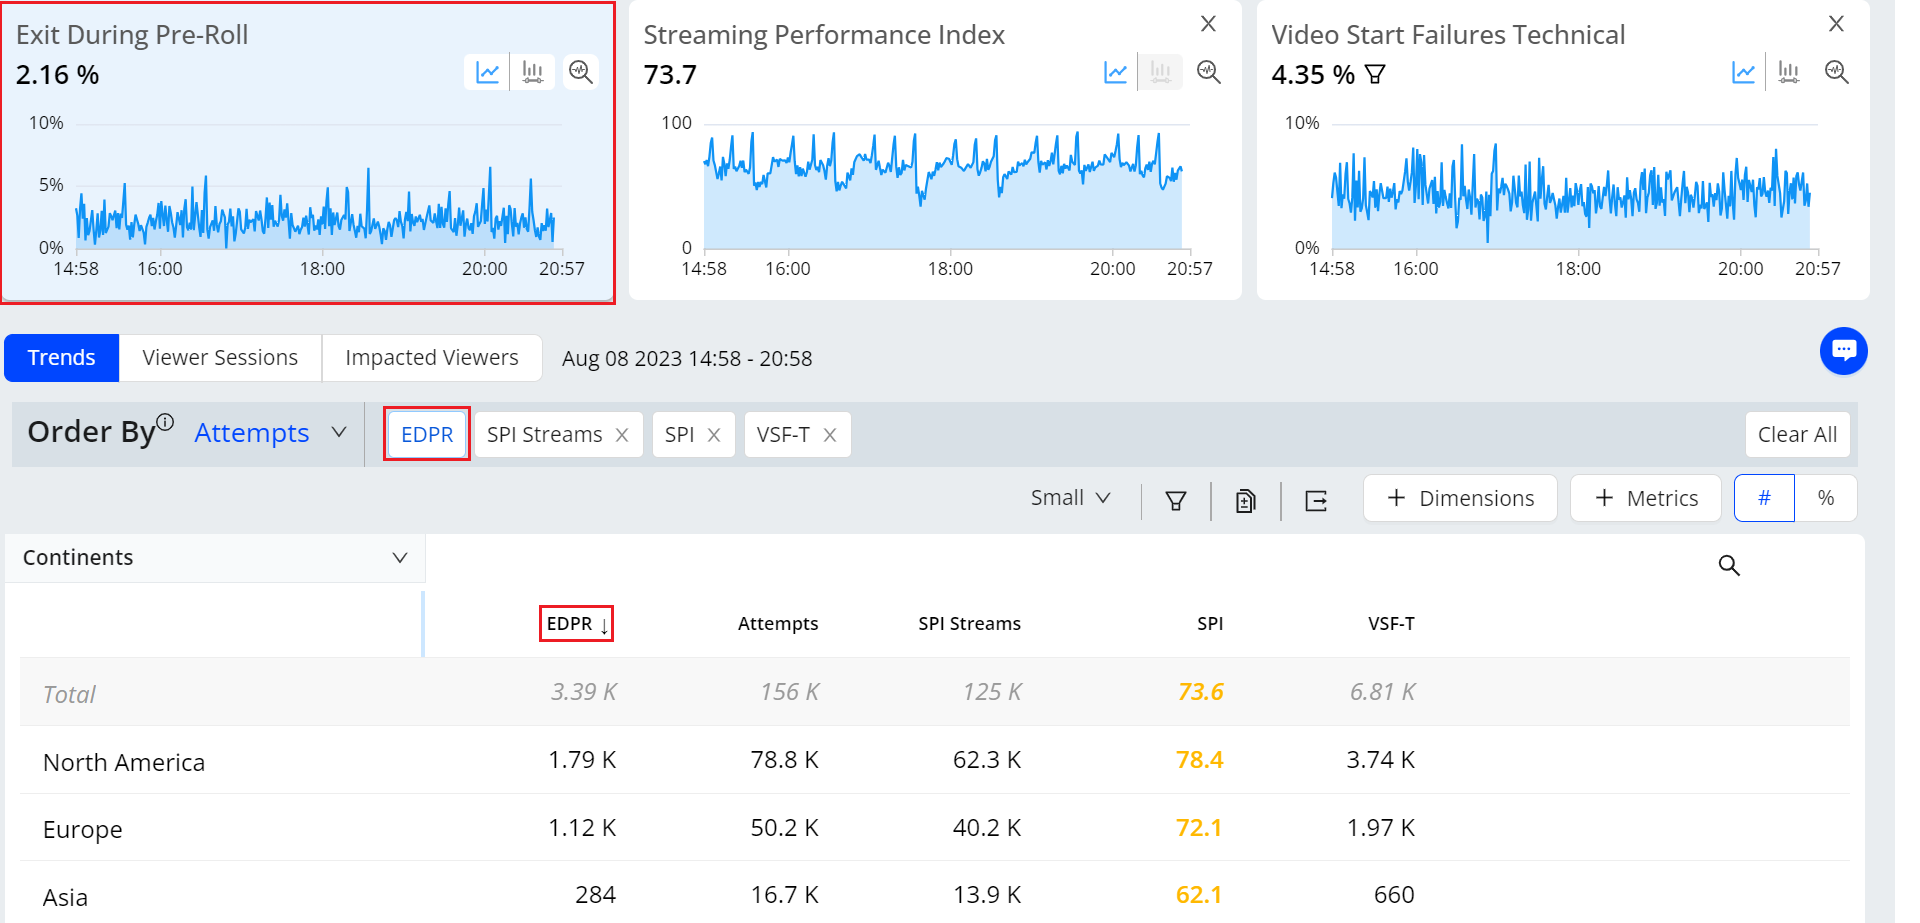
New Metric: Exit During Pre-Roll (EDPR)
|
Feature Update:
Introduces new Exit During Pre-Roll metric, which aggregates the exits during pre-roll ads in the selected time period.
Feature Impact:
This new metric enhances the Trends analysis with this new metric widget time series and distribution, along with a dimensional table column for EDPR.
Use Case:
You can use the EDPR metric to refine ad strategies, highlighting changes in ad engagement and improving the overall pre-roll ad user experience. For example, high exit rates during pre-roll ads on specific assets could indicate that the ads are not capturing viewers' attention or poor ad performance is negatively impacting the video startup experience.
More Details: Exit During Pre-Roll
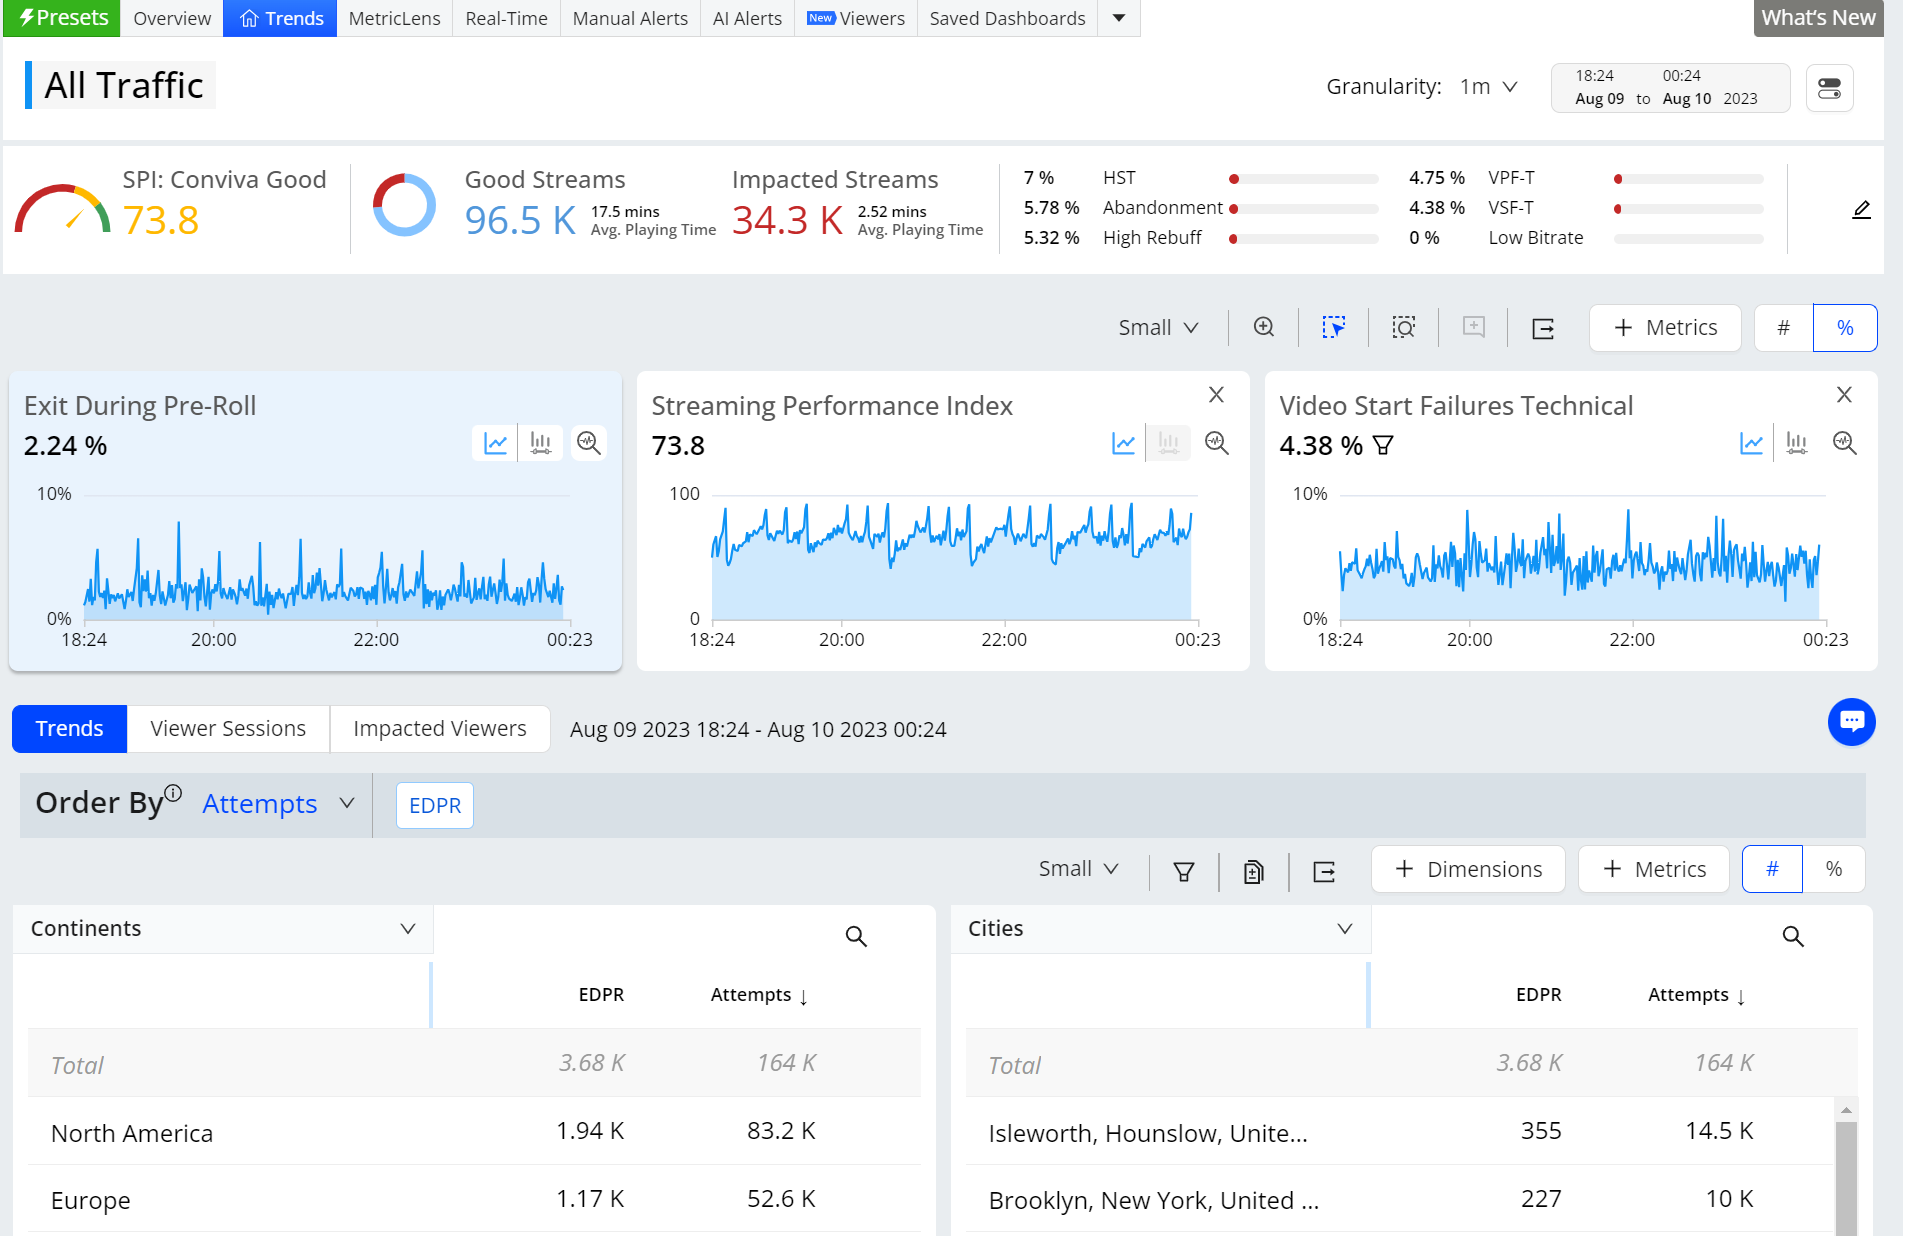
New Trends and AI Alert Diagnostic Workflows
|
Feature Update:
New Trends enhances performance analysis and issue resolution with the following features:
-
Customizable Summary Panel: Personalized snapshot of key metrics: SPI, Impacted Streams, and other metrics.
-
Secondary Filter [SF] on Metrics: Bringing impacted sessions and impacted devices to the forefront.
-
Secondary Filter [SF] on Error Message: Apply filter on VSF/VPF error message.
-
Secondary Filter [SF] on all Errors: One-click shortcut to apply Secondary Filter [SF] on all errors.
-
Filter on Unknown: Drill-down on the cause of missing values and discover more data wherever needed.
-
Improved Diagnostics workflows: Display all AI alerts and/or manual alerts events as annotations directly in Trends metric widget time series. The Diagnostics icon is now the Focus icon, which expands the time series view for that metric.
-
Top Impacted Viewers: Enable proactive customer care and go straight to outlier users.
-
Annotations: Keep track of important changes/events impacting QoE and/or engagement metrics.
-
Flexible and Powerful UX: Create personalized views for various use-cases with save/share capability.
-
Presets based on Trends: Off-the-shelf views which can be customized for easy save and share.
Feature Impact:
The old Trends is deprecated with the introduction to New Trends. You will no longer be able to view the old trends.
More Details: Trends Dashboard
MetricLens Time series

|
Feature Update:
Enhances the MetricLens to support up to 10 timeseries and also mark the Y axis in the timeseries with out mouse hover.
Feature Impact:
This features provides quick and clear metric value identification, with optimized space not hiding the adjacent chart.
Use Case:
You can easily compare the multiple dimension values during the data analysis.
More Details: MetricLens
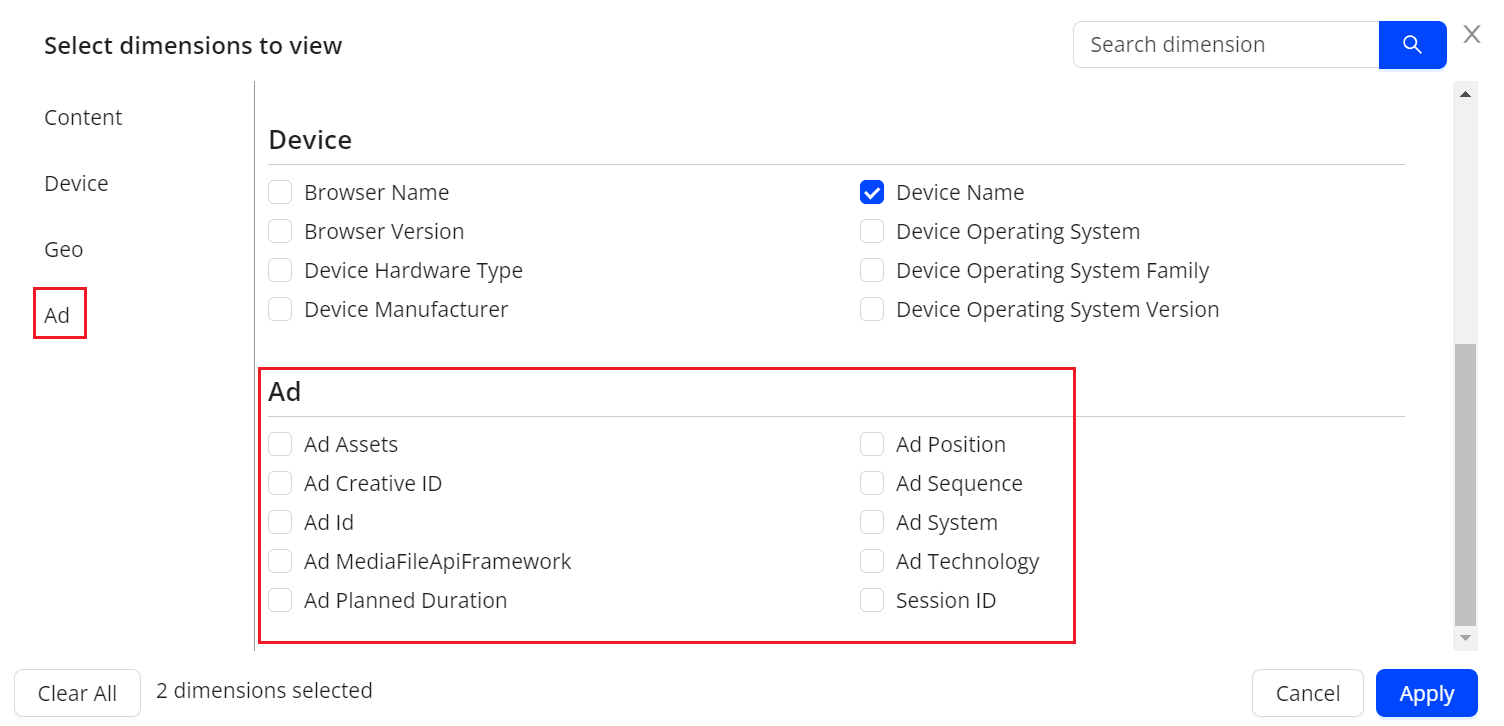
Ad Metadata as Dimensions in Trends
|
Feature Update:
Adds a new Dimension button above the dimension drill down tables for quick access to adding and removing dimensions. Also, adds the Ads dimension selector to the list of available dimensions.
Feature Impact:
Enhances dimension analysis with the addition of ad dimensions such as Ad Position, Ad Id, Ad Technology.
Use Case:
You can easily compare the multiple dimension values across video and ad performance.
More Details: Dimension Selection
Old Viewer Module Deprecation
Feature Update:
The Viewers link in the left menu is now removed.
Feature Impact:
The old Viewers link in the left menu is no longer available and the old Viewers Module is deprecated. The new Viewers is enhanced to include persistence, pagination, impacted sessions indicator, and an advanced simple mode view for custom tags.
Use Case:
Use the new Viewers module for enhanced viewer activity and impact analysis.
More Details: Viewers
July 20,2023
Support Scheduling Custom Dashboard as PDF
|
|
Feature Update:
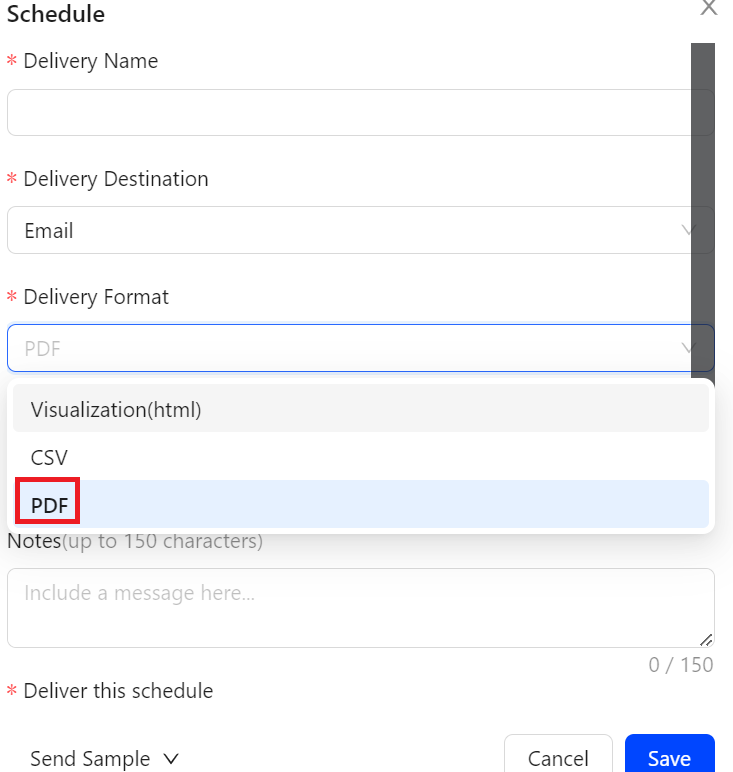
Adds support to allow you to schedule the delivery of custom dashboards as PDF files.
Feature Impact:
Provides the “PDF” option in the “Delivery Format” drop-down list on the “Schedule” dialog.
Use Case:
To schedule delivery of custom dashboards as PDF files, custom dashboards users, can select the “PDF” option from the “Delivery Format” drop-down list in the “Schedule” dialog.
More Details: Custom Dashboards
Support AD as a Data Source in Custom Dashboards
|
|
Feature Update:
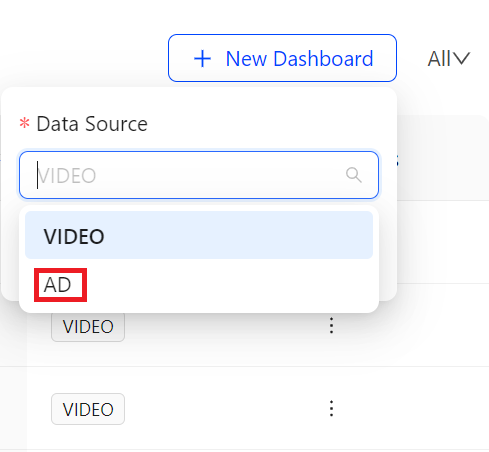
Adds support to allow you to select AD as a data source when creating dashboards. This feature enables you to create dashboards for tracking ad performance based on different ad types, such as client side ad and server side ad.
Note: Dashboards support only one type of data source, either VIDEO or AD.
Feature Impact:
-
Adds a new drop down list “Data Source” to enable you to select one type of data source when creating a new dashboard.
-
Adds a new column “Data Source” on the Custom Dashboard page to indicate the data source type for each created dashboard.
-
Adds “AD” and “VIDEO” in the drop down list located at the right corner of the Custom Dashboard page to enable you to filter the created dashboards based on the data source type.
Use Case:
To track ad performance, create a dashboard that uses AD as a data source and then create a widget with a specific ad type and required ad metrics and dimensions.
More Details: Custom Dashboards
Trends Viewer Session
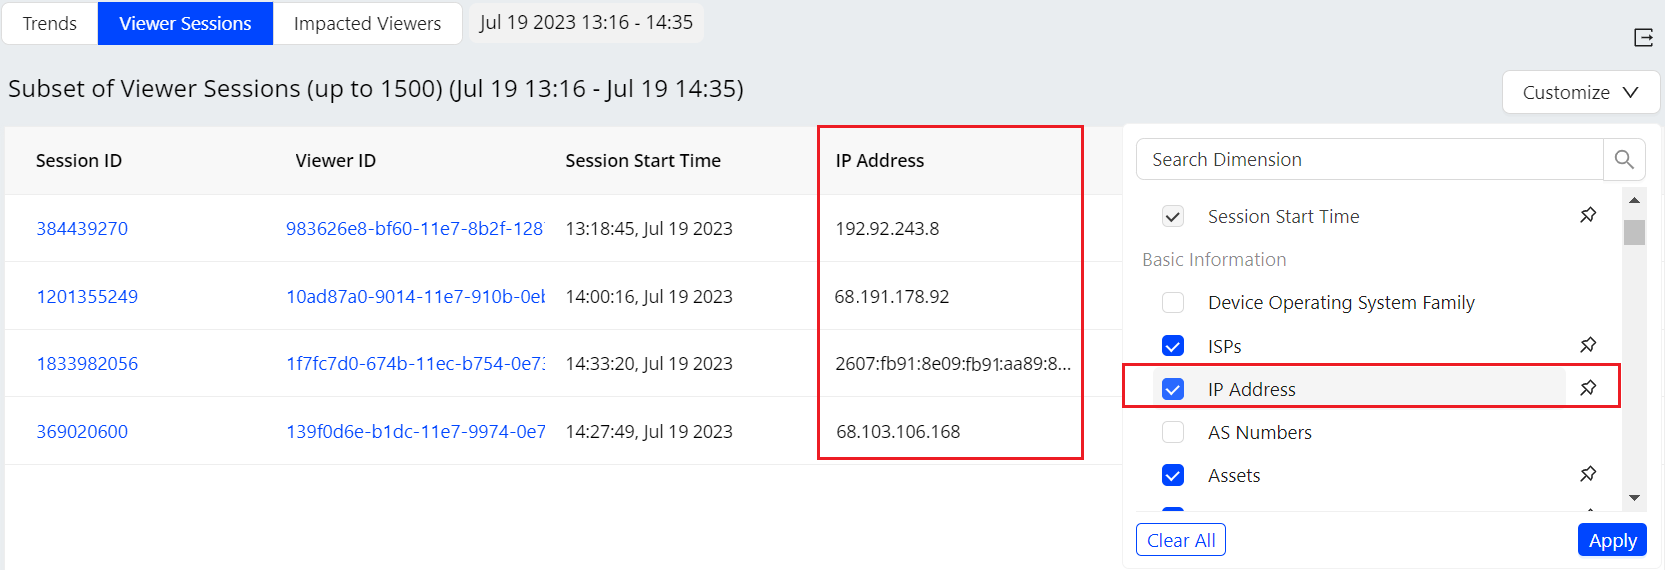
|
Feature Update:
Enhances the Viewer Session in Trends with the additional dimension - IP Address, used for effective troubleshooting and root cause analysis.
Feature Impact:
This addition enhanced the Viewer Session in Trends with a new column for IP address with both IP v4 and IP v6 address support.
More Details: Viewer Sessions
Advance Tags in Viewer Module

|
Feature Update:
Enhances the Viewer Module with the Advance Tag Toggle feature to switch between the basic and advance tag view.
Feature Impact:
This feature enhances the viewer module with a toggle button to view the advance tags.
More Details: Viewer Module
Trends Focus Mode

|
Feature Update:
Enhances the Focus mode in Trends with the addition of the respective secondary metrics in the time series.
Feature Impact:
This feature enhances the Trends with secondary metric details in the focus mode.
More Details: Trends Dashboard
July 6,2023
Rename Metric: Playing Time (Interval)
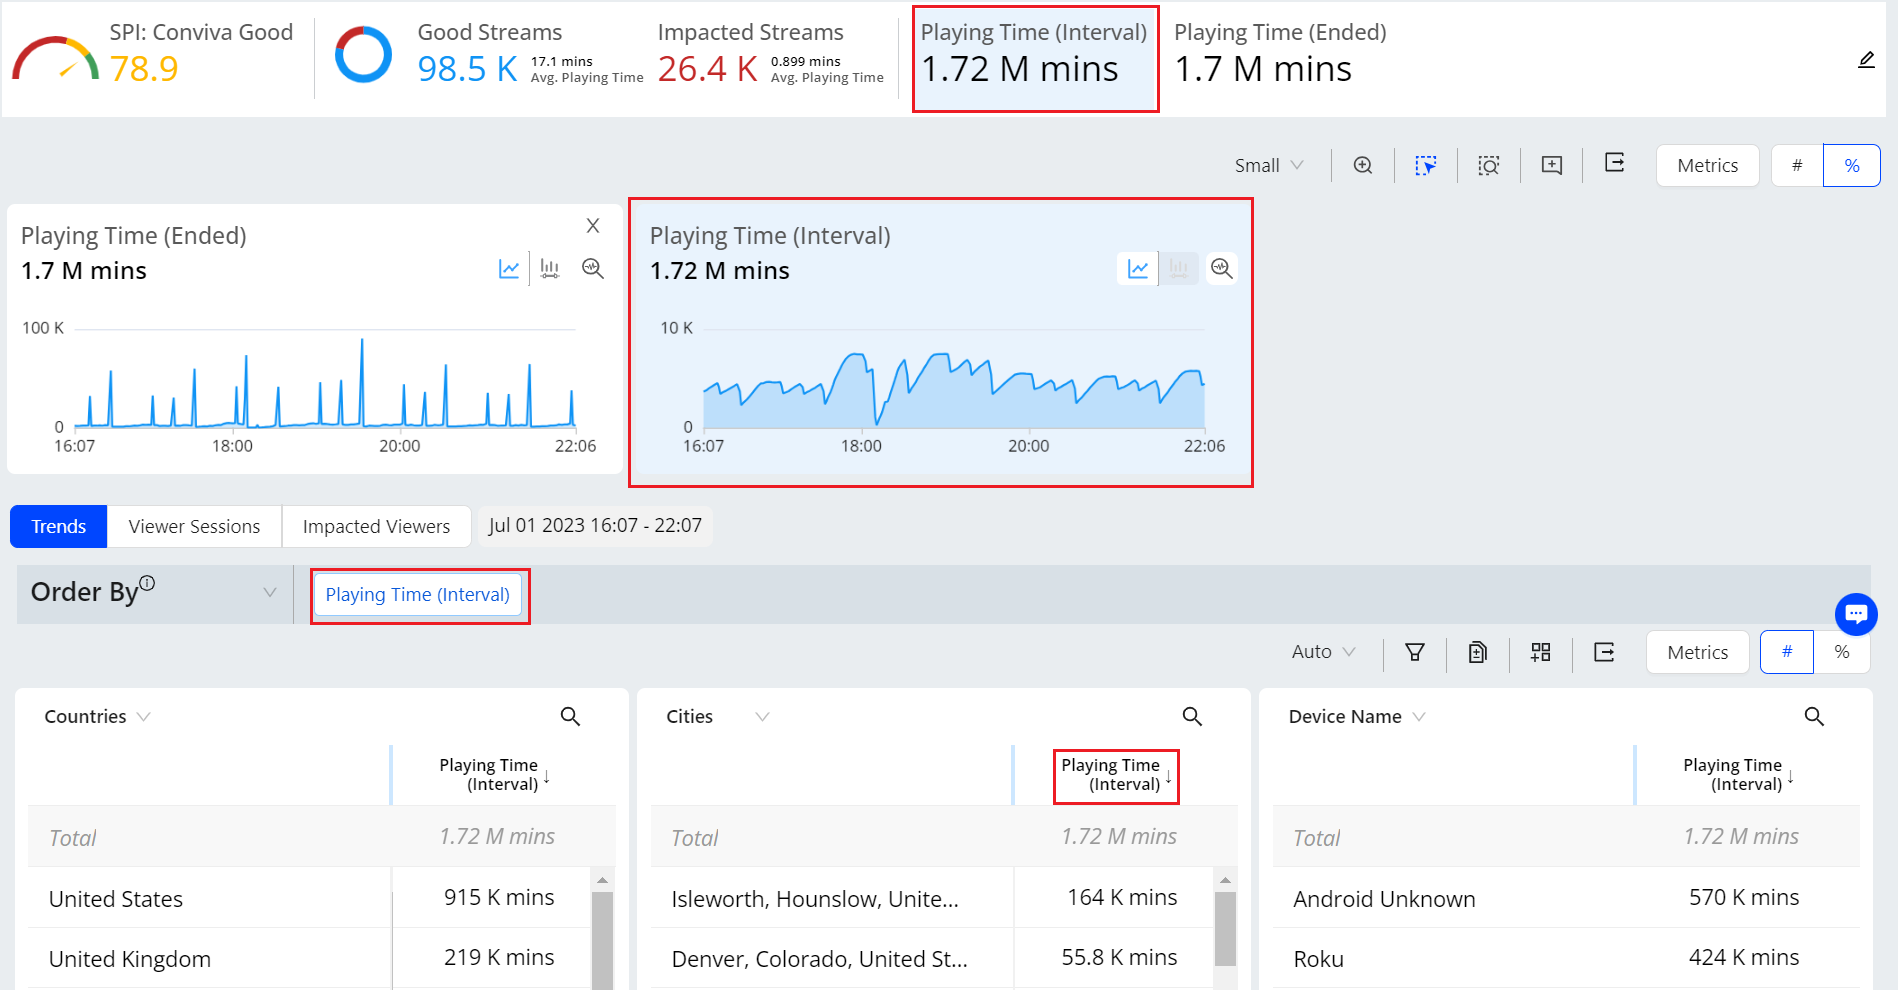
|
Feature Update:
Renames the Interval minutes metric to Playing Time (Interval) for easy accessibility, and simplified playing time analysis within intervals.
Note: There is no change to this metric calculation.
Feature Impact:
This metric displays as Playing Time (Interval) instead of Interval minutes in Trends and MetricLens.
More Details: Playing Time (Interval)
Rename Metric: Playing Time (Ended)
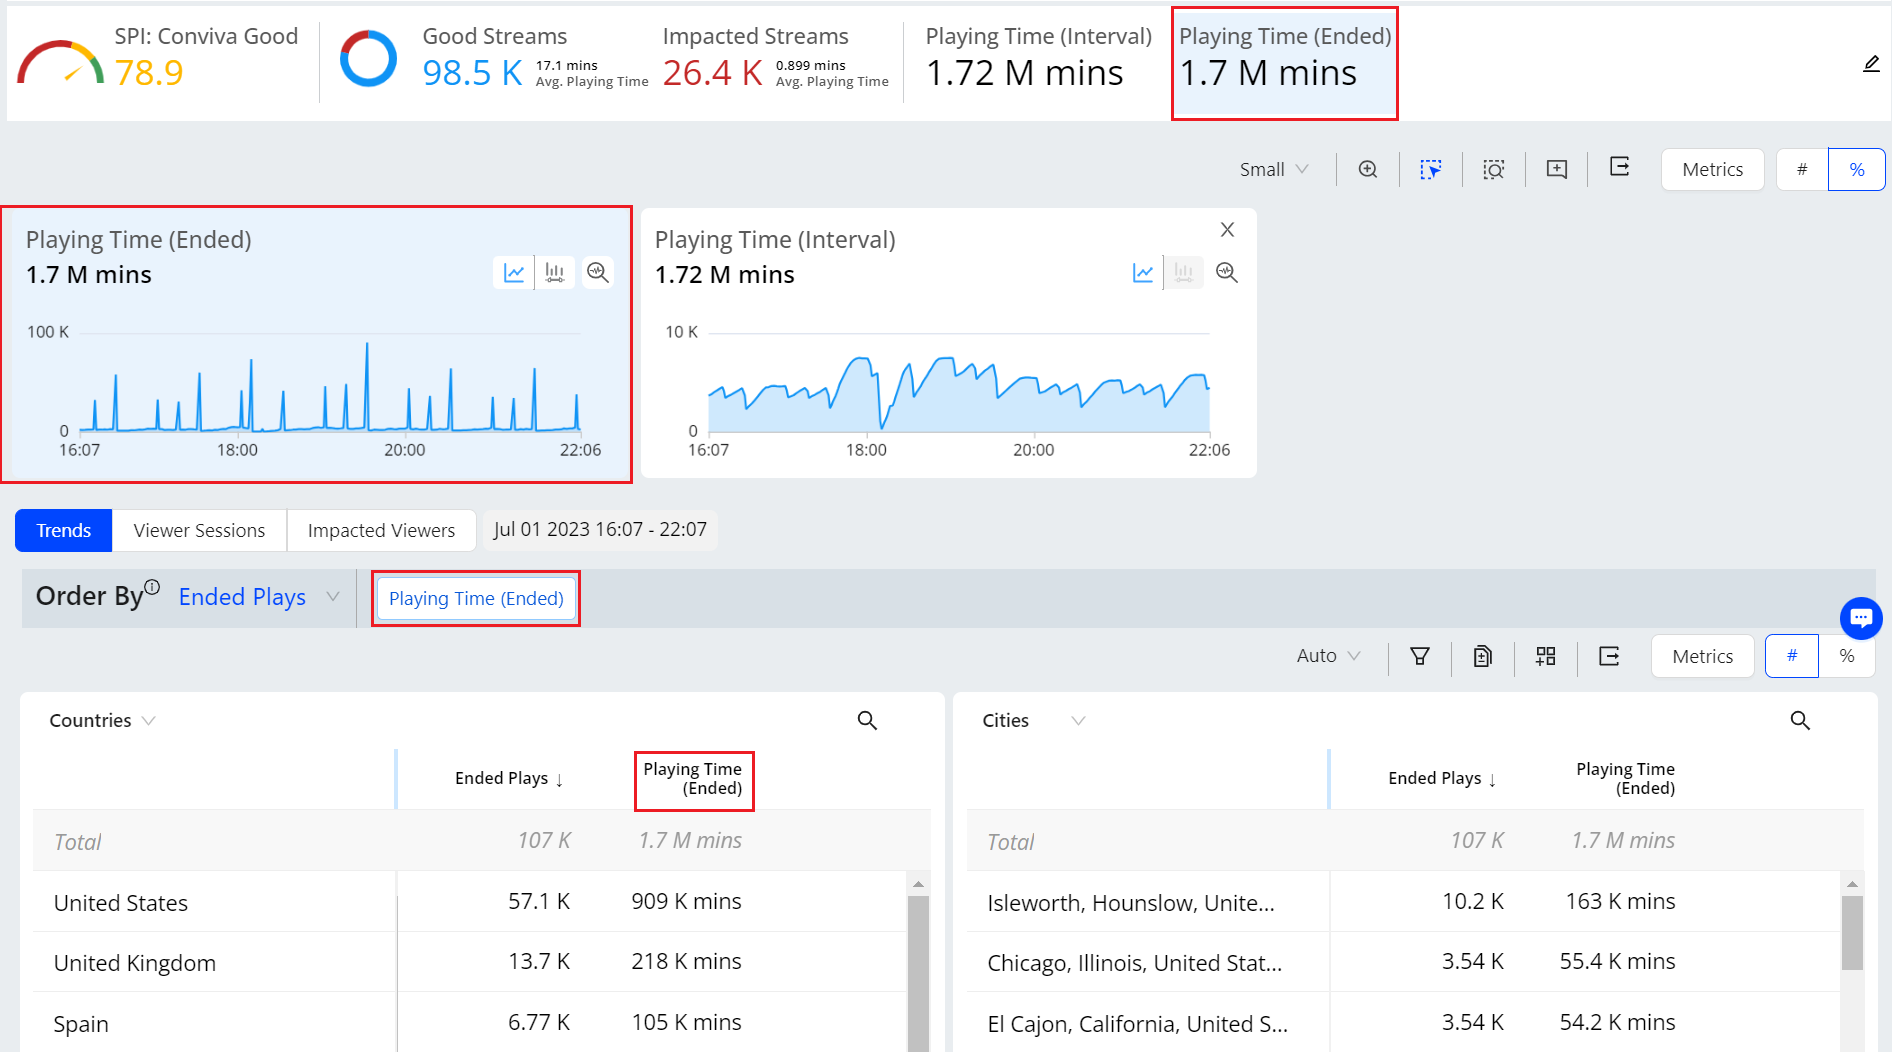
|
Feature Update:
Renames the Ended Play Duration metric to Playing Time (Ended) for easy accessibility, and simplified playing time analysis across ended plays.
Note: There is no change to this metric calculation.
Feature Impact:
This metric displays as Playing Time (Ended) instead of Ended Play Duration in Trends and MetricLens.
More Details: Playing Time (Ended)
June 29,2023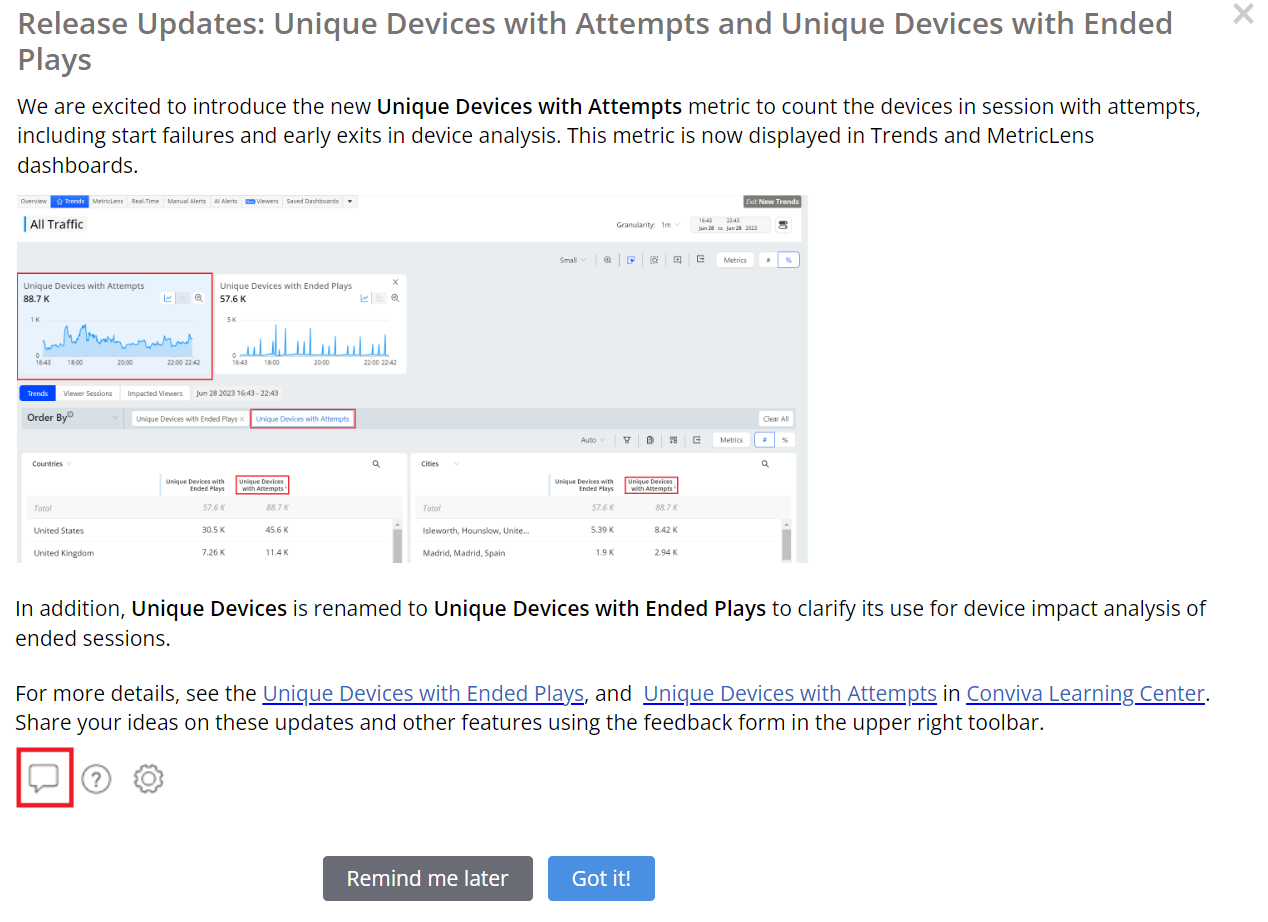
Support to Export and Schedule Data in CSV

|
New Feature:
Adds support to allow you to export the custom dashboard data in CSV format and schedule the delivery of custom dashboards with CSV files.
Feature Impact:
-
Adds “Export” in the kebab menu for each dashboard.
-
Provides the “CSV” option from the “Delivery Format” drop-down list on the “Schedule” dialog.
Use Case:
-
To download custom dashboards data, click “Export” from the kebab menu of the dashboard.
-
To get scheduled reports with CSV files, set up scheduled email delivery for a custom dashboard with “CSV” selection from the “Delivery Format” drop-down list in the “Schedule” dialog.
More Details: Custom Dashboards
Enhanced Schedule Management
|
|
New Feature:
Enables the “Schedule Management” tab as a fixed tab on the Custom Dashboards page to allow you have a convenient access to manage eligible schedules. The admin users can view and edit all schedules while non-admin users can view schedules that they have access to and edit the schedules that they created.
Feature Impact:
-
Makes “Schedule Management” as a fixed tab on the Custom Dashboards page.
-
Grants Pulse admin role with full view and edit permission for schedule management.
Use Case:
To manage schedules, select the “Schedule Management” tab on the Custom Dashboards page, and perform the management action for the schedule you want to edit.
More Details: Custom Dashboards
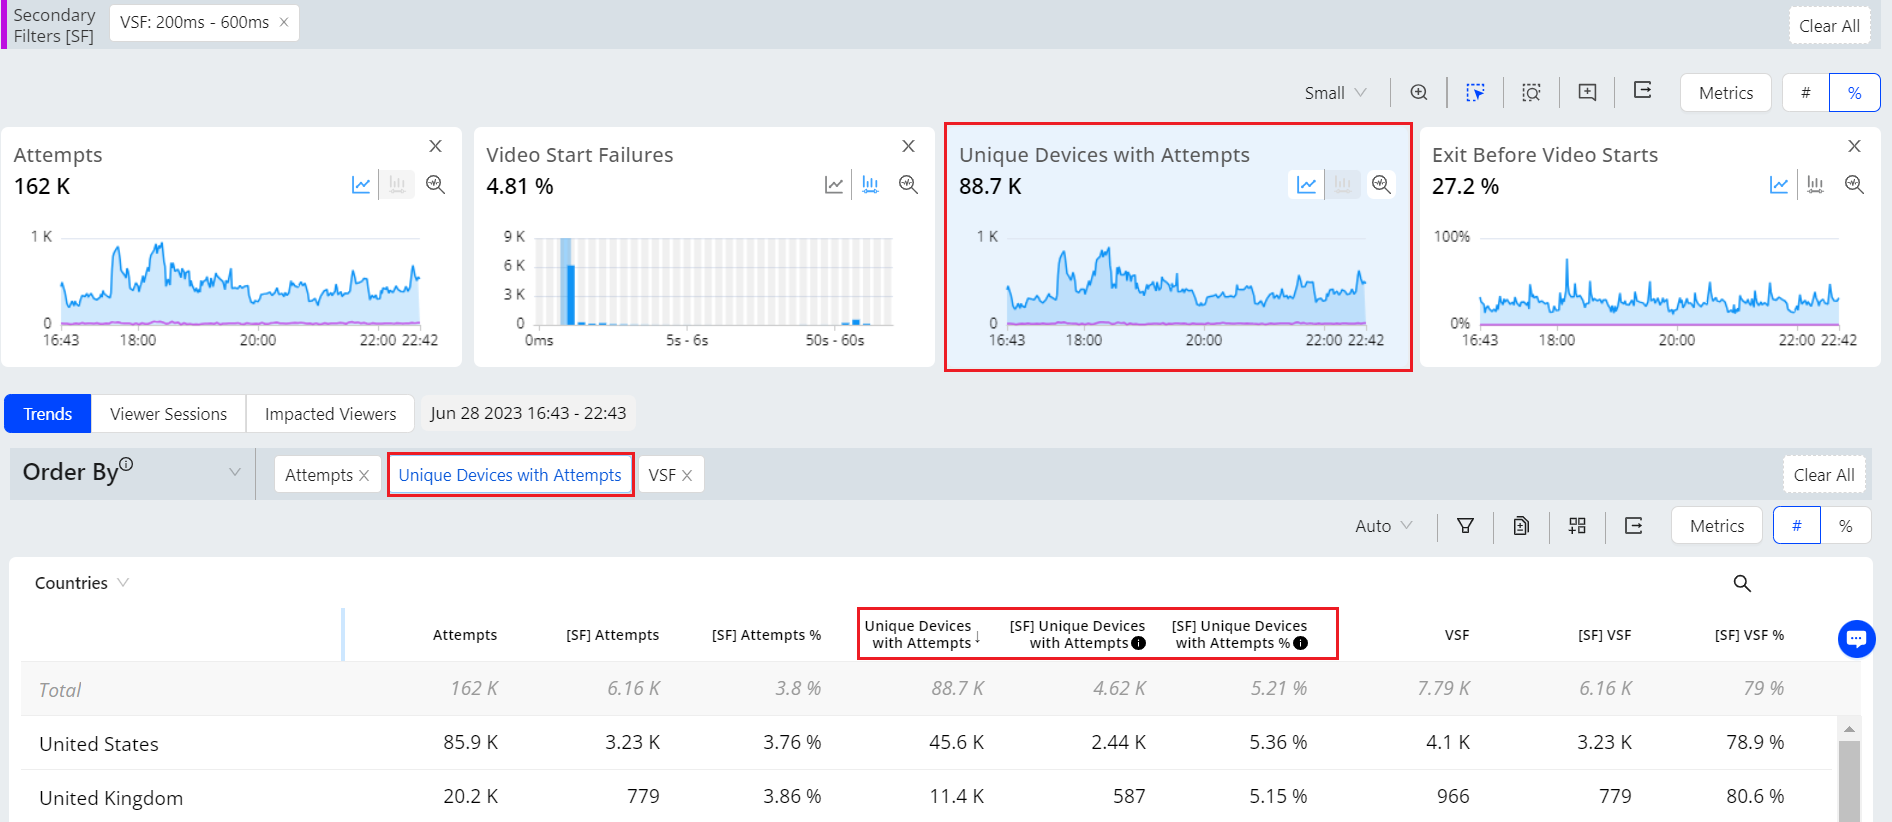
New Metric: Unique Devices with Attempts
|
Feature Update:
Introduces the new Unique Device with Attempts metric, which counts the devices with attempts in the current interval, including startup failures and early exits (such as VSF and EBVS).
Feature Impact:
This new metric enhances the Trends and MetricLens with the new column Unique Device with Attempts.
Use Case:
This metric helps clarify the set of impact devices by including devices for sessions with startup issues and early failures.
More Details: Unique Device with Attempts
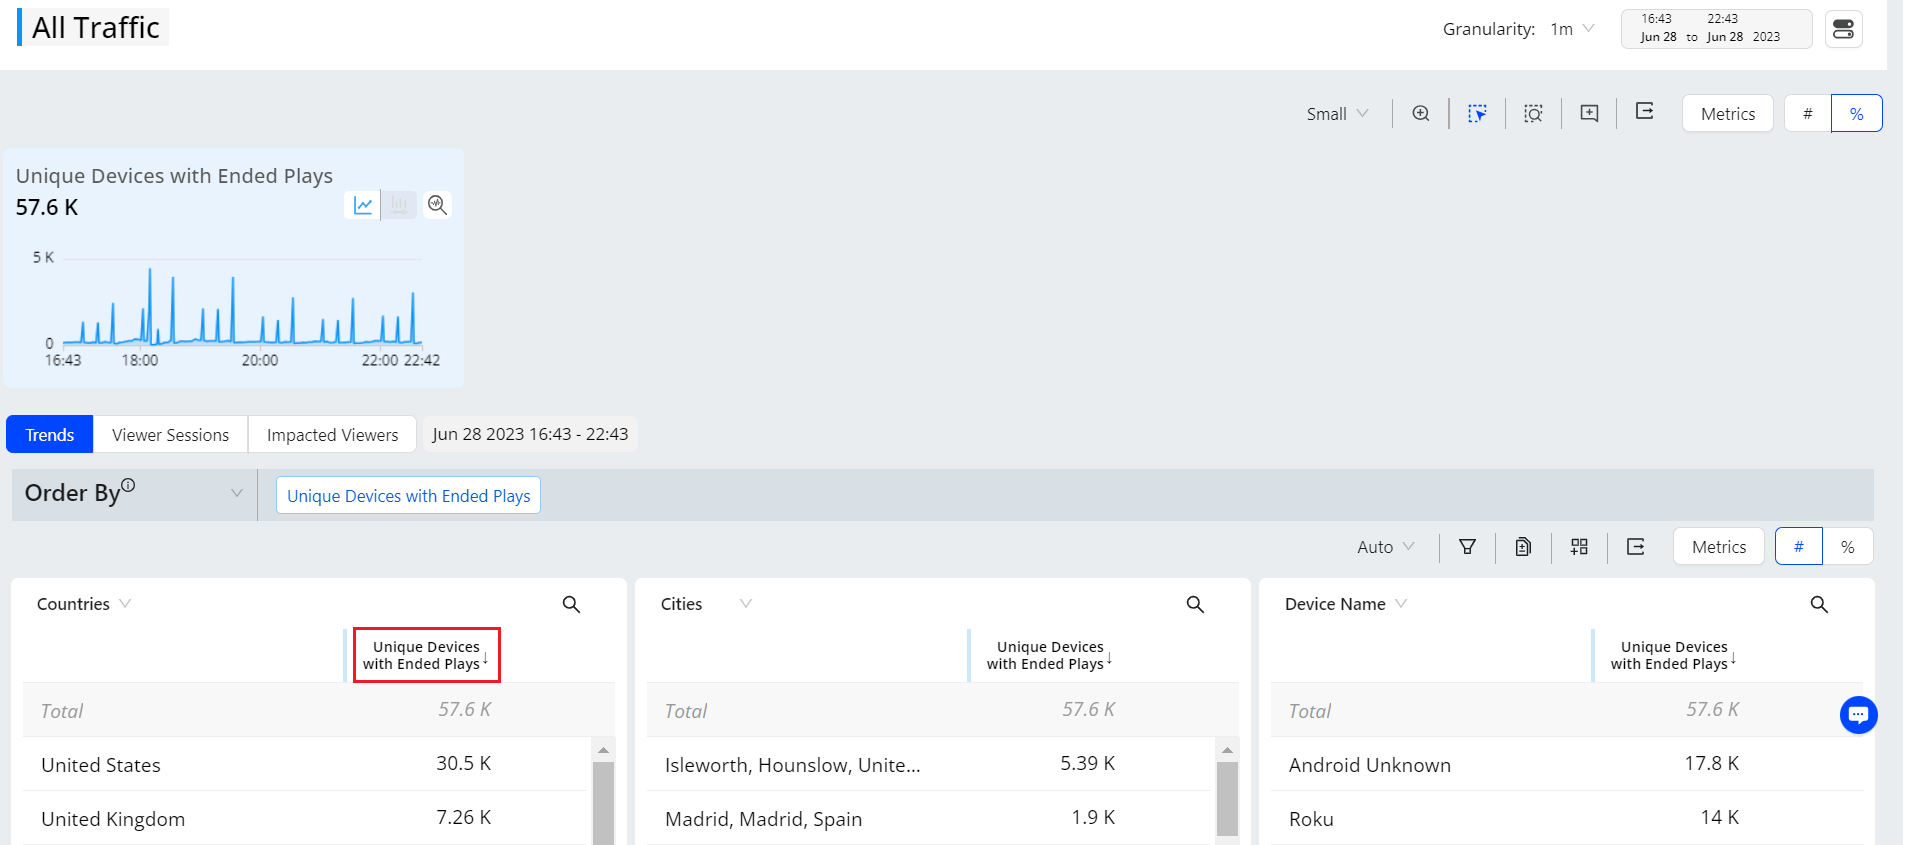
Rename Metric: Unique Devices with Ended Plays
|
Feature Update:
Renames the Unique Devices metric to Unique Devices with Ended Plays to clarify the analysis of the devices and session impacts across ended plays, excluding start failures and early exits.
Note: There is no change to this metric calculation.
Feature Impact:
This metric displays as Unique Devices with Ended plays instead of Unique Devices in Trends and MetricLens.
More Details: Unique Devices with Ended Plays
June 8,2023
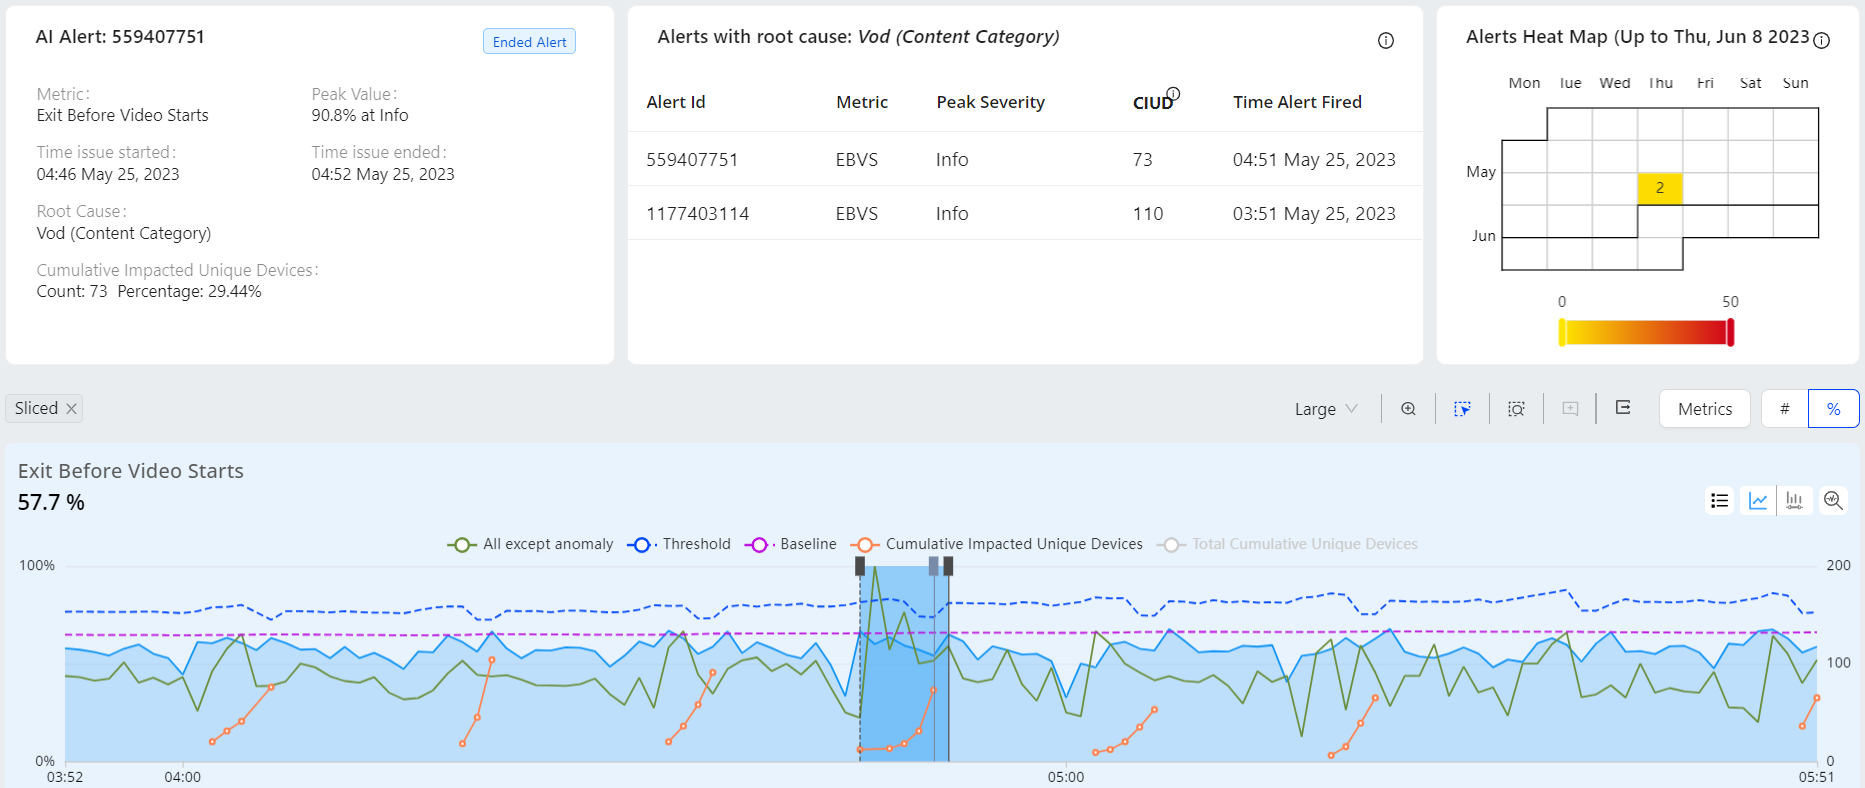
New Trends Diagnostics Workflow (Beta)
|
Feature Update:
Enhances the New Trends (Beta) diagnostics with a easier workflow for a smooth user experience.
Feature Impact:
This new feature enhances the New Trends with a new Alerts Dashboards page providing the alert summary, all alerts list with the same root cause, heat map details along with the metric widgets and dimension data.
Use Case:
You can get a comprehensive view of the alerts for easier drill-down of the data.
More Details: Trends Dashboard
Customize Summary Panel (Beta)

|
Feature Update:
Enhances the New Trends (Beta) Summary Panel customization with edit option.
Feature Impact:
This new feature enhances the New Trends Summary Panel allowing you to display only the required metrics in the summary panel.
Use Case:
You can select the metrics to be displayed based on your requirement using the edit option in the Summary panel.
More Details: Trends Dashboard
Custom Dashboard Templates

|
New Feature:
Provide pre-defined dashboards for out-of-the-box use cases and customized starting points. Clone to make your own edits based on a template dashboard. For example, to view the number of concurrent plays during the live events, clone the Concurrency Tracking for Live Events template and add new dimensions accordingly.
Feature Impact:
-
Adds the pre-defined custom dashboards marked with a template icon in the Custom Dashboards list.
-
Provides the Template filter in the filter kebab, so you can quickly find the template dashboards.
Use Case:
Before creating a custom dashboard from scratch, consider starting with a template dashboard to leverage the most common predefined settings. For example, use a template for concurrency tracking for live events to quickly create a Custom dashboard to visualize the number of concurrent plays during these events.
More Details: Custom Dashboards
Error Code Table Support
|
|
Feature Update:
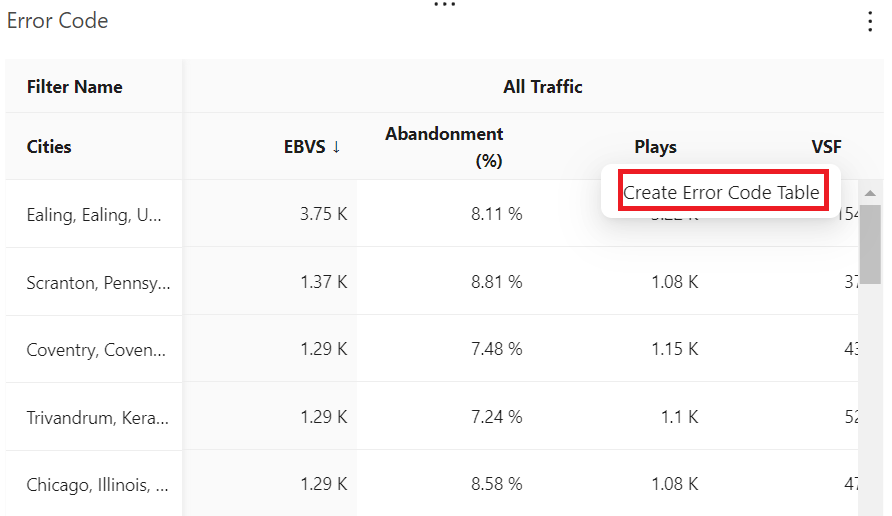
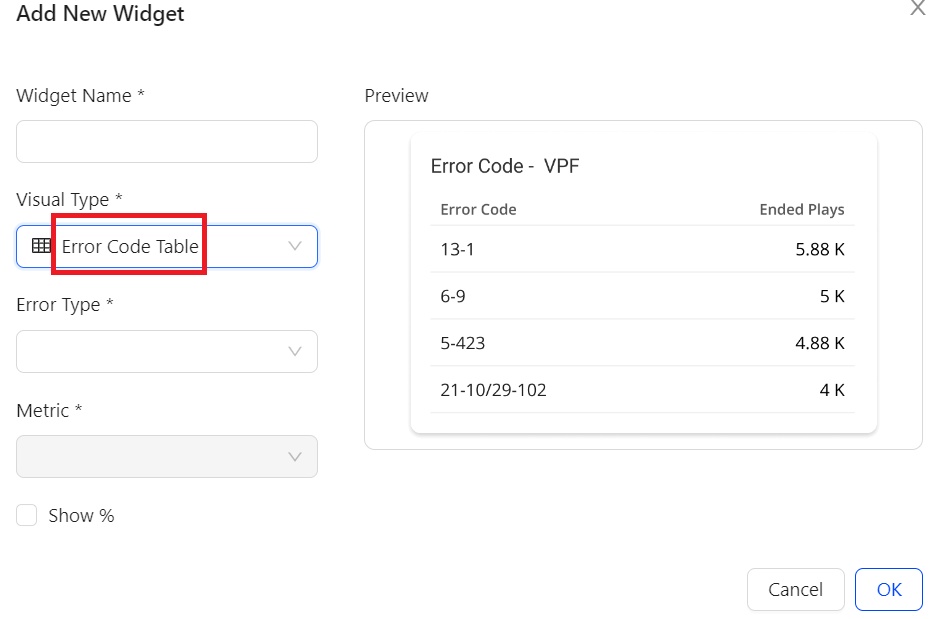
Adds support for error code tables to improve error analysis. To enable an error code table:
-
Click the metric name, such as VSF, to add the error code table with error breakdowns rather than aggregate totals.
-
Click the ‘New Widget’ button, select Error Code Table from the drop-down list and select the required fields, including Error Type.
Feature Impact:
-
Adds the Create Error Code Table button for error-type metrics within a widget.
-
Provides the Error Code Table option in the Visual Type drop-down list on the Add New Widget page, along with a new Error Type drop-down list.
Use Case:
To do further analysis on the specific error-type metrics, such as VSF, simply click the metric to create an error code table. Error code tables provide additional details to help you identify which errors are most impactful and accelerate error troubleshooting.
More Details: Custom Dashboards
Support to Filter Summary Metric Widget Data
|

|
Feature Update:
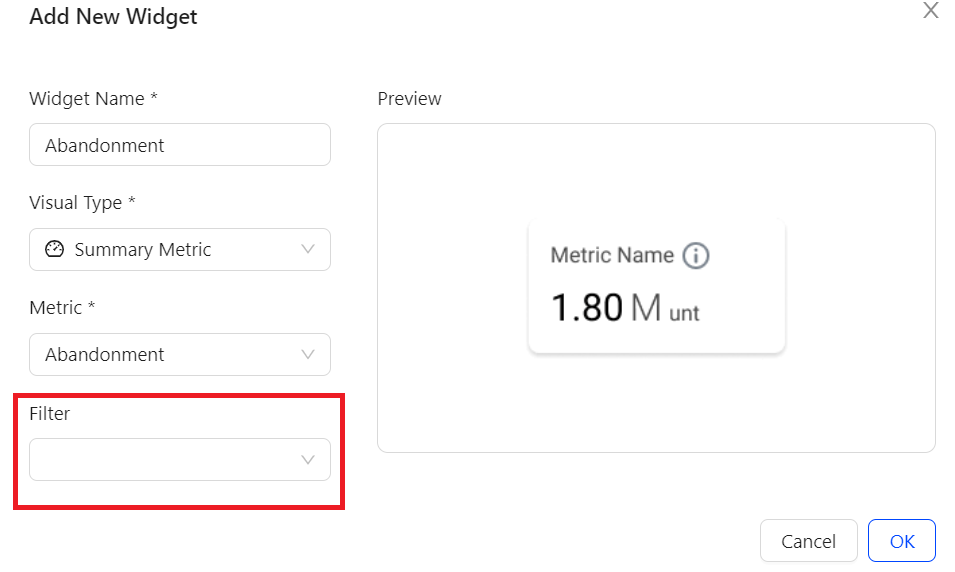
Adds support to include a single filter in each Summary Metric widget. You can select a filter from the newly added filter drop-down list. When checking a summary metric widget, the filter icon in blue indicates a filter working on this widget. Hover over the filter icon to see which filter is applied.
Feature Impact:
Adds a filter list in each Summary Metric widget so you can apply a single filter to each Summary Metric widget.
Use Case:
To compare the number of plays across all traffic and specifically plays in the live category, create two summary metric widgets with the plays metric and then apply a live filter to one of the summary metric widgets.
More Details: Custom Dashboards
Dark Mode Support

|
New Feature:
Adds dark mode so you can toggle the display appearance. In most cases, dark mode provides a better monitoring experience on a big screen. Toggling the dark or bright mode in other Conviva Video dashboards also affects the Custom Dashboard, and vice versa.
Feature Impact:
Adds the Dark Mode toggle in the menu bar, located in the upper right corner of the Custom Dashboard page.
Use Case:
To optimize your monitoring experience on a big screen, simply toggle the dark mode option in the menu bar.
More Details: Custom Dashboards
May 18,2023 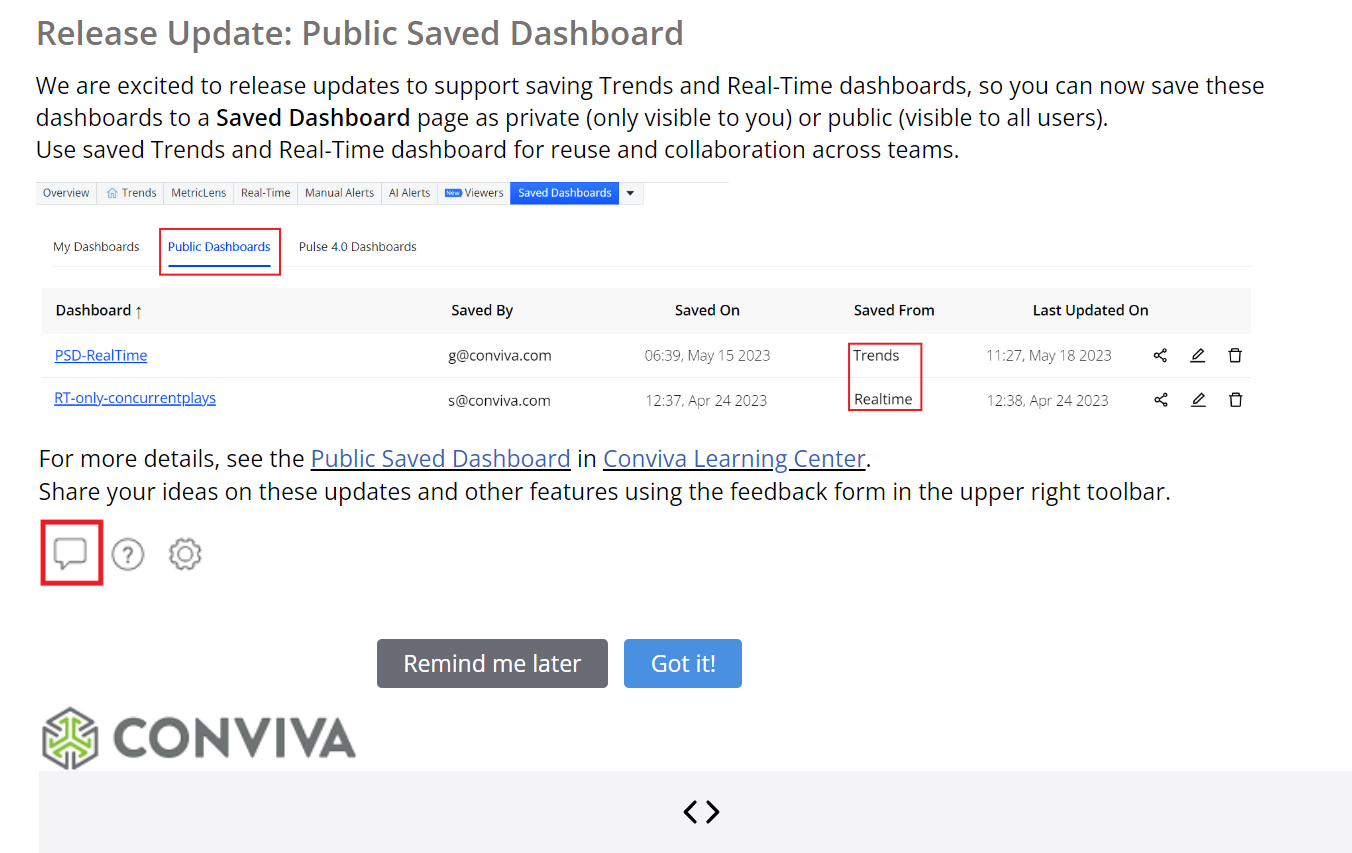
Public Saved Dashboard (Beta)

|
Feature Update:
Enhances the New Trends (Beta) and Real-Time dashboards with the option to publicly save a dashboard.
Feature Impact:
This new feature enhances the Saved Dashboards page with a new Public Dashboards tab listing all the publicly-saved dashboards. You can share the saved dashboard with other users to view the content. Only the owner can edit the data after the dashboard has been saved.
Use Case:
You can customize the dashboard and save it to reuse and collaborate the with other users.
More Details: Public Saved Dashboard, Trends Dashboard, and Real-Time Dashboard.
Display Custom Percent Values in Custom Dashboards
|
Feature Update:
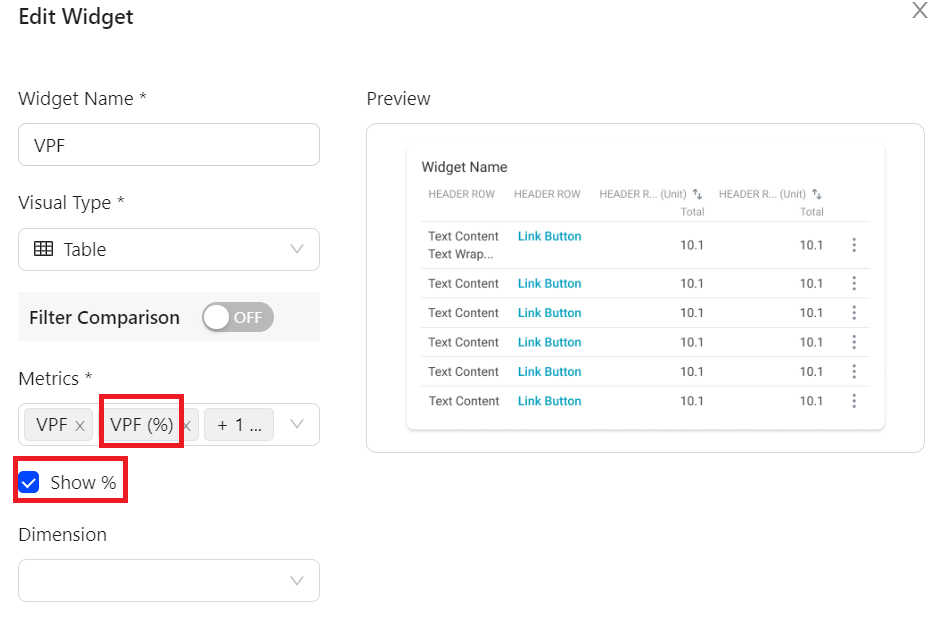
Adds support to display metric values as percentages within widgets. With this new feature, you can select metrics as a numeric and percentage, such as VPF and VPF%.
Feature Impact:
-
For some metrics, such as VPF, adds a dedicated metric, such as VPF(%), in the Metrics drop-down list when creating or editing a widget.
-
Adds the Show % check box on the Add New Widget and Edit Widget pages.
Use Case:
To view metrics percentages in a widget, such as the Attempts metric, select the Show % check box while creating the widget. After creating the widget, you can check the Attempts metric values as percentages.
More Details: Custom Dashboards (Beta)
April 27, 2023 
New Trends (Default option - Beta)

|
Feature Update:
Enhances the New Trends (BETA) as the default option with a range of new features.
Feature Impact:
The New Trends now is the default option where the system displays the New Trends page as the default view whenever a page refreshes or a session expires. The New Trends introduces a range of new features that are only available in New Trends. These features include:
-
Metric Filtering with pre-added unique devices and secondary metrics
-
Enhanced Live mode experience
-
Summary Panel with improvement opportunities and filtering on Impacted Streams
-
Annotations, zoom to select and other tools for the chart section
-
Ability to change dimension table height (Auto, Medium, Large)
-
Up to eight dimensions supported in the new trends table and search on dimension columns
-
Filtering the Unknowns
-
Top Impacted Viewers
-
Advanced filter mode and new filter panel
More Details: Trends
Advance Benchmarks (Beta)

|
Feature Update:
Enhances the Benchmark feature support to 13 dimensions starting at the required country level and any combination of the remaining dimensions.
Feature Impact:
This new feature enhances the Overview dashboards with a new column for the additional Benchmarks by dimension.
Use Cases:
This feature provides a easy way to identify the under-performing dimensions based on the Industry benchmarks, such as a specific country and device operating system combination.
More Details: Overview Dashboard
April 6, 2023 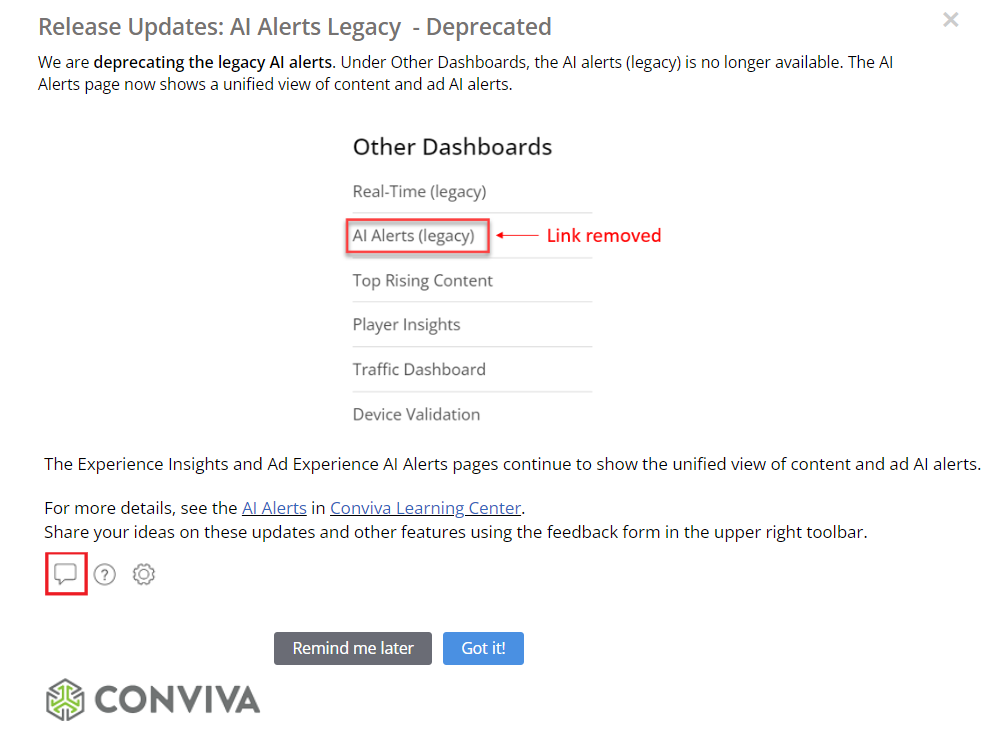
Legacy AI Alerts (Deprecated)
|
Feature Update:
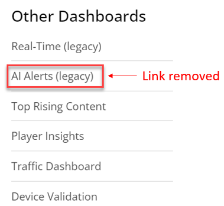
Deprecates the Legacy AI alerts for Ad and Content. Under Other Dashboards, the AI alerts (legacy) is no longer available. The AI Alerts page now shows a unified view of content and ad AI alerts.
Feature Impact:
The Video and Ad Experience AI Alerts pages continues to show the unified view of content and ad AI alerts. It is recommended you to use the enhanced AI Alerts. This means that the legacy AI alerts will no longer be supported going forward.
More Details: AI Alerts
Concurrent Plays (Limited availability)
|
Feature Update:
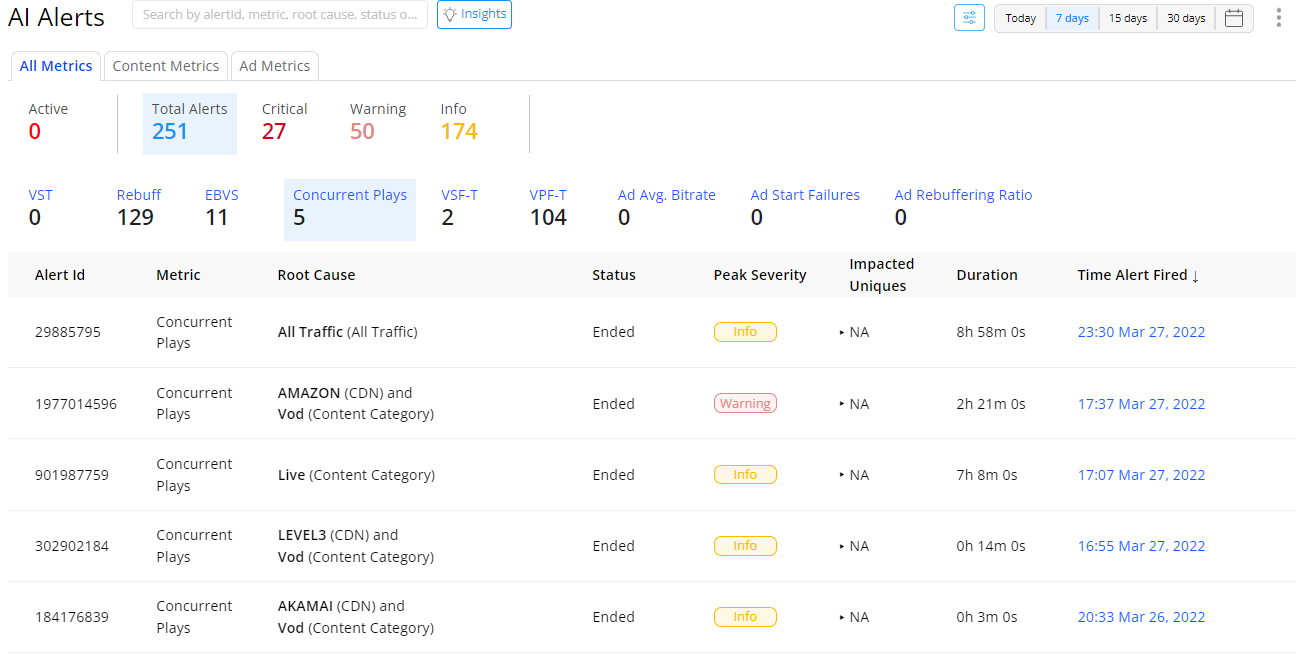
Enhances the AI alerts with a new alert based on concurrent plays.
Feature Impact:
This enhanced AI alert based on concurrent plays displays the impacted root cause group along with the impacted unique devices for anomalies in the expected level of concurrent plays, such as sudden drop in VoD viewer concurrency due to a CDN performance issue.
The availability of AI alerts for concurrent plays is limited. To enable this feature, please contact your Conviva representative.
Use Cases:
This AI Alert helps you respond to abnormalities in expected concurrency, helping you to analyze unexpected concurrency changes across VoD, VoD+CDN, VoD+OS Family, root cause groups.
More Details: AI Alerts
February 23, 2023 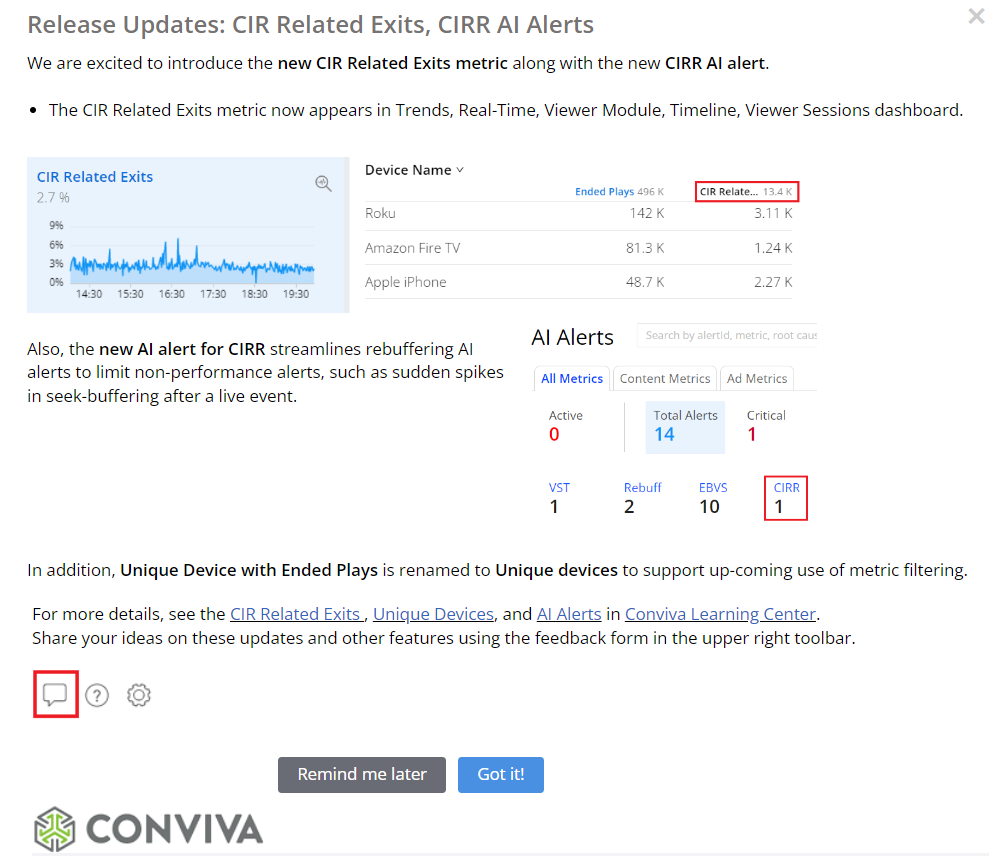
New Metric: CIR Related Exits

|
Feature Update:
Introduces the new CIR Related Exits metric, which helps you understand the number and percent of plays that likely ended due to CIR.
This metric considers an ended play as related to CIR if the viewer exits:
-
During CIR.
-
Within 5 seconds after the end of CIR.
-
With a gap of less than 30 seconds of non-CIR time between CIR events and the session end.
Feature Impact:
This new metric enhances the Trends, Viewer Sessions, Timeline, and Viewers dashboards with a new column for CIR Related Exits.
This metric appears as a distribution verses Ended Plays in Trends Diagnostics.
Use Cases:
This metric helps you determine the impact of rebuffering on viewer experience which led to viewers exiting the video. The metric distribution helps identify the groups of sessions with the highest levels of non-seek rebuffering and with exits most likely related to CIR.
More Details: CIR Related Exits
Renamed Metric : Unique Devices with Ended Play is renamed to Unique devices

|
Feature Update:
Renames the metric Unique Devices with Ended plays back to Unique Devices to align the name for the upcoming changes in metric filtering.
Note: There is no change in the underlined calculation.
Feature Impact:
This metric displays Unique Devices instead of Unique Devices with Ended plays in Trends and Metric lens.
More Details: Unique Devices
CIRR AI Alerts

|
Feature Update:
Supports the AI alert CIRR metric in place of the Rebuffering Ratio, which enables customers to eliminate seek-related alerts that cause unnecessary disruption, such as sudden spikes in seek-buffering after a live event.
Feature Impact:
The CIRR AI alert replaces the existing AI alert based on Rebuffering Ratio (RR). Any existing RR AI alerts are automatically converted to CIRR AI alerts with the same notification settings and sensitivity settings. Any previously generated RR AI alerts will continue to be displayed in the AI Alerts dashboard. RR to CIRR is seen in the AI Alert Forwarding and Email Notification.
Use Cases:
This feature helps you to reduce noise caused due to seek related alerts.
More Details: AI Alerts
