Trends enables you to easily rearrange and resize widgets for seamless cross-metric analysis. You can directly remove metrics without relying on the metric panel.
The metric widgets also enables the distribution view and focus mode of the time series.
The distribution view breaks down the session to illustrate how streaming impacts the metric overall. This helps in determining whether the metric reflects consistent session behavior or session variance caused by outliers.
The focus mode provides the magnified view of the diagnostics metric widget with the associated secondary metrics.
Rearrange Metric Widgets
The horizontal metric widget layout displays more number of metric time series and allows you to rearrange widgets using the selector. You can place most affected metrics next to each other for easier analysis.

Focus Mode
The focus mode provides a magnified view of the diagnostics metric widget along with the secondary metric details on the time series.

 Metric Widget Selection
You can select the metrics from the metric popup page. Alternatively, you can utilize the search bar to locate the desired metric and select the metrics based on a search query.

You can remove the metric widget using the close ( x ) button.

After rearranging the metric widgets use the toolbar options to zoom, select and annotate the data.

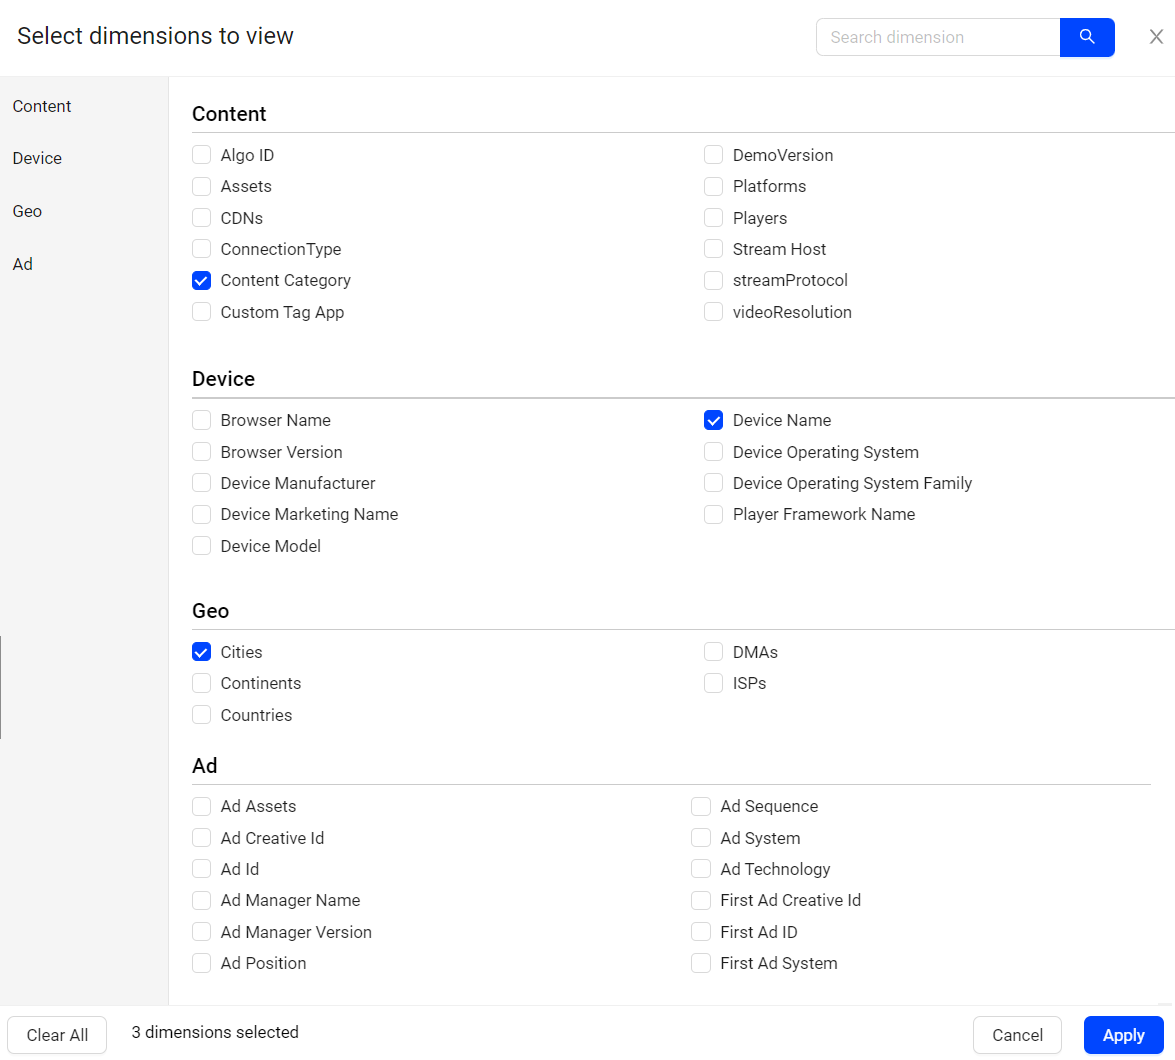
Dimension Selection
You can select the dimensions from the dimension popup page. Alternatively, you can utilize the search bar to locate the desired dimension and select the dimension based on a search query.
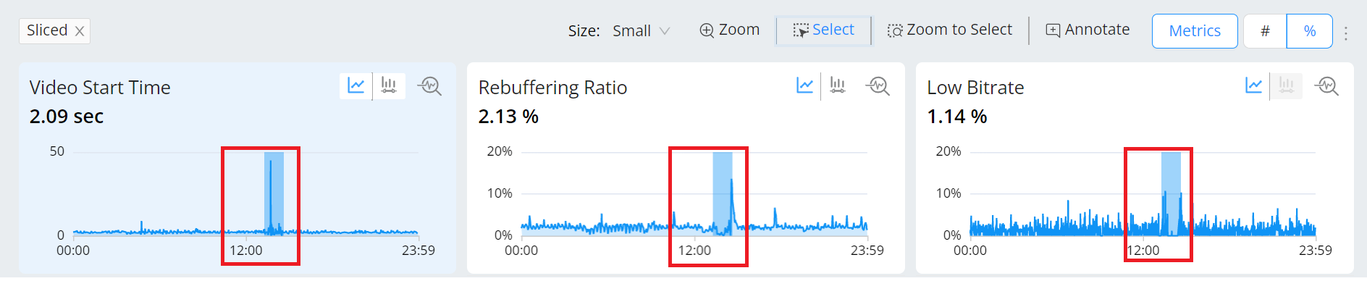
Select / Sliced
Selecting the time slice of data in one metric widget, selects the same time slice in the other widgets. For example, selecting the time slice Video Start Time from 13:03 to 14:30 , highlights the same time period on the other metric widgets.
Zoom
Zooming in on the time slice of data in one metric widget, selects the same time slice in the other widgets. Zooming allows you to focus on the specific data points that may not be visible in the full distribution or time series. For example, the data displayed for all the metrics are from the selected time range from 12:49 to 15:27.

Note: For easy access you can zoom and select in one step.

Trends from the Toggle menu allows you to share the dashboard and make Trends as the default page.
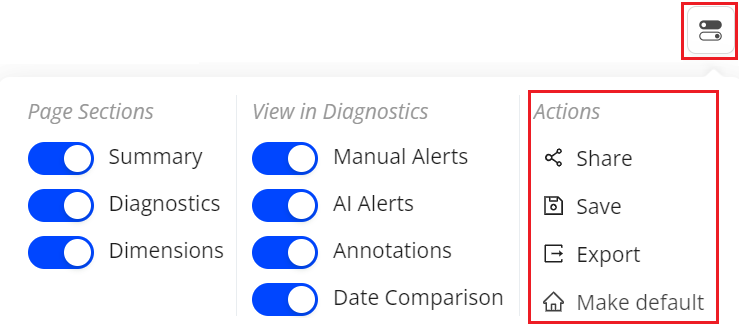
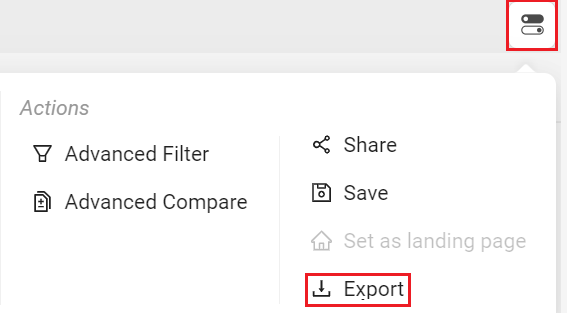
You can also export the data in .csv format using the Export option in the action bar.
Annotations
Mark the anomalies in time series during data analysis in timeseries.
|
Click New Trends: Annotations GIF to watch the short example. |

Annotations allow you to mark the anomalies in the timeseries during the data analysis within the selected time interval in the Trends dashboard and Compare. Also, it enables you to add comments making it a collaboration tool.
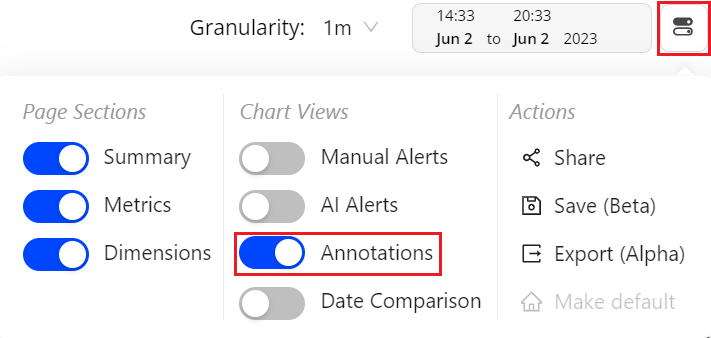
Enable and Disable Annotations
To enable or disable annotations on pulse:
-
Click the Toggle icon and the Annotations toggle icon from the Chart Views column. Enabling annotations makes any added annotations visible on the metric widgets.
Create Annotation
-
Click Annotate on the action bar.
-
Click on the timeline of the desired metric widget to see the annotations popup page.

-
Add the comments and click Add to see the annotations on the selected widget.

For more information on adding custom text to the metric widgets, see Annotations.
Diagnostic Metric Widgets Diagnostic Metric Widgets Diagnostic Metric Widgets