What's New in Video 2022
2022 Releases
December 19, 2022 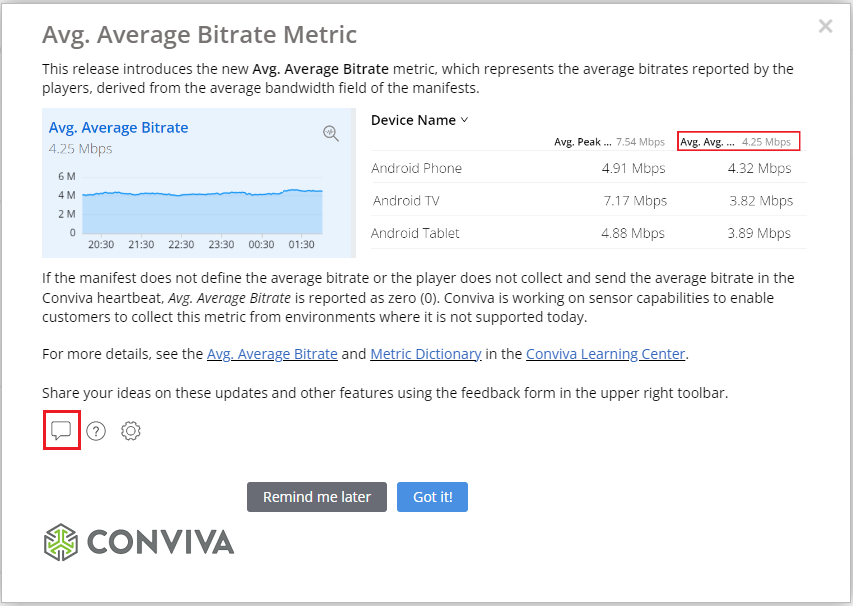
New Metrics: Avg. Average Bitrate

|
Feature Update:
Introduces the new metric called Avg. Average Bitrate which helps you to understand the average bandwidth field of the manifest and represents the time-weighted average bitrates played by the players.
Feature Impact:
This new metric enhances the Viewer Sessions, Timeline, and Viewers with a new column for the new metric Avg. Average Bitrate.
Use Cases:
This metric helps measure the video stream quality. Typically, the higher the bitrate, the better the image quality and viewer experience. You can also compare Avg. Average Bitrate with Average Peak Bitrate to help optimize bitrate encoding.
More Details: Avg. Average Bitrate
December 5, 2022 
Metrics Rename: Average Peak Bitrate

|
Feature Update:
Renames the metric Average Bitrate to Average Peak Bitrate. The Average Peak Bitrate is derived from the bandwidth field of the manifest and represents the time-weighted peak bitrate played by the player.
Feature Impact:
This metric has the label change in Trends, MetricLens, Timeline, Manual Alerts, Real-time, and Viewer Sessions.
Use Cases:
This metric helps measure the video stream quality. Typically, the higher the bitrate, the better the image quality and viewer experience. You can also compare Average Peak Bitrate with Avg. Average Bitrate to help optimize bitrate encoding.
More Details: Average Peak Bitrate
Nov 16, 2022 
New Metircs:Last Playhead Time , Starting Bitrate, and Bitrate Switches
New Feature:Annotations
New Metric: Last Playhead Time

|
New Features:
This metric helps you understand the last play time, after which a pause event occurred in an expired session that did not resume playing. This can help you understand the viewer experience during expired sessions.
Feature Impact:
This new metric enhances the Viewer Sessions, Timeline, and Viewers with a new column for the new metric Last Playhead Time.
This metric is also available in the Viewer API.
Use Cases:
-
The last playhead time helps you understand from where the video must resume after an interruption, such as a long pause.
-
This metric helps you resolve differences between when the viewer stopped watching video, and pause and seek times.
More Details: Last Playhead Time
New Metric: Starting Bitrate

|
New Features:
This metric shows the average starting bitrates received from the profile of the player during the lifetime of the sessions.
Feature Impact:
This new metric is available in the Trends metric selection, time series, and diagnostics. It is also available in Timeline, Viewer Session, MetricLens, Viewer Module with a new column to show the metric value for the ended sessions.
Use Cases:
It is essential to have a higher starting bitrate for a better user experience and engagement based on video quality. This metric helps you measure the video quality and impact on user engagement or completion rates based on the starting bitrate.
More Details: Starting Bitrate
New Metric: Bitrate Switches

|
New Features:
This metric displays the average of the bitrate switches that occurred during video sessions.
Feature Impact:
This new metric is available in the Trends metric selection, time series, and diagnostics. It is also available in Timeline, Viewer Session, MetricLens, Viewer Module with a new column to show the metric value for the ended sessions.
Use Cases:
Bitrate switches enable a better understanding of user experience and engagement based on the delivered video quality and the frequency of bitrate changes. With this metric, you can compare the impact of bitrate changes with user engagement and video completion rates.
More Details: Bitrate Switches
Annotations

|
New Features:
Annotations allow you to mark the anomalies in the timeseries within the selected time interval. Also, it enables you to add comments making it a collaboration tool.
Feature Impact:
This feature is available in Trends dashboard and Compare, for the selected time range with a new option to annotate.
Use Cases:
Annotations help you mark the anomalies, comment on the annotation for further analysis.
More Details: Annotations
October 20, 2022 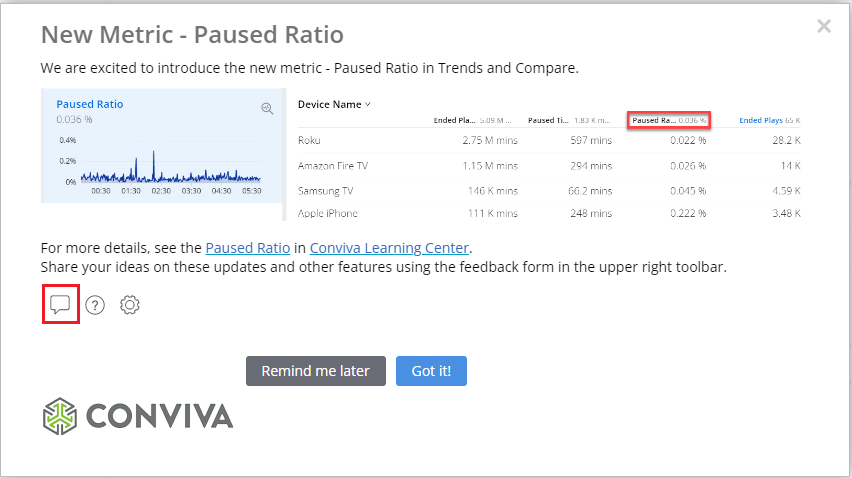
New Metrics: Paused Ratio

|
New Features:
Introduces the new metric called Paused Ratio which is the sum of the pause time with in the selected interval divided by the number end of plays. This metric complements the Paused Time, which measures the paused minutes in viewer sessions.
Feature Impact:
This new metric is available in Trends metric summary and as a selected metric in Trends and Compare.
Use Cases:
Paused Ratio lets you know the frequency of the gaps in continuous viewing, which can help publishers compare advertising opportunities across different cohorts, such as assets (movies vs. episodes), devices (big screen vs. small screen), and browsers, for a given filter like geo/ISP.
More Details: Paused Ratio
October 11, 2022 
New Metrics: Paused Time and Ended Status

|
The new Paused Time metric is available from the metric selections in the Trends page for display as a summary metric time series and as a dimensional metric.

|
The new Ended Status metric is available in the Viewer Sessions display in Diagnostics.
New Features:
Enhances the metric summary and selection in the Trends dashboard with new metric Paused Time. Enhances the viewer session with Ended Status.
Feature Impact:
-
Enables the detailed analysis of the viewer pause time as paused minutes in the viewer session during ended plays.
-
Provides the status of the ended session, if the session was gracefully ended or by expiration.
Use Cases:
-
Analyzing the Paused Time can help the publishers understand the frequency of the viewer pause to make a better decision on the type and length of the advertisements played during the content playback.
-
Ended Status helps to analyze how the session ended—for example, sorting sessions that ended gracefully.
More Details:
Paused Time, and Ended Status in the Metric Dictionary
Enhanced Time Granularity in Trends

|
New Features:
Enhances the Trends dashboard and Compare page with a Granularity drop-down list to select the granularity level for the current display.
Feature Impact:
Enhances the selection of different time granularities for the time period to get a comprehensive view of the timeline.
Use Cases:
-
You can now analyze data with more granularity options, such as yesterday’s data with hourly granularity instead of 1-minute granularity, or three months data with a 30-day granularity instead of 1-day.
-
You can reduce the granularity to avoid spikiness in timings or cohorts of low volume, perform DoD comparisons across 30 days, and perform MoM comparisons across 1 year.
More Details: Time Granularity
August 17, 2022 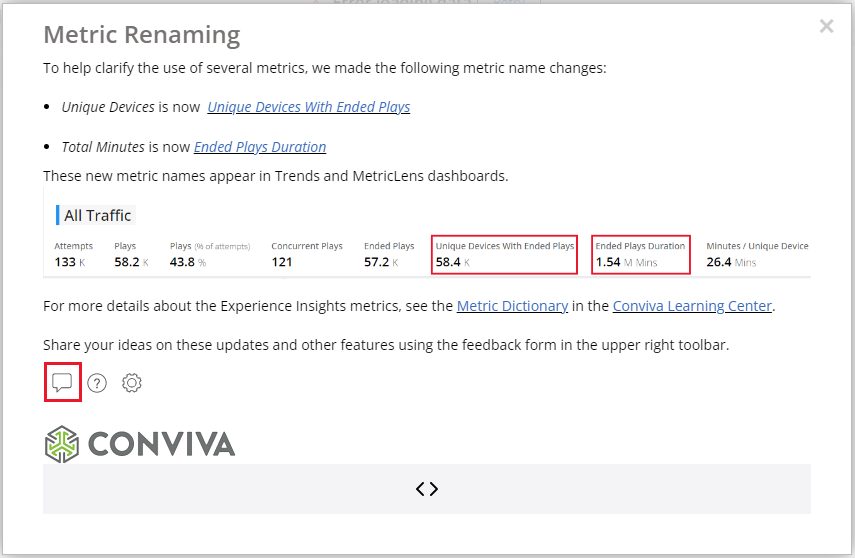
-
Renames the following metrics to clarify the use of the metrics.
-
Unique Devices is renamed to Unique Devices with Ended Plays
-
Total Minutes is renamed to Ended Plays Duration

-
July 28, 2022 
-
Enhances the Compare page with the Open in Trends option to open to a new Trends page for further analysis of the compare dimensions based on the selected metrics.

For more details, see Trends Dashboard.
July 7, 2022 
-
Enhances the metric selection in Trends and other dashboards with easy category selection, such as Startup Experience, Streaming Performance, and Audience and Engagement. The metrics selections now include the streaming performance measurements, such as SPI Streams and Streaming Performance Index.
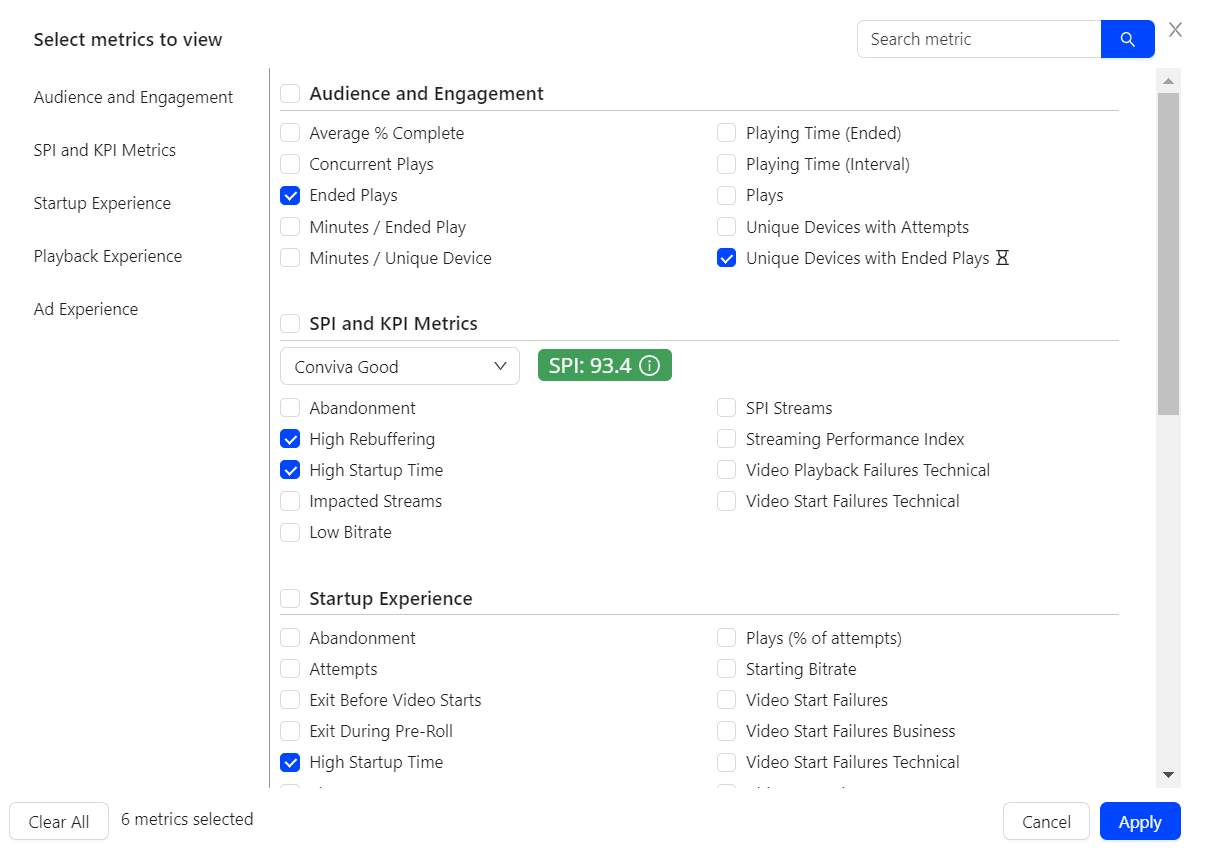
For more details, see Trends Dashboard.
-
Introduces the New App Version in Automatic Insights to compare the performance between new and past releases based on impacted devices and traffic. These insights can help you quickly detect issues with the new app releases.
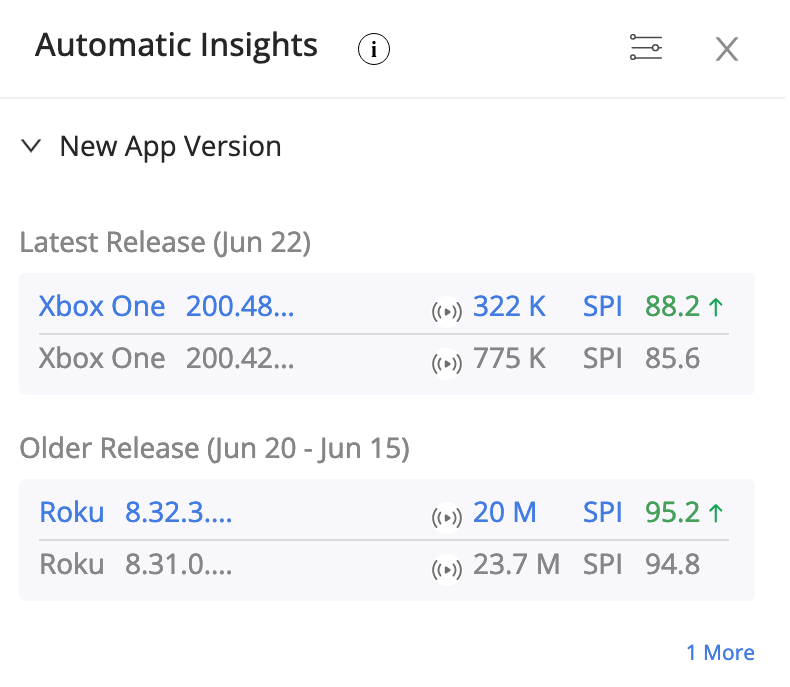
For more details, see Automatic Insights.
-
Enhances the Viewer Module dashboard with a Customize drop-down list , so you can customize the displayed metadata. Additional metadata is available for configured dimensions.
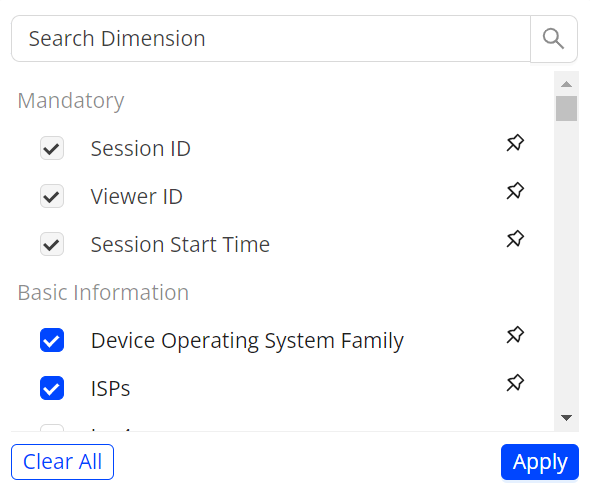
For more details, see Viewer Module Dashboard.
June 16, 2022 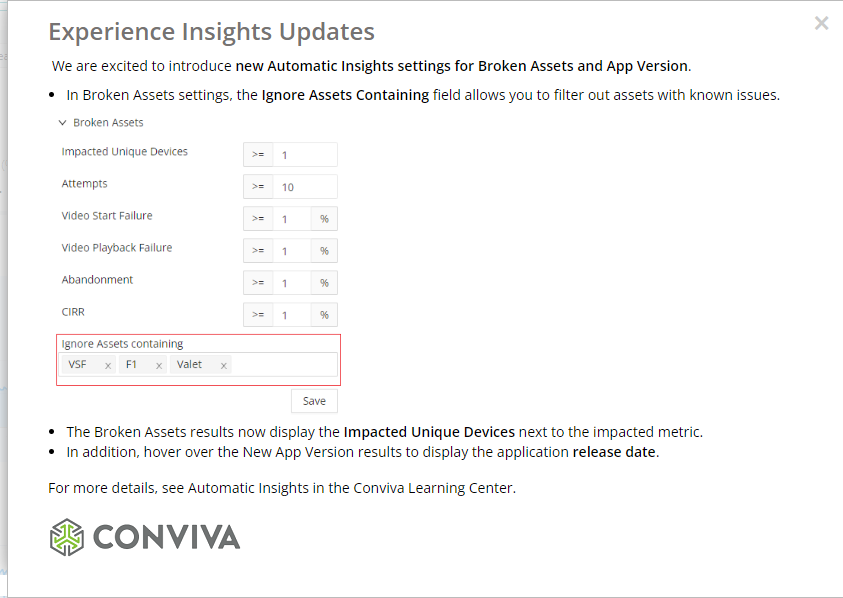
-
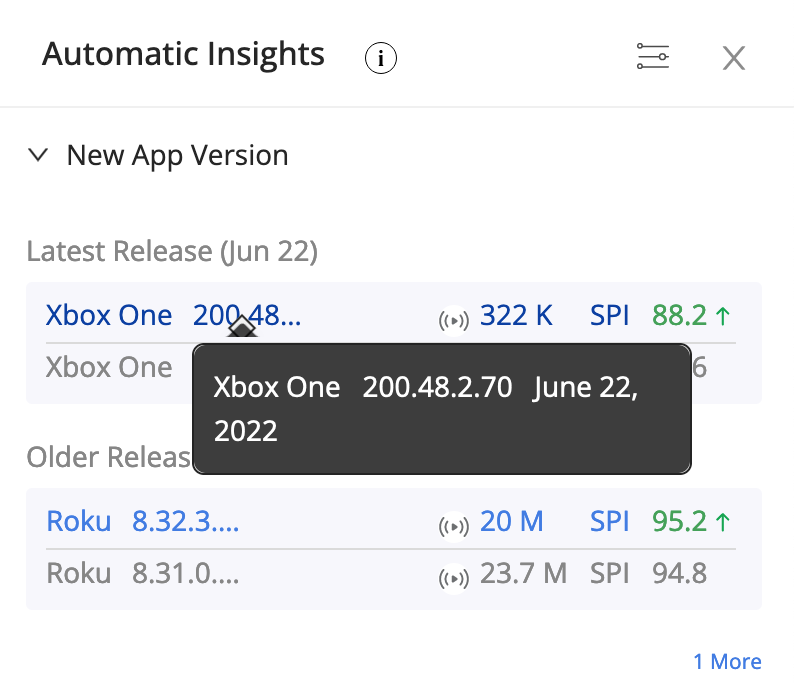
Adds on hover display of the release date to the New App Version entries.
-
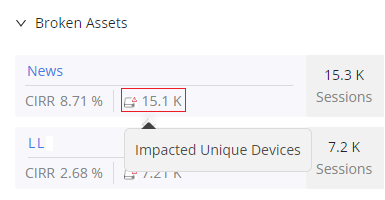
Enhances the Broken Assets result list to display the Impacted Unique Devices number.
-
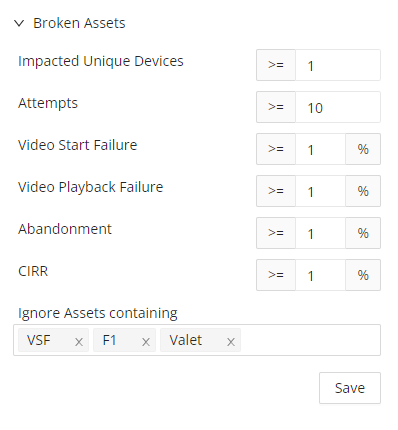
Enhances the Broken Assets setting, with "Ignore Assets containing" field to filter out assets with known issues.
-
Adds the ability to toggle the display data between numbers and percentages in the Compare dashboard when analyzing the new app versions from automatic insights.

For more details, see Automatic Insights.
June 7, 2022 
-
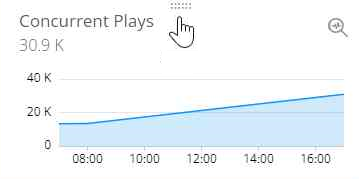
Enables re-positioning of metric tiles in the Trends metric list and Comparisons. Hover over the tile move icon to drag the metric tile to a new location. Metric tiles can be re-positioned to highlight comparisons and improve cross-metric analysis. For more details, see Trends Dashboard.
-
Resolves the Viewer Timeline issue of viewing multiple revived sessions that share the same session ID. For more details, see Viewer Timelines.
May 19, 2022 
-
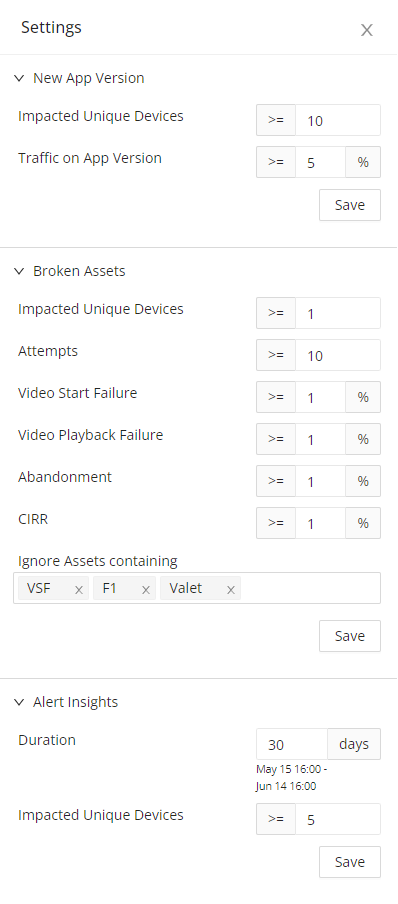
Enhances Automatic Insights with the Broken Assets to trigger insights based on behavior, such as the number of impacted unique devices, play attempts, rebuffering, and failures. Also, adds support for App Version (Beta) to trigger insights based on new version anomalies, such as the number of impacted unique devices and traffic on new apps. For more details, see Automatic Insights.
May 6, 2022 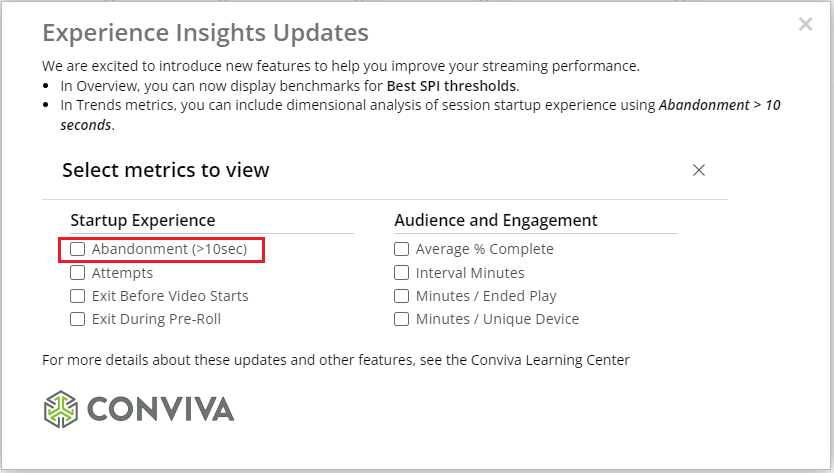
-
Adds benchmarks for Conviva Best performance to the Overview dashboard.
For more details, see Overview dashboard.
-
Adds Abandonment > 10secs as a Startup Experience measure for dimensional analysis in the Trends page.

For more details, see Trends dashboard.
April 21, 2022
-
Enhances the VSIcharting libraries to improve charting performance and enhance visualizations, such as shorter display times, enhanced animations, and better interactivity.
April 7, 2022 
-
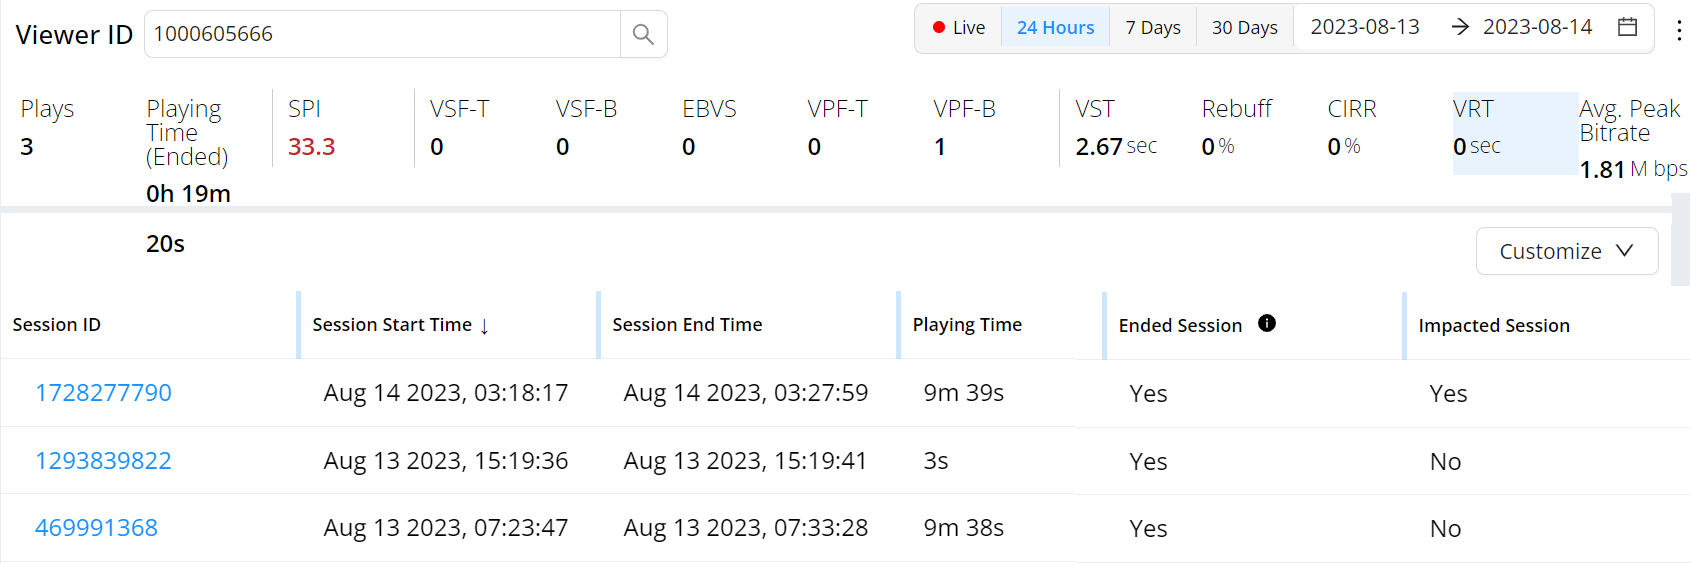
Introduces a new Viewer Module so customer care teams can more quickly display viewer streaming experiences across the sessions watched, with summary, session-level data and metrics. Users can easily determine a viewer's overall stream experience using the number of plays, total minutes watched, session SPI, startup/play failures, rebuffering and average bitrates, while also drilling into the specific timeline performance and diagnostics of each session. For more details, see Viewer Module.
March 10, 2022 
-
Enhances the Executive Email feature to include daily and monthly distribution and improved data. For more details, see Executive Emails.

February 24, 2022 
-
Enhances the Comparison display in Trends to include a summary table of the average metric values for the selected time period. For more details, see Comparisons.
-
Completes support for displaying pages in dark mode with a lighter color palette for UI elements, labels, and values.
Use the Dark Mode toggle in the menu bar to change the display mode.

January 27, 2022 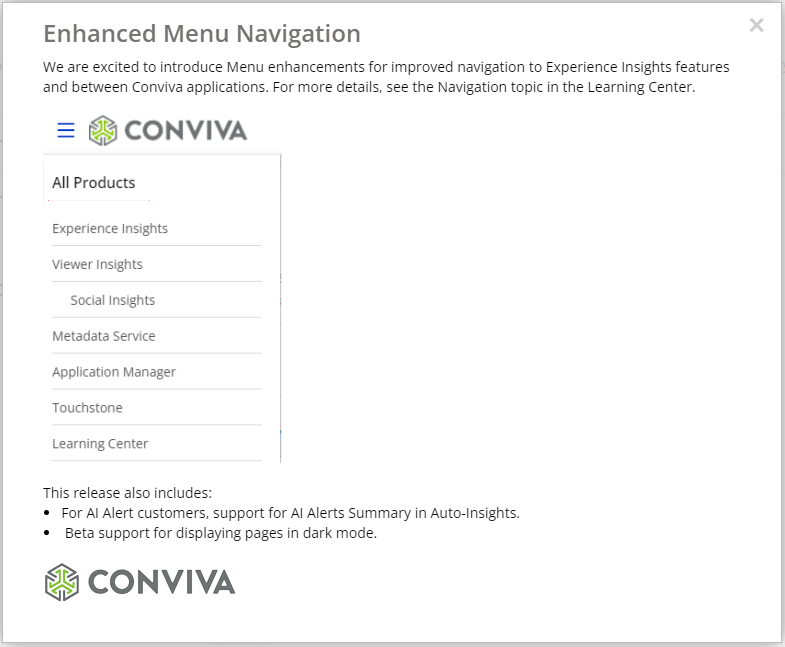
This release introduces an updated application menu for improved navigation to VSI features and between Conviva applications. For more details, see Navigation.
This release also provides support for AI Alerts Summary in Auto-Insights for Conviva Video AI Alert customers.
Note: Beta support for displaying pages in dark mode is also available.
January 13, 2022 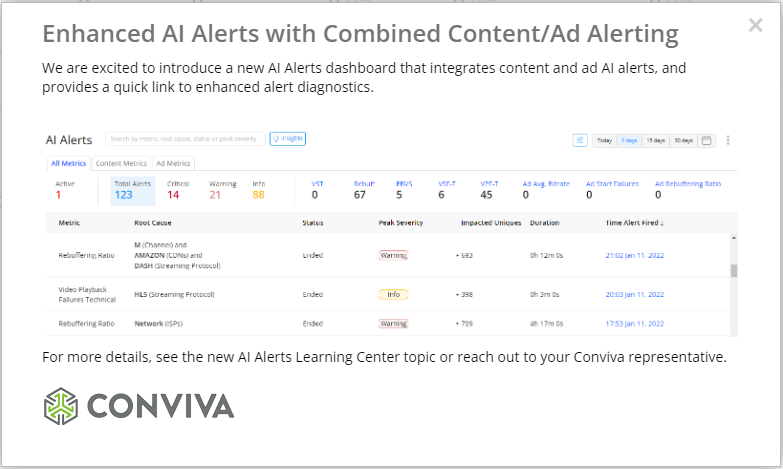
This release introduces a new AI Alerts dashboard that integrates content and ad AI alerts and provides a quick link to enhanced alert diagnostics.

