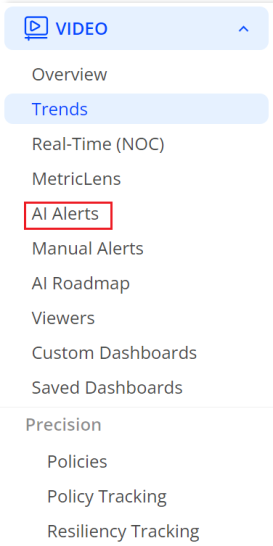
The AI Alerts feature offers proactive anomaly detection and instant alerts to help shorten time to resolution. This advanced feature eliminates the need to determine the thresholds, identify the relevant dimensions that you need to monitor, and set alerts to notify related individuals and groups.
The Conviva AI Alerting system is continuously checking for anomalies across video content and ads, and computes a baseline along with a range of variation for the metric(s) based on the mean and standard deviation derived from historical data. This range of variation is then used to evaluate the traffic in the past few minutes. If the range is exceeded, an anomaly is detected, which then triggers the diagnosis process to determine if an alert should be fired based on the sensitivity control settings and the root cause of the event.
Note: Each AI alert cohort requires an on-going minimum of 25 attempts, concurrent plays, or ended plays during each 1-minute interval to qualify for alerting based on the AI alert sensitivity settings.
For each generated alert, the system provides the sessions that attributed to the dimensions (or set of dimensions) associated with the root cause of the alerts and the views that were impacted due to the alert.
Each AI alert is assigned an alert severity (Info, Warning, Critical) that can help you determine the impact of alert condition. By default, all alerts fire with the Info severity until the thresholds for Warning and Critical are set. As alerts fire, the AI Alerts page displays the alerts totals for each severity level and related metric, and continuously updates the totals as the alert conditions change. When an alert condition returns to the accepted range of variation and sensitivity control limits, the AI alert ends and is listed in the Alert Ended totals to indicate that the alert condition cleared. The specific threshold for each severity level is configured in the sensitivity controls. For more details on setting the sensitivity controls, see AI Alert Sensitivity.
The alert totals show the alerts for the last 30 days.
This topic includes the following sections:
This feature offers automatic anomaly detection and fault isolation across the following key metrics and key dimensions:
| Content AI Alerts | Ad AI Alerts | ||
|
Content Metrics
|
Content Dimensions (Root-cause)
|
Ad Dimensions Ad System OS Family Player Name |
Ad Metrics
|
AI Alerts fired for the regional ISP and city dimensions improve your ability to diagnose root cause analysis, for example tracing the root cause to a specific regional ISP and city rather than only the DMA group. As a result, you can see alerts associated with root causes from city only; regional ISP only; regional ISP and city; CDN and regional ISP; and CDN, regional ISP, and city. The DMA group dimension is no longer supported.
The Channel and Streaming Protocol dimensions support the following root cause combinations:
-
CDN: Channel: Protocol
-
CDN: Channel
-
CDN: Protocol
-
Channel: Protocol
-
Channel
-
Protocol
For a detailed definition of these metrics, see the Metric Dictionary.
Viewing AI Alerts List
To view the AI Alerts summary page:

-
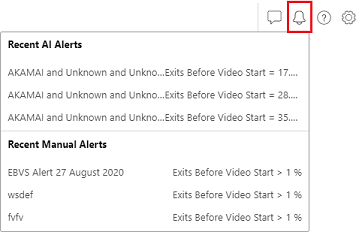
Click on the Alert Bell in the menu and click an AI alert to display the AI alert summary.
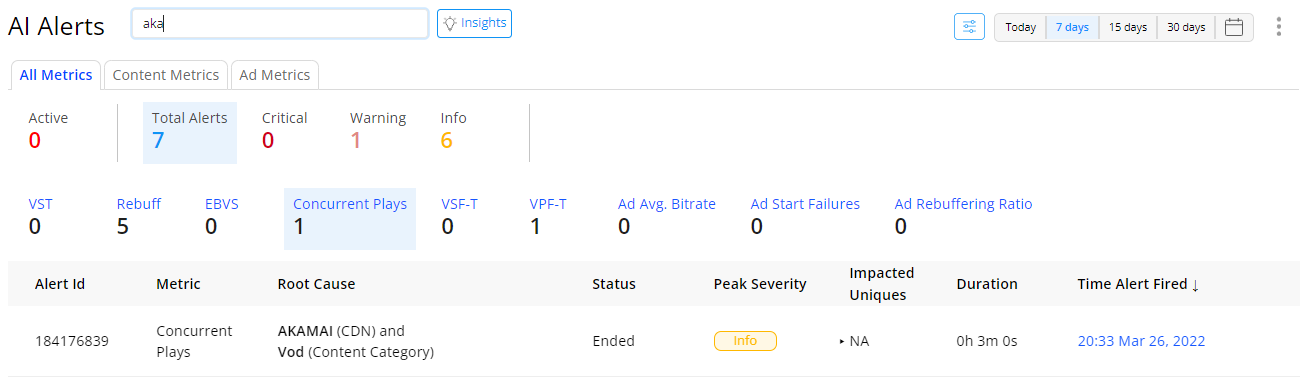
The AI Alerts page shows the total number of active and fired alerts along with the alert totals by severity level and metric for up to the last 30 days.
Click a severity level or metric total to filter the alert display for that combination of severity and metric. For example, filter alerts for specific severity levels (Critical) and metrics (VPF-T).
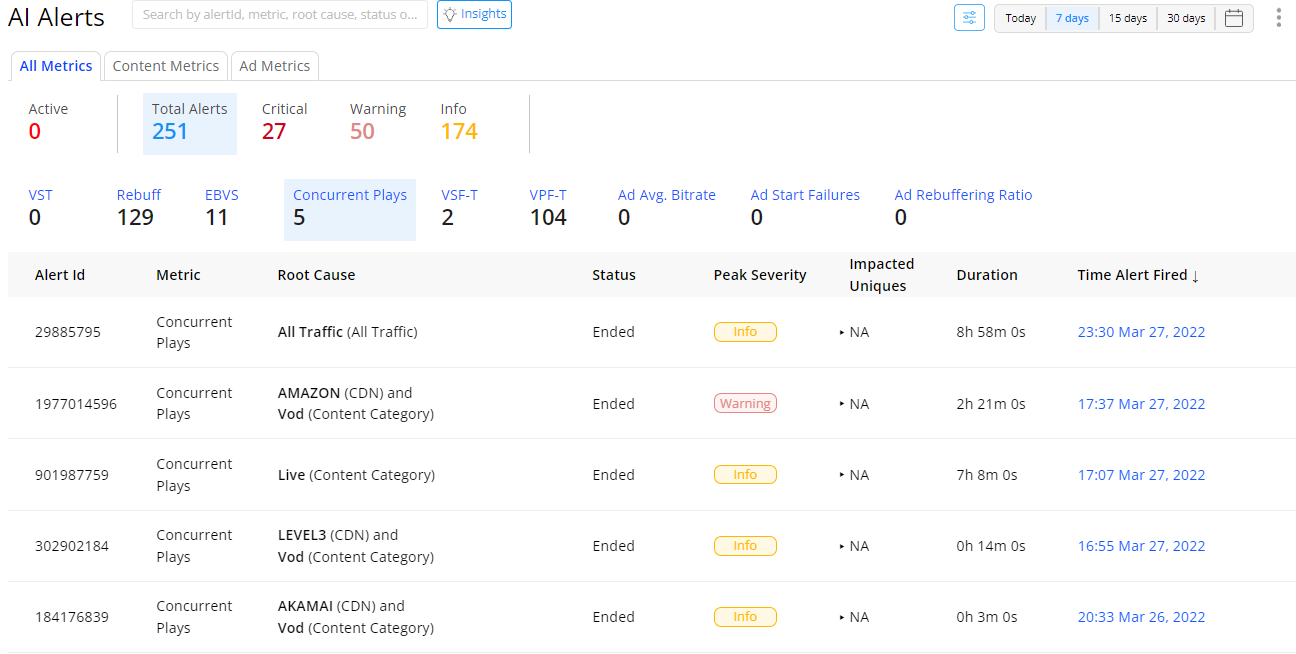
Each Content AI alert instance provides following AI alert information:
-
Customer: For CDN Partners, displays the customer impacted by the alert.
-
Account: Name of the account impacted by the alert.
-
Metrics: Name of the metric for which the AI alert fired.
-
Metric value: Metric value that caused the AI alert to fire.
-
Root cause: Dimension(s) that caused the AI alert to fire.
-
Status: Current state of the AI alert, for example 'Ended'.
-
Peak Severity: The highest severity level that occurred while the AI alert was active-- Critical, Warning, Info.
-
Impacted Devices: The cumulative total of devices impacted by the issue at the time the AI alert fired.
-
Duration: The amount of time the alert was active.
-
Time alert fired: Date and time that the AI alert fired, linked to the detailed Diagnostics page for the alert. When an alert ends, the alert status changes to ended.
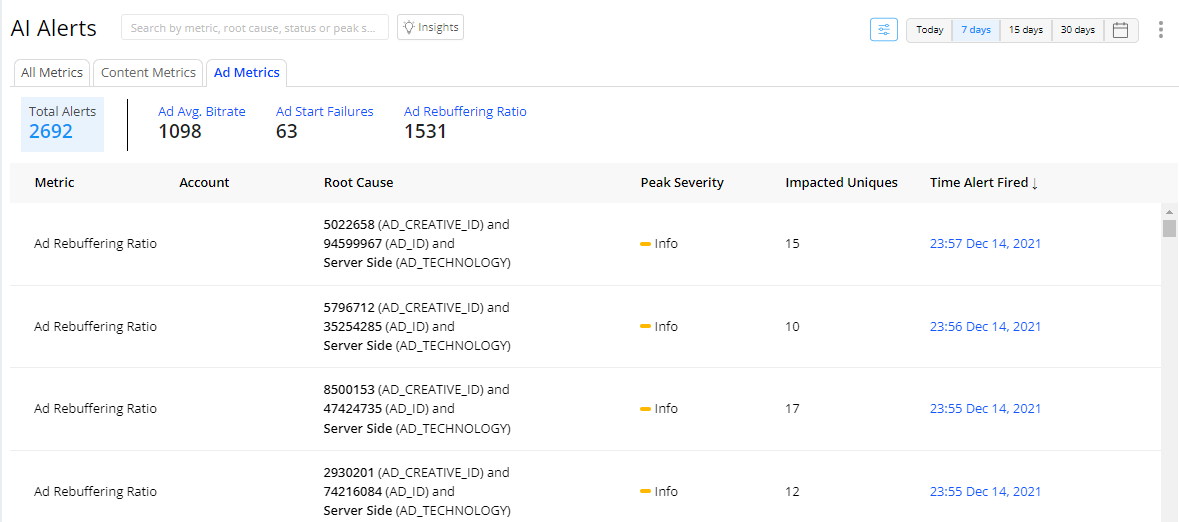
Each Ad AI alert instance provides following AI alert information:
- Metrics: Name of the metric for which the AI alert was fired.
- Metric value: Metric value that caused the AI alert.
- Ad ID, Creative ID: The IDs of the ad and ad creative that caused the ad AI alert.
- Impacted Uniques: The cumulative total of devices impacted by the issue at the time the ad AI alert was fired.
- Time alert fired: Date and time that the AI alert was generated, linked to the detailed Diagnostics page for the alert.
Click the Insights button for Automatic Insights options. Click the Settings icon for AI alert setup.

For details on AI alert sensitivity settings, see AI Alert Sensitivity.
By default, the alert instances are sorted by time the alert fired, with the most recent instances at the top. You can also customize the alert display by clicking on a column name, severity level summary or metric summary.
As the AI alert conditions change, the alert severity updates to show the latest severity level. When an alert condition returns to the accepted range of variation and sensitivity control limits, the AI alert ends and is listed in the Alert Ended totals to indicate that the alert condition cleared.
Click an alert to toggle the alert history and display the previous alert states.
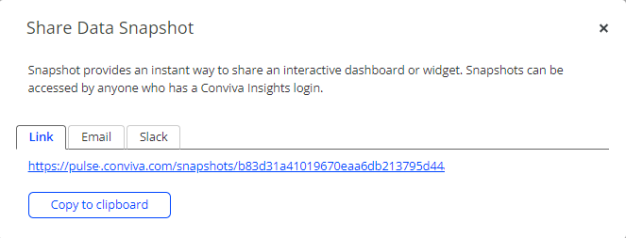
Share and export AI alert data using the kebab options.
Sharing allows to quickly copy, email, or Slack the page link.
Export outputs the displayed data to a CSV file.
For more details see, Sharing Data and Exporting Data.
Root Cause Analysis
Diagnosing an AI alert starts with examining the information in the initial AI alert message and interpreting the dimensions in the alert title, and then, if necessary, inspecting the diagnostic details of the alert to determine if the root cause of the alert can be further isolated to a specific player, operating system, or browser. In the case of alerts with only a CDN or Asset as the root cause, no further diagnosis is required to determine this type of root cause. However in other cases, further diagnosis, such as narrowing OS, browser, and player levels, or analyzing the time series, can often help to narrow the root cause and troubleshoot the progression of the alert condition.
For each generated AI alert, the system displays the dimensions attributed to the root cause, and for further analysis provides a diagnostic time series of the metric variations leading up to the alert firing and continuing past the end of the alert. The AI alert system also displays a list of sessions that were impacted due to the alert and the device metadata associated with sessions to help you further isolate the root cause levels.
Issue Convergence
AI alerts that fire within several minutes of each other for the same metric are possibly related to the same root cause. As an alert condition progresses, the AI alert system performs continuous fault isolation and root cause analysis to detect if the initial dimensions have converged to further isolate the source of the alert. In the example below, after the initial Video Startup Time AI alert fired on August 1st at 02:57 with the root cause dimensions of Roku and Live, another Video Startup Time AI alert fired two minutes later at 02:59 with more impacted unique devices, as the root cause dimension converged to only Live traffic. This convergence indicates that within several minutes the AI alert system determined that the initial Video Startup Time alert that was not limited to Roku players and Live traffic, but was isolated to all players with Live traffic.
Initial AI Alert: Roku Live
Converged AI Alert: Live

AI alert convergence may take up to several minutes depending on the complexity of the AI alert condition and scope of the impact across OTT system levels. When initially interpreting an AI alert, check for neighboring alerts to determine if alerts have converged. If convergence occurred, use the latest alert and root cause for further diagnosis.
Searching AI Alerts
The AI Alerts page allows you to perform searches by the Root Cause, Metrics and Time Alert Fired fields.
To search the alerts:
Select the desired date range.
Type a search term such as iPHone or AKAMAI in the search box, followed by the Enter key.
To clear your search and see all alerts diagnostics again, clear the search box and press the Enter key.
Note: If your search yields no results, click the search box and press the Enter key. This will re-populate the list with all alerts.
Viewing Content AI Alerts Diagnostics
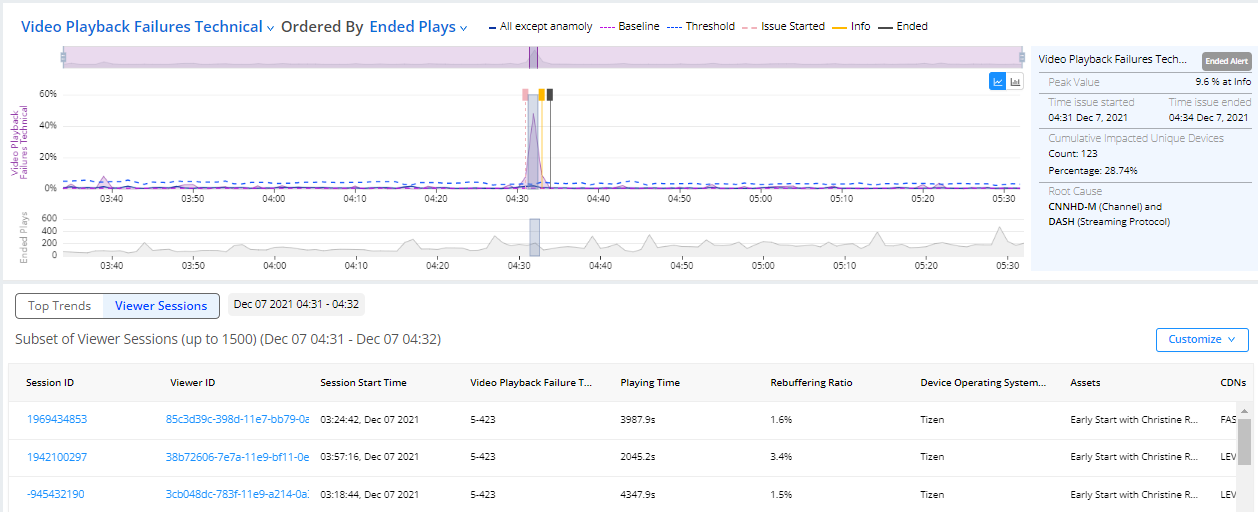
The AI alerts diagnostic page enables you to drill into the alert details with a data snapshot at the time the alert fired, a times series chart depicting the alert firing sequence expanded to one-minute intervals, and data illustrating the alert conditions, such as metric baseline and range of metric variance. When available, a second time series is shown for a related metric.
To diagnose an AI alert from the Diagnostics page, click the Time Alert Fired column for one of the alerts. The Diagnostics page appears with the alert details.
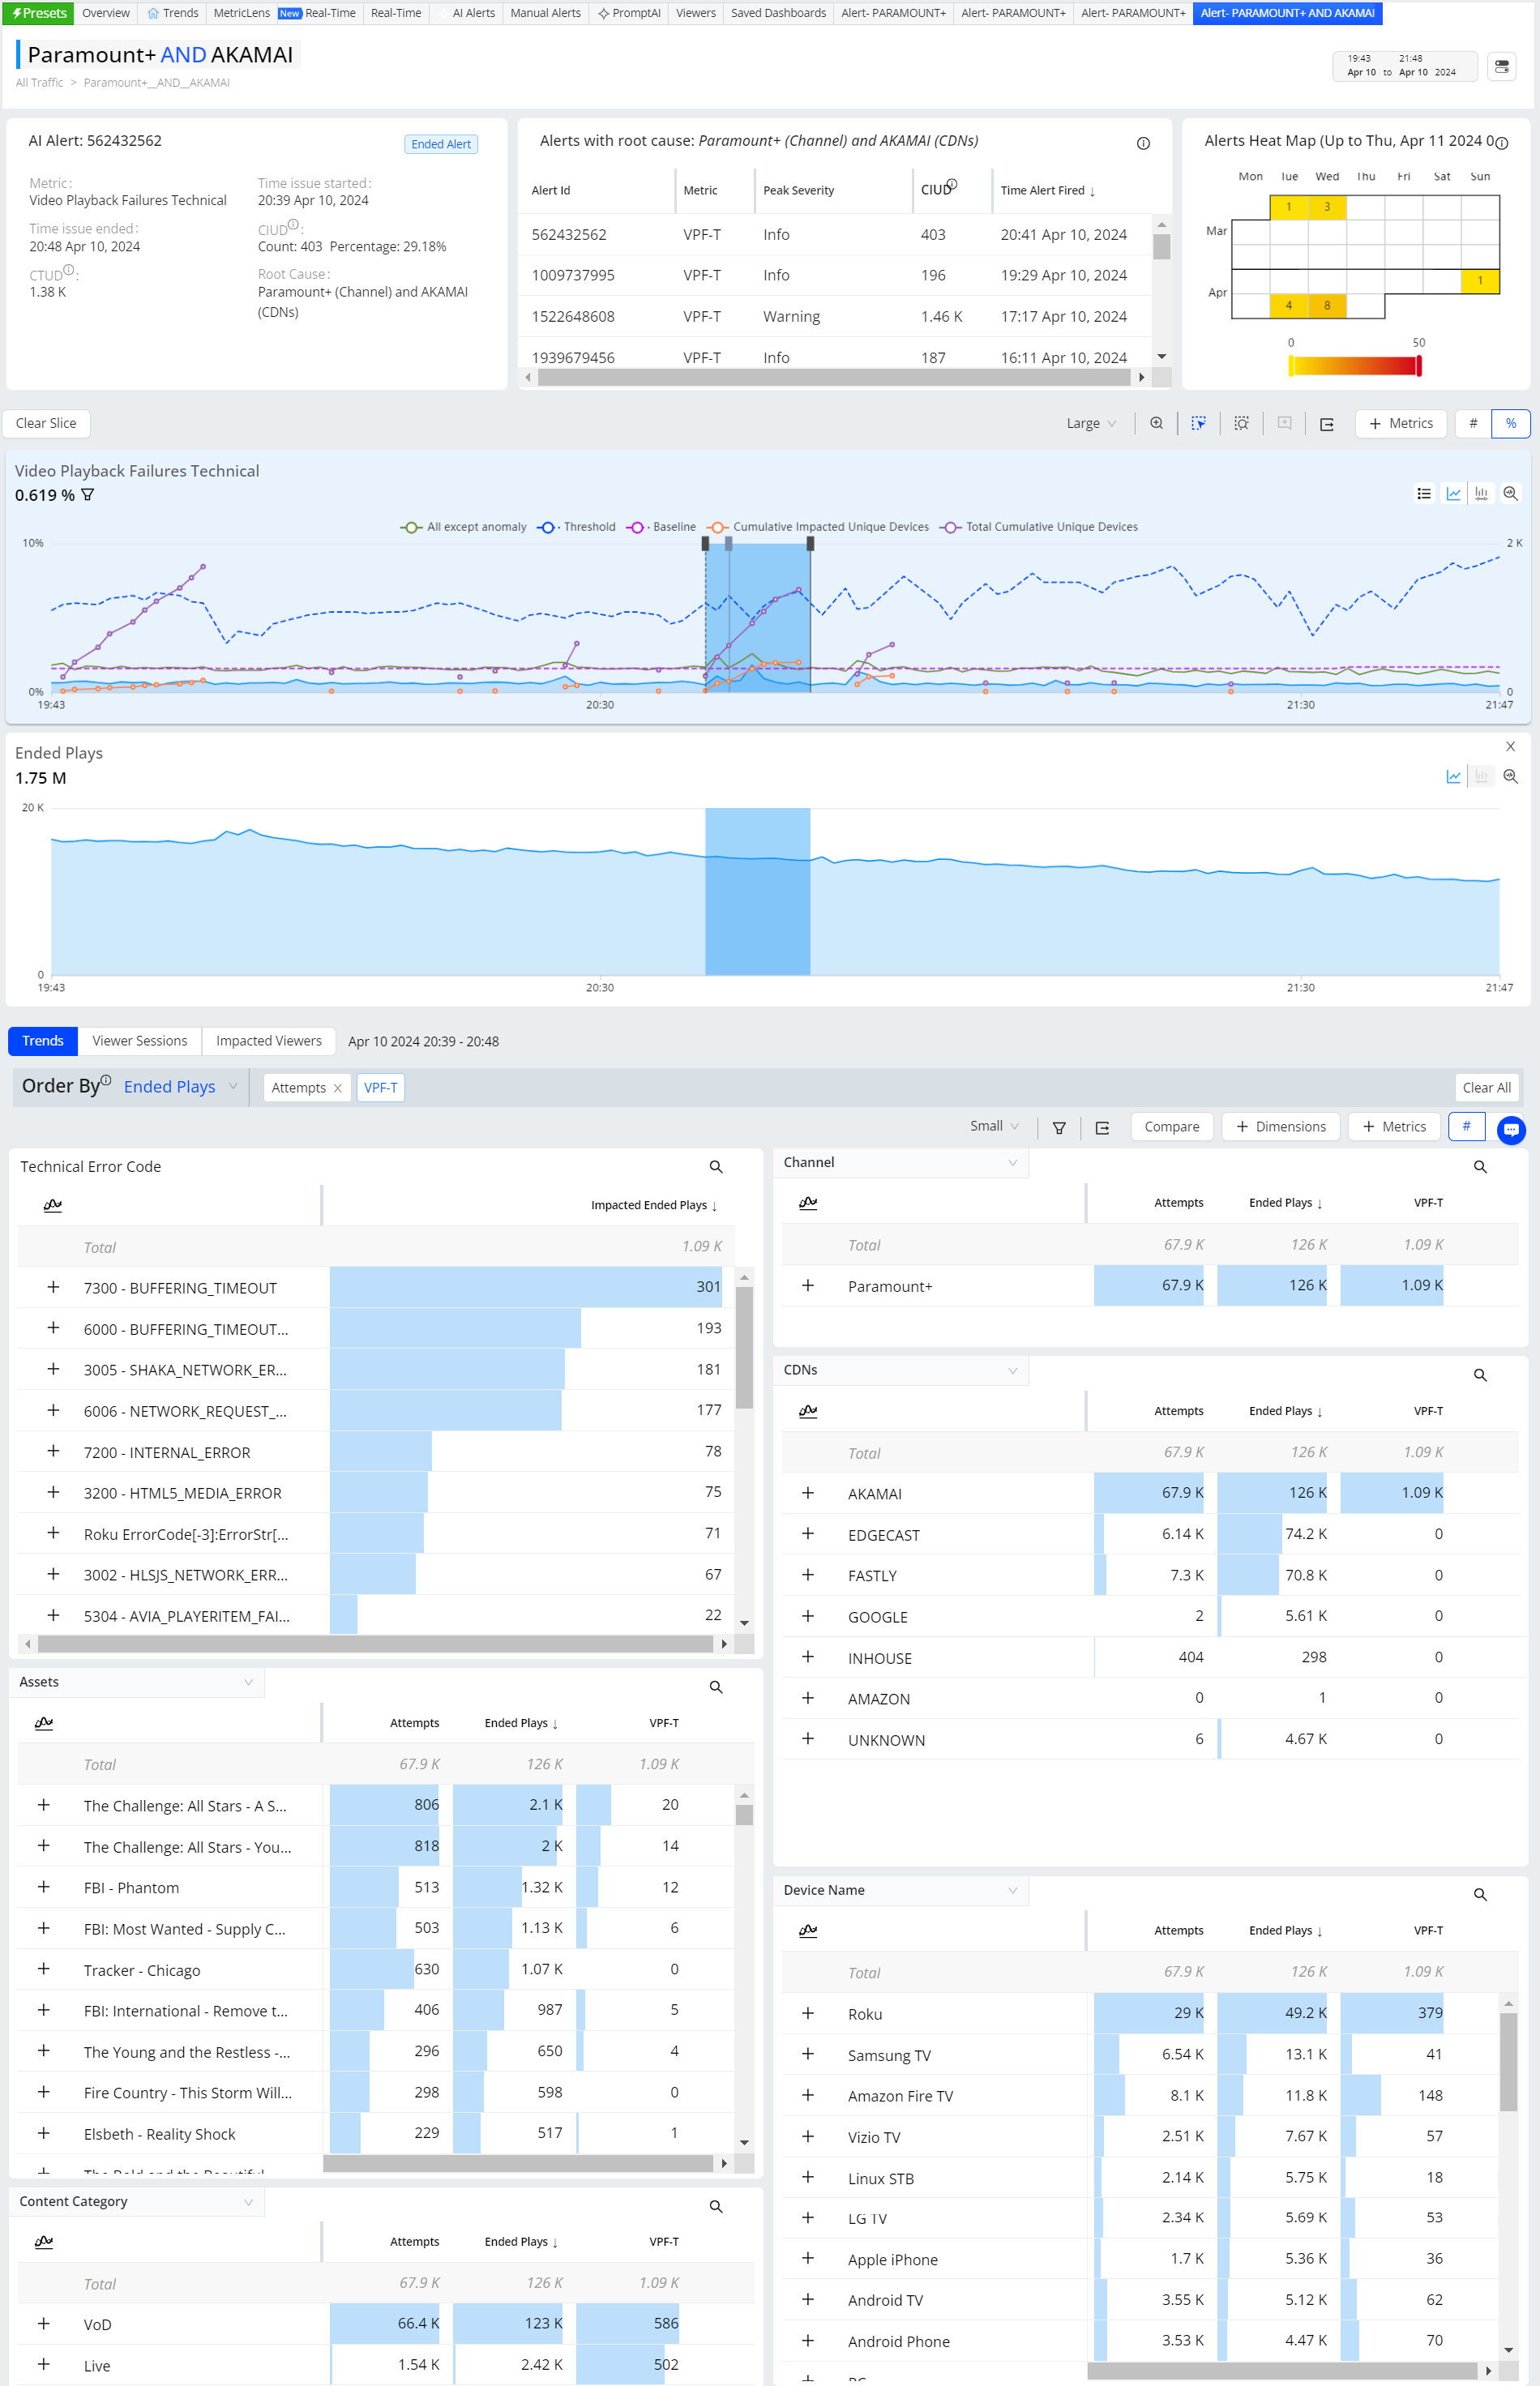
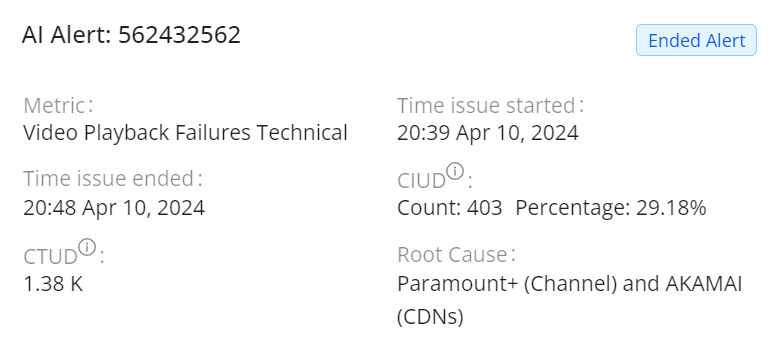
The Data snapshot section displays data at the time the alert fired:
-
Average metric value and severity or status
-
Time issue started
-
Time the AI fired
-
Cumulative number of impacted unique devices
-
Root cause of the alert
Because this data is a snapshot at the time the alert fired, the metric value, severity, and snapshot data do not reflect any subsequently impacted sessions. The AI alert percentage is the percentage of sessions within the root cause group that were impacted by the alert. For example, in the sample data snapshot, a Video Playback Failures Tecnical percentage of 28.74% indicates that 28.74% of all the sessions using this channel and DASH protocol (the root cause group) were impacted.
Time series of the metric that caused the alert to fire, with one minute data intervals for a two hour window, and severity-colored vertical bars showing the time when the alert reached each severity level. Drag the timestamps at the ends of the time series to zoom in on a more granular time period.
-
The horizontal purple dashed line shows the typical value for the metric, based on over 40 hours of recent historical data captured during normal conditions.
-
The horizontal blue dashed line shows the threshold for the metric. Values within the dashed lines are considered normal variation, based on recent historical data. A deviation outside the range is considered abnormal and may lead to an alert being fired if the sensitivity conditions are met.
-
The vertical pink dashed lines indicate when the issued started.
-
The solid red (critical) line indicates when the AI alert fired.
-
The solid black line indictates when the AI alert ended.
Use the time sliders to zoom in and out of the time series to display the progression of the alert.
Hover over the time series to display detailed data at a specific 1-minute interval, such as the threshold value and number of impacted unique devices, with the respective totals within the AI alert dimension group:
-
Impacted Unique Devices: the unique devices impacted in the current interval.
-
Total Unique Devices: the unique devices in the current interval.
-
Cumulative Impacted Unique Devices: the unique devices impacted from when the issue started.
-
Cumulative Total Unique Device: the total unique devices from when the issue started.
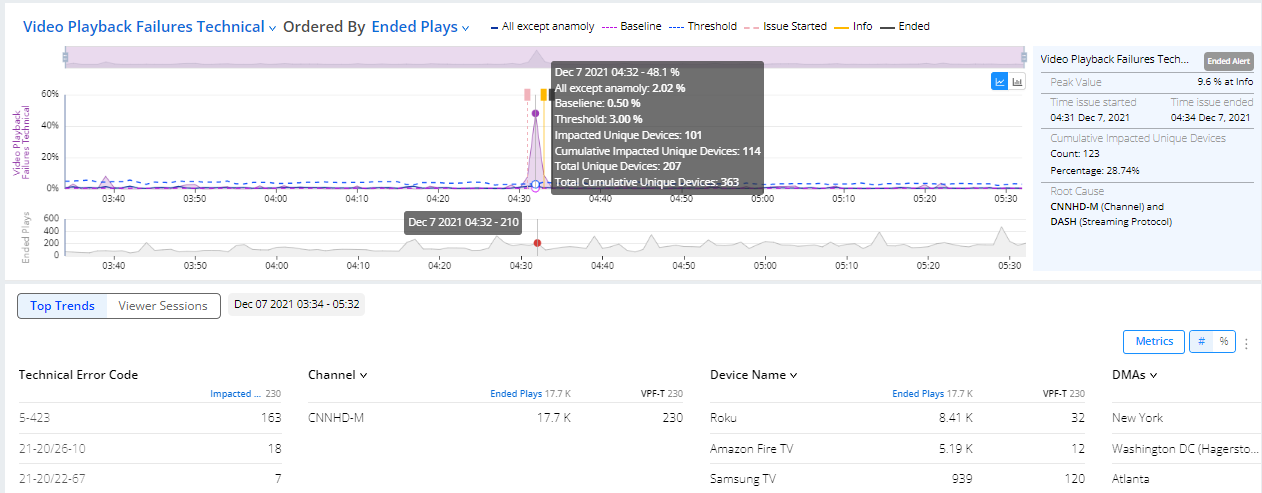
Impacted unique devices are counted inclusively during each interval. As a result, the same unique device may be impacted in different intervals and therefore counted as an impacted device in each of those intervals, while it is only added to the Cumulative Impacted Unique Devices total in the first interval of impacted.
Impacted Dimensions and Sessions
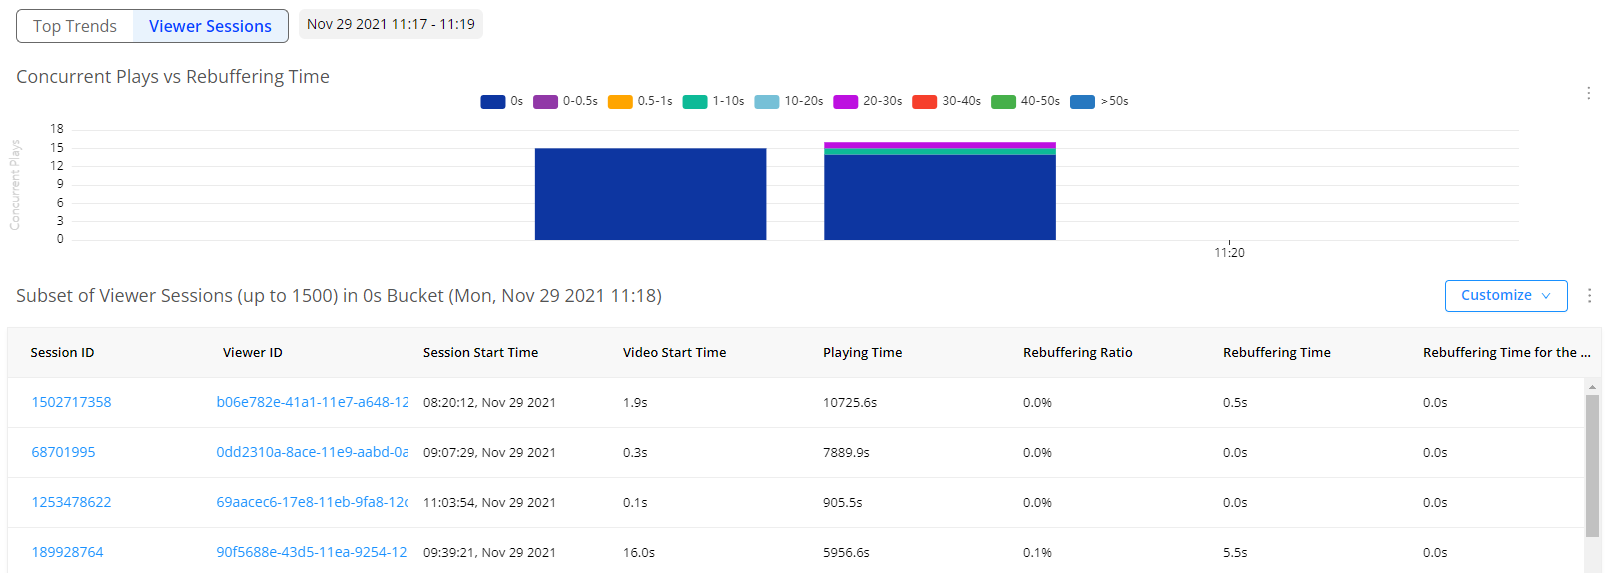
The Diagnostics page also shows a list of up to 500 sessions that were impacted by the detected issue.
The system starts to compute impacted sessions for an alert as early as several minutes before the alert is fired. At each minute, the system computes all the sessions that are considered impacted within that minute and appends those sessions to the list of impacted sessions. This process repeats each minute until the total number of impacted sessions exceeds 500 or the detected anomaly ends.
The criteria for a session being impacted are defined per metric. For VSF-T alerts, all the VSF-T sessions are considered impacted. Similarly, all the EBVS sessions are considered impacted for EBVS alerts. For Rebuffering Ratio and VST alerts, only the sessions whose corresponding metrics are higher than the expected variances are considered impacted, and only the most impacted ones are picked if there are more than 500 impacted sessions within a minute.
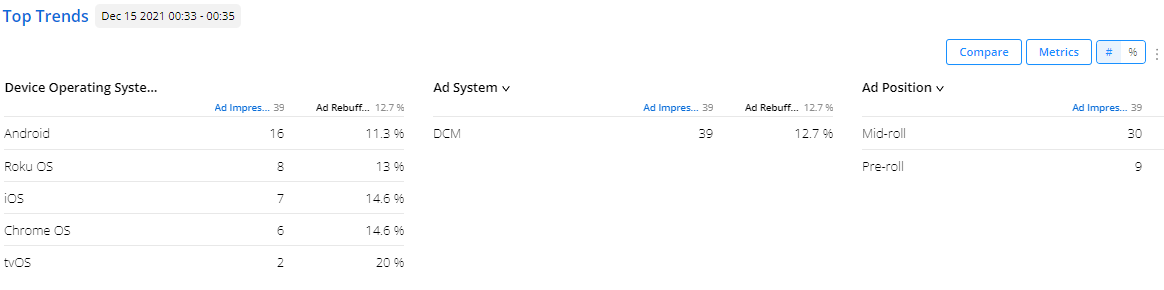
For additional details, select a time interval in the time series and in Top Trends select dimensions to analyze dimensional impacts of the alert.
For additional impact diagnosis:
-
Click the Session ID to open the Viewer Timeline.
-
Click the Viewer ID to open the Viewers details.
For some metrics, such as Rebuffering Ratio, from Viewer Sessions, use the distribution buckets to filter impact on individual sessions.
Viewing Ad AI Alerts Diagnostics
The Ad AI alerts diagnostic page enables you to drill into the ad AI alert details with a data snapshot at the time the alert fired and a times series chart depicting the alert firing sequence expanded to one-minute intervals.
To diagnose an Ad AI alert from the Diagnostics page, click the Time Alert Fired column for one of the alerts. The Diagnostics page appears with the details of the alert.
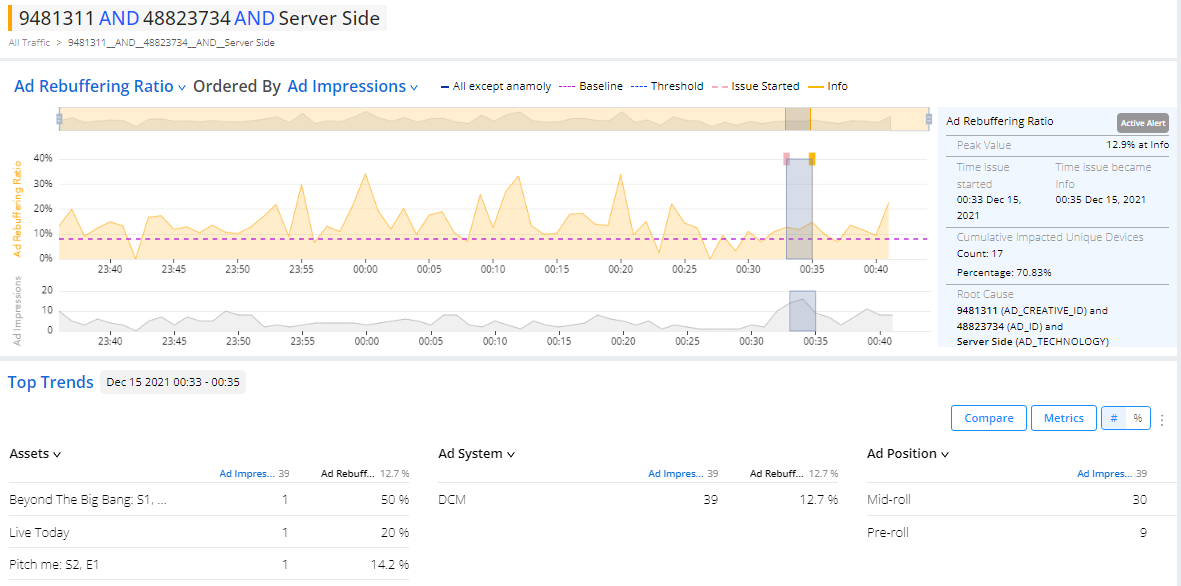
The Data snapshot section displays data for the time the alert fired:
- Metric value time series
- Time issue started
- Time the ad AI alert fired
- Cumulative number of impacted unique devices
- Root cause dimensions
Because this data is a snapshot at the time the alert fired, the metric value and snapshot data do not reflect any subsequently impacted sessions or devices.
The time series displays the details of the alert progression and updates based on alert changes.
- The horizontal dashed blue line shows the threshold value for the metric.
- The horizontal dashed purple line shows the baseline value for the metric.
- The solid blue chart line shows the metric value that is not part of the anamoly.
- The solid pink vertical capped-line shows the time the metric value exceeded the threshold, issue start.
- The solid orange vertical capped-line shows the time the ad AI alert fired.
Hover over the alert markers to display more details.
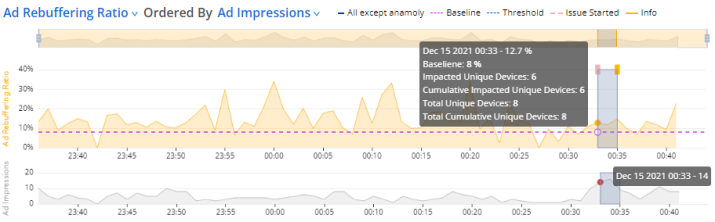
Note: It is common that the Issue Started vertical bar shown in the time series appears up to several minutes before or after the time the metric crosses the set threshold (dotted blue line). The ad AI alert system uses statistical models to deduce the probability of the started issue significance, which can impact the issue start times.
Impacted unique devices are counted inclusively during each interval. As a result, the same unique device may be impacted in different intervals and therefore counted as an impacted device in each of those intervals, but is only added to the Cumulative Impacted Unique Devices total in the first interval of impacted.
Use the dimension drill-downs to correlate performance across video stream and ad dimensions, such as device operating systems, ad systems, and ad position.
Viewing AI Alerts List
To view the AI Alerts summary page:
-
Log in to Conviva VSI and select AI Alerts in the VSI feature selection
Or
-
Click on the Alert Bell in the menu and click an AI alert to display the AI alert summary.
Each alert instance provides following information for each AI alert fired for a metric:
-
Metric value: Metric values that caused the AI alert to fire.
-
Root cause: Dimension(s) that caused the AI alert to fire.
-
Cumulative Impacted Unique Devices: The cumulative total of devices impacted by the issue at the time the AI alert fired.
-
Time alert fired: Date and time that the AI alert fired, linked to the detailed Diagnostics page for the alert.
By default, the instances are sorted by time the alerts fired, with the most recent instances at the top. You can also toggle the display order by clicking on a column name.
Searching AI Alerts
The AI Alerts page allows you to perform searches by the Root Cause, Metrics and Time Alert Fired fields.
-
Type a search term such as Video Startup Time in the search box, followed by the Enter key.
-
To clear your search and see all alerts diagnostics again, clear the search box and press the Enter key.
Note: If your search yields no results, click the search box and press the Enter key. This will re-populate the list with all alerts.
AI Alert Email Subscription
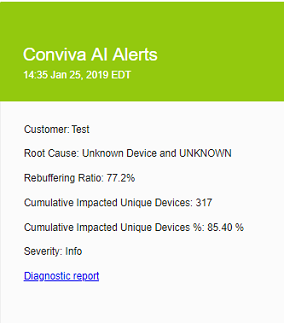
Once an alert is fired, an email is immediately sent to the subscribed users. Individual users can subscribe to AI alert emails by selecting specific metrics or all available metrics. The system guarantees that an email is sent to each recipient within 10 seconds after an issue is detected. Within the alert email, an alert summary is provided, which includes the metric, the root cause of the issue, and the number of impacted sessions.
Note: There may be a potential delay of up to 6 to 10 minutes between issue occurrence and alert notifications.
To subscribe to AI alert email notifications:
In the Settings menu, click the Notifications menu and select the AI Alerts Email Subscription tab to open the AI Alerts Email Subscription settings.
The AI Alerts Email Subscription page appears with a list of the subscribed email addresses.
Click Subscribe to select individual metrics (or Select all metrics) and severity levels for alert notifications. Click Update to start to receive notifications. Otherwise, click Cancel.
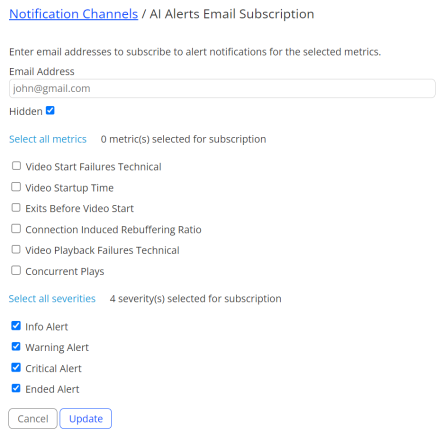
To update an existing user's settings, hover over a current user email and select the Edit option.
Once you receive the AI alert email, click the Diagnostic Report link to view details about why the alert was fired and the impact of the issue.
Note: The AI alert email subscription settings do not impact the manual alert settings. For manual alert settings, see Alerts.
Webhook Integrations
Admin users can also set webhooks to integrate Conviva AI alerts into external applications, such as JIRA or other support ticket applications.
To setup webhooks, see Setting Webhook Notifications.