Viewer Timelines enable you to drill-down into session timelines for comprehensive and granular analysis of a session, including session performance details, QoE metric performance, session events, session state changes, and related session metadata. The timelines display the streaming events and player state changes that occur from session start to session end, with the ability to drill-down into second-level streaming behaviors, such as analyzing a session that plays for only several seconds and then fails after experiencing rebuffering, verifying the timing of CDN and bitrate switches throughout the session, or diagnosing rebuffering that repeats throughout a play.
Each timeline page provides:
-
session data
-
session overview timeline
-
timelines for session details
Note: Viewer Timeline data is retained for up to 7 days. For additional data requirements, reach out to your Conviva representative.
To display and analyze a session timeline, click a highlighted viewer session ID in the Viewer Sessions page. The Viewer Timeline page appears with the session data, QoE metrics, and metadata along with Session Overview and Session Details timelines.
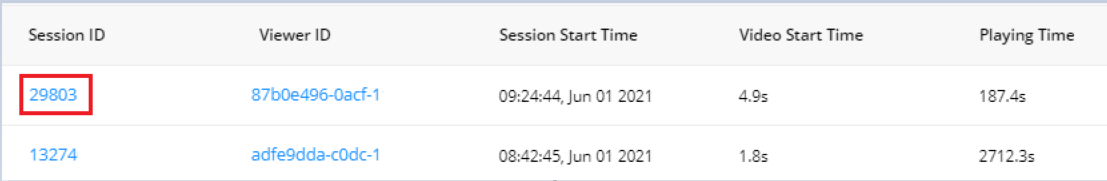
Note: To open the Viewer Sessions page, select a interval up to 24 hours in the Diagnostics time series and from the Viewer Session tab select Viewer Sessions.
Session Data
Session data includes quality metrics along with device, player and content metadata. Use the Show Details/Hide Details link to toggle the session data display.

Session Overview Timeline
An overview timeline illustrates the entire session for quick high-level analysis with the ability to zoom in to specific periods of the session and analyze up to the second behaviors in detailed timelines. This example illustrates a session that starts with buffering, briefly plays, then rebuffers and ends with a VPF.
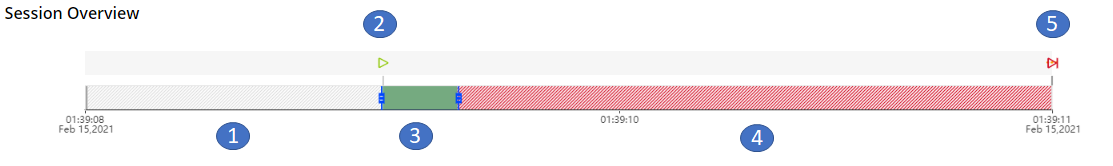
Event and Player States:
1. Buffering state
2. Play event
3. Play state
4. Rebuffering state
5. VPF event
Use the session timeline handles in the Session Overview timeline to adjust the portion of the session displayed in the detailed timelines, for example highlighting short period of rebuffering.

Move either handle horizontally to adjust the displayed portion of the session. Click and drag within the selection portion of the session to move the selected range within the session.
Click the kebab icon in the upper right corner to save, share, and export current viewer timelines and data.
Detailed Timelines
Detailed timelines display events and player states during the period selected in the Session Overview timeline for detailed analysis. For example, this Session Detail timeline illustrates the events and player states in a video stream in which play started successfully, experienced short periods of rebuffering and non-fatal errors, played again and eventually terminated due to a VPF.
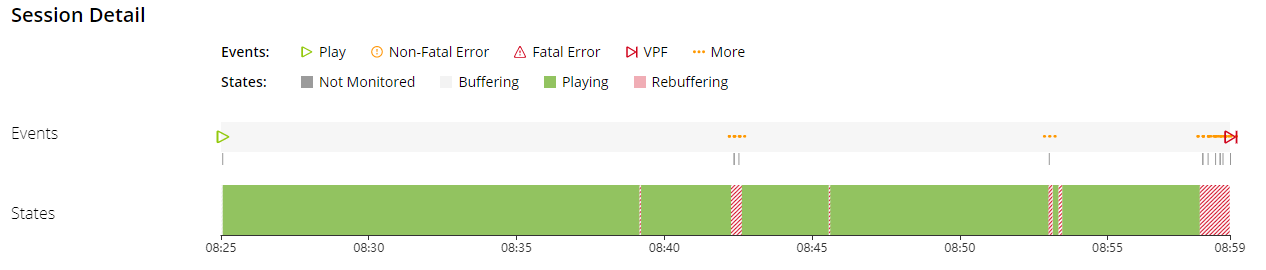
Only the icons for the current session states and events appear above the timeline. The complete legend is shown below.

| Session State | Indicates … | |
|---|---|---|
|
Buffering
|
Buffering |
Continuous buffering that lasted less than 90 secs occurred prior to video startup. |
|
Long Buffering |
Continuous buffering that lasted for more than 90 secs occurred either prior to video startup or midstream. Long buffering is not counted in the Rebuffering Ratio or Concurrent Plays metrics. |
|
|
Rebuffering |
Connection induced rebuffering occurred, excludes Seek buffering. |
|
|
Seek Buffering |
Buffering started soon after a Seek event. |
|
|
Playing
|
False Playing |
The player reported Playing, but the playing time lasted less than minimum time to validate the player state. |
|
Playing |
The player reported Playing and the playing time was sufficient time to validate the player state. |
|
|
Pause
|
Long Pause |
User initiated a pause in the video play that lasted for more than 90 seconds. |
|
Pause |
User initiated a pause in the video play that lasted for less than 90 seconds. |
|
| Other |
Unknown |
Conviva was unable to determine the session state. Typically occurs when a session heartbeat is unavailable or not monitored. Any information and data during this period does not contribute to metrics or metadata. |
|
Other |
The device reported a stopped state or a state that is not listed as a session state, i.e., not in a playing state. Any information and data during this period does not contribute to metrics or metadata. |
|
|
Multiple States |
Multiple states occurred within a short period. Expand the timeline to display the individual states. |
Note: An expired event indicates that the session ended due to lack of response from the player within a two-minute timeout period. This can occur when the player application is sent to the background, the device loses connectivity, or the session terminates without reporting session end.
Detailed timelines are available for:
-
Session Detail
-
Bitrates
-
Assets watched
-
Error events
-
Custom events
The ... indicates more than one event is described by the marker, typically a non-fatal error. Zoom in to a more granular view to display the other events.
Hover over the vertical event markers to display event details.

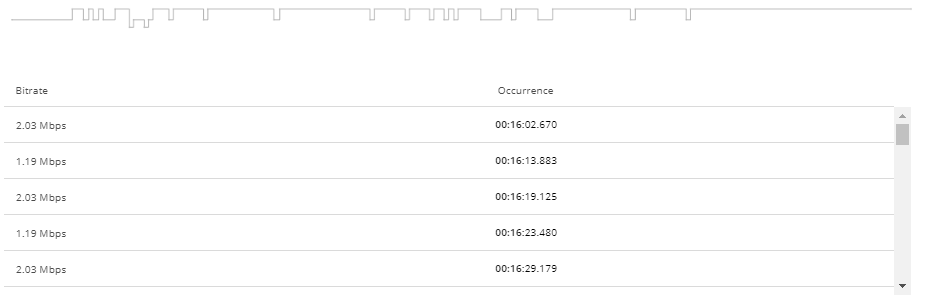
Bitrate Timeline
The Bitrate timeline expands to show the timeline of bitrates and when the bitrate switches occurred.
Hover over a period to display bitrate details. Click the expand icon to display the bitrate details. In this example, bitrates fluctuated between 1.19 Mbps and 2.03 Mbps.
CDN Timeline
The CDN timeline displays the timeline of CDN use and number of CDN switches in the selected session period along with the duration during which each CDN was used.
Hover over a CDN to display details about the CDN use.

Asset Timeline
The Asset timeline displays the asset timeline and the number of assets viewed during the session along with the duration during which the assets played.

Error Timeline
The Error timeline displays the event timeline with the number of errors during the session along with event markers indicating when the events occurred.
Hover over an event to display the event display details. Click the expand icon to display the error details.

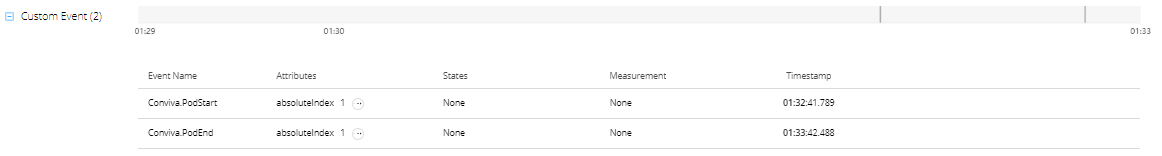
Custom Event Timeline
The custom event timeline shows the custom events timeline with event markers indicating when the custom events occurred during the selected session period.
Hover over an event to display the event display details. Click the expand icon to display the event details.
Session Timeline Scenarios
Use these session timeline examples to understand how different types of sessions events and player states appear in the timelines.
-
No buffering and played successfully

-
Delayed startup and multiple rebuffering intervals throughout the play. Play ended successfully.

-
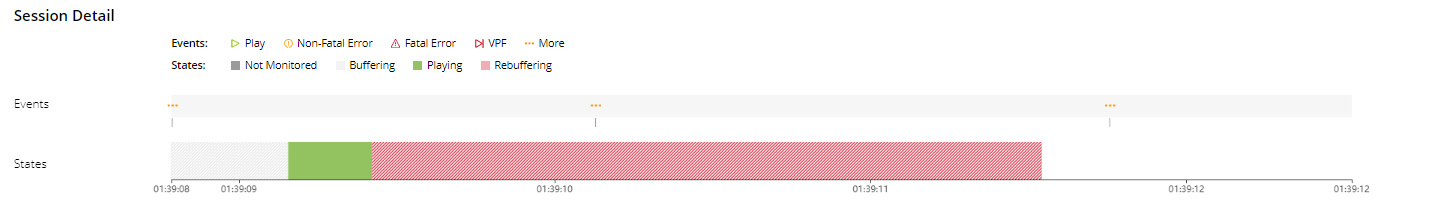
Initial buffering, played for a short interval and then rebuffered until the session terminated with a VPF.

-
Started successfully, then viewer paused the play, resumed play, and then paused until the session ended.

Share, Save, Export
You can share, save, and export timeline data in the toggle menu.
Click Share to create snapshots of the Timeline dashboard to collaborate with other Conviva Video users . When you click Share, Conviva VSI saves a snapshot of the item for 30 days and produces a link that you can share by email, by Slack message, or by pasting it into another document.
When a user opens the link and logs in to Conviva VSI, they see an exact copy of the item you sent. They can change how VSI presents the data in the snapshot, but cannot change which data are part of the snapshot. For example, the user can deselect metrics to hide them, but they can't change the dimension or time intervals.
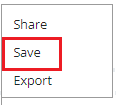
Saving
In the current or shared dashboard, click the kebab icon to Save the dashboard for re-use and collaboration.
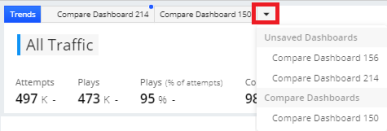
Saved dashboards appear in the tab list and can be accessed from the dashboard drop-down. A blue dot indicates that the dashboard is unsaved.
Timeline False Playing False Playing Timeline