Conviva DPI 2023 Releases
December 2023
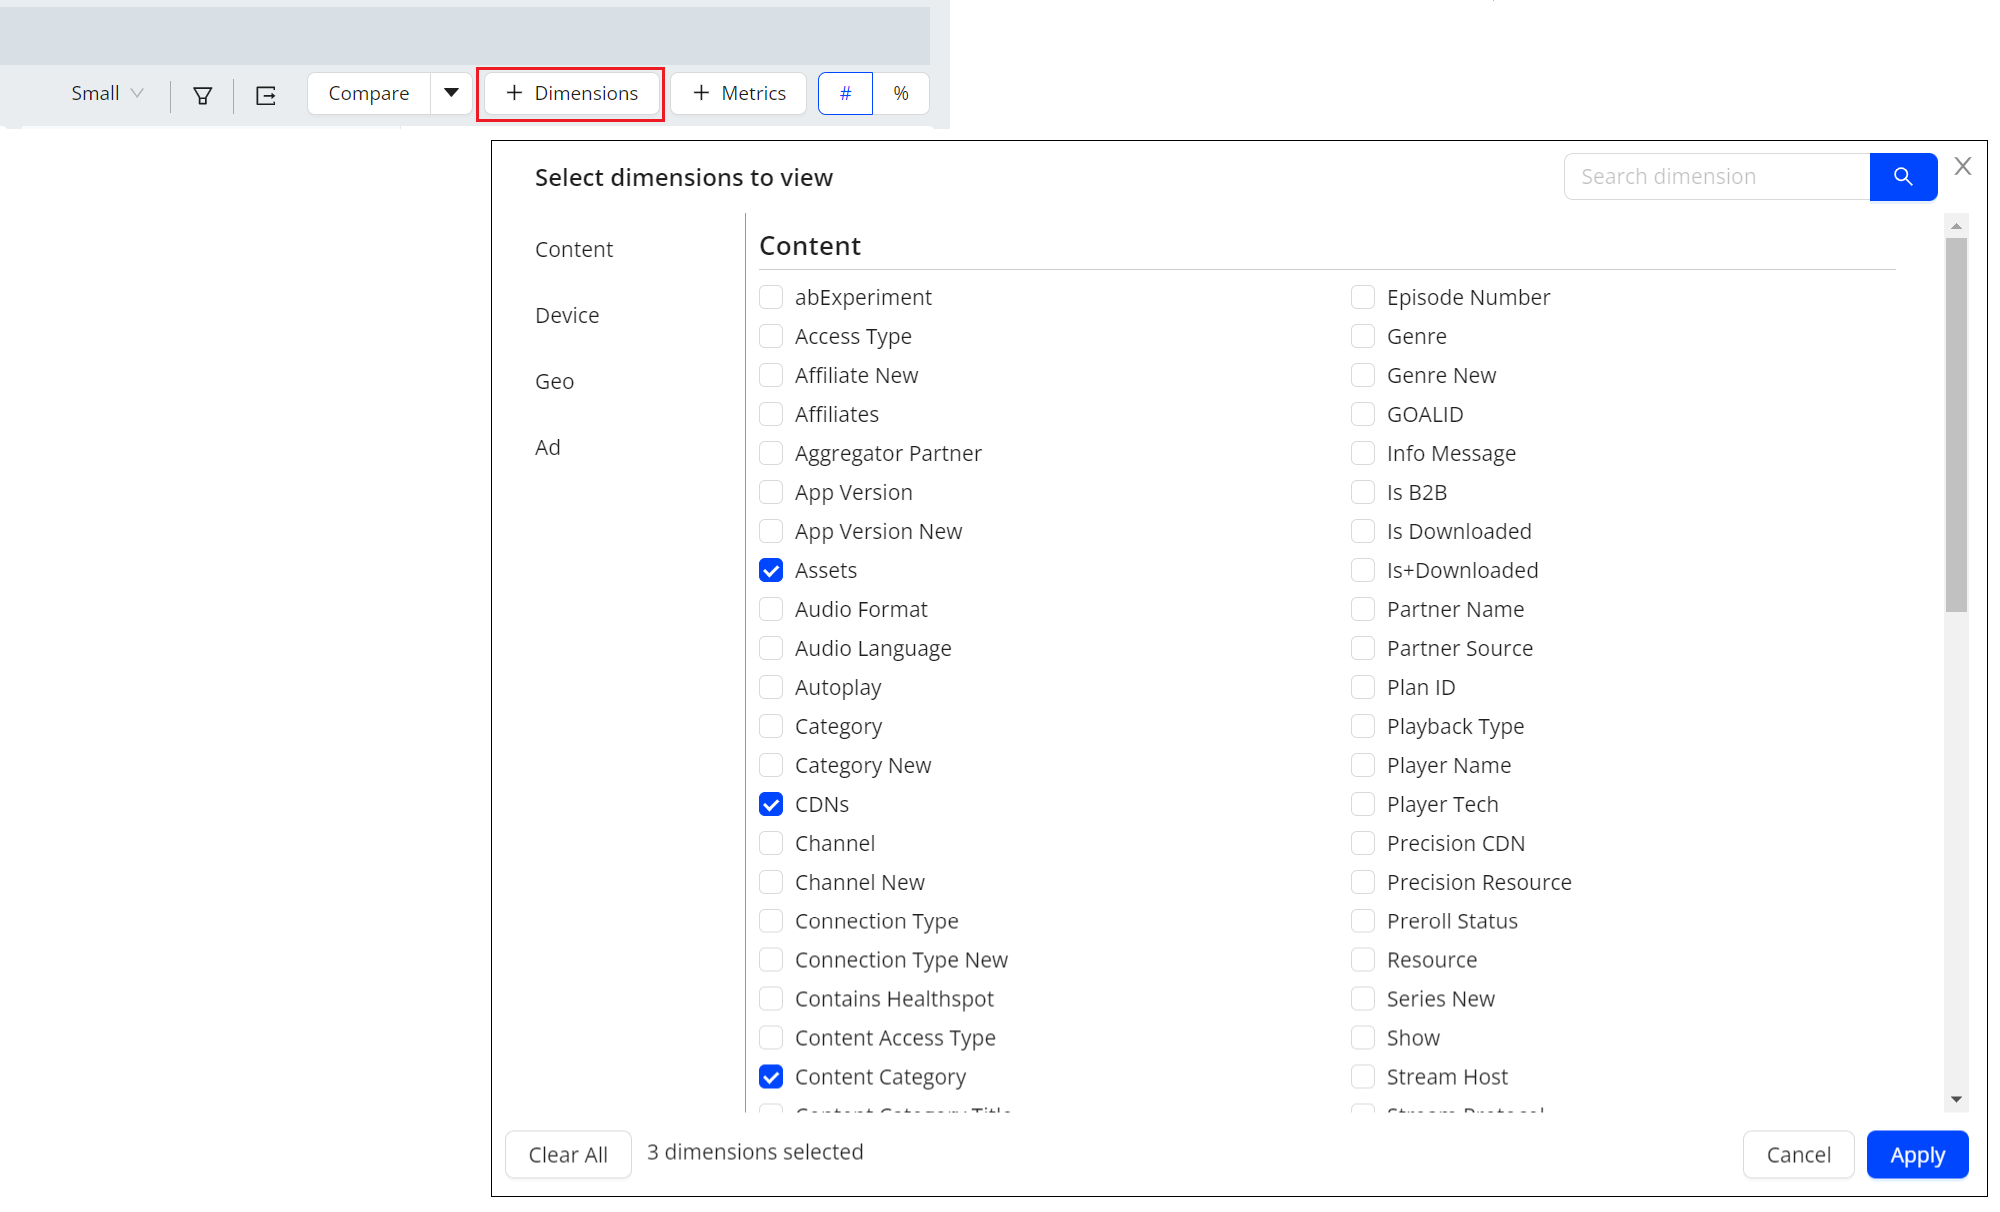
Enhanced Dimensions in AI Alerts Diagnostics
|
|
Feature Update:
Enhances the AI Alert Diagnostics with a Dimensions button for custom dimension selection and drill down. The dimension associated with the root cause group is automatically displayed as the first dimension.
Feature Impact:
Adds a new Dimension button in the drill down toolbar of the AI Alert Diagnostics page. For easy drill down in the root cause diagnostics, the dimension associated with the AI alert root cause displays as the first dimension.
Use Case:
More quickly discover the dimension entities related to the root cause of an AI alert, such as AKAMAI (CDNs) and Vod (Content Category) and Brightcove Web Player (Player Name) with these dimensions automatically displayed.
More Details: AI Alert Diagnostics
Set Collection Rules for Network Requests
|
|
Feature Update:
Adds support for setting collection rules for conviva_network_request events. When the rules are configured, the Conviva sensor will collect events that match these rules. You can then select the collected events as raw data for mapping if necessary.
Feature Impact:
Adds Configure Network Request tab in Semantic Mapper of the Data Modeling dashboard providing access to set collection rules and check the created rules.
Use Case:
To gather specific data that the conviva_network_request events have, such as search keywords and first service request failure details, follow these steps: access the Configure Network Request tab, create collection rules, set mapped events based on the collected events that contain the search keywords, and check the keyword information on the ECO dashboard.
More Details: Configure Network Request
Enhanced Mapping Rule Flexibility and Functionality
|
|
Feature Update:
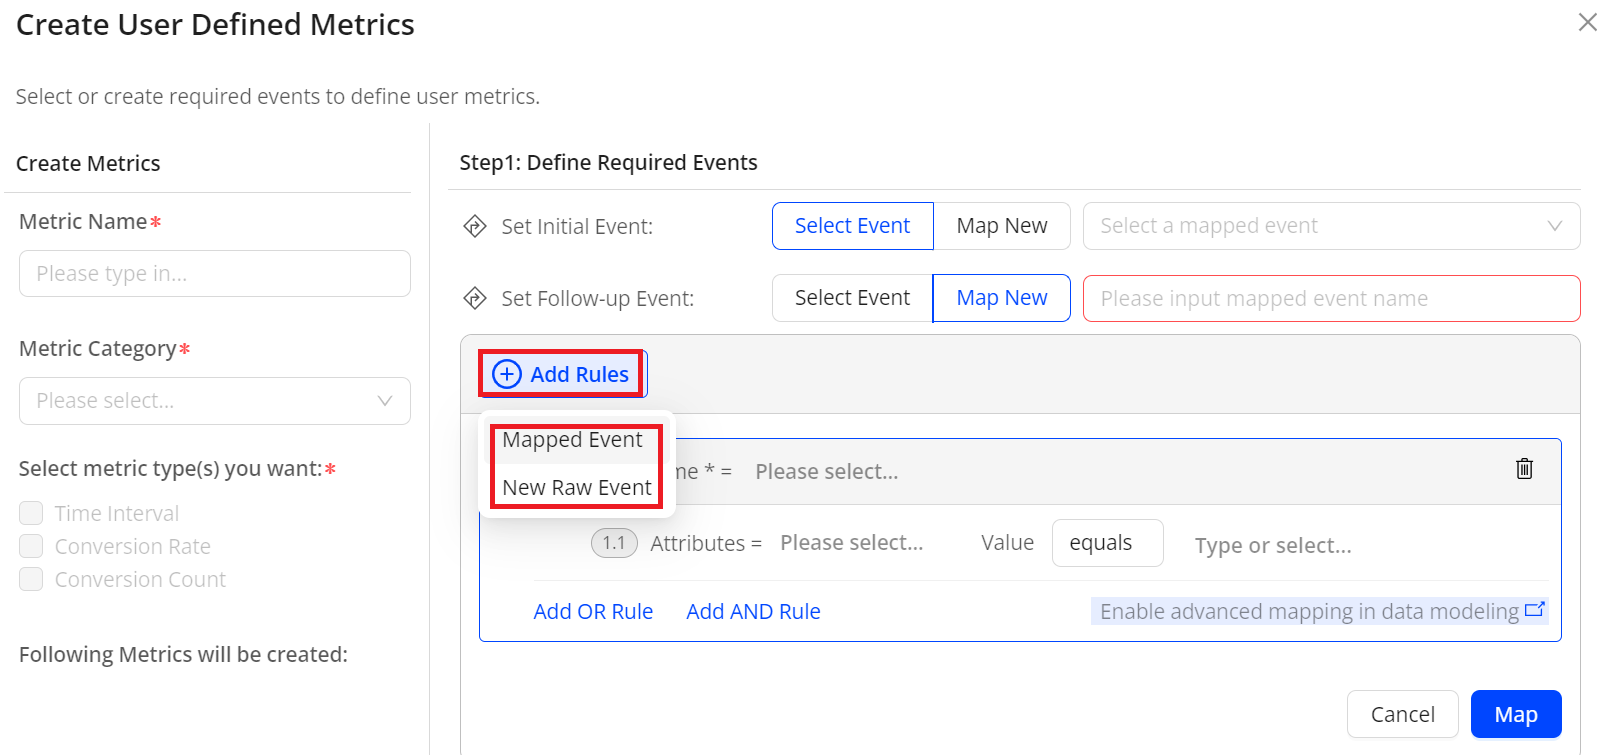
Enables the flexibility to add mapping rules from various existing mapped events when creating a mapped event.
Note: Previously, only adding rules from a single existing mapped event was supported.
Feature Impact:
-
Removes the Clone Mapping Rules button in the Create User Defined Metrics window.
-
Adds the Add Rules list in the Create User Defined Metrics window to enable you to create mapping rules directly or use the rules from existing mapped events.
Use Case:
Saves time by enabling existing mapped events for creating new rules. To re-use mapping rules, follow these steps: access the Create User Defined Metrics window, select the mapped events containing the required rules one by one, make necessary rule updates, and apply the rules to your mapped event.
More Details: Creating User Defined Metrics
Rename App Experience
|
|
Feature Update:
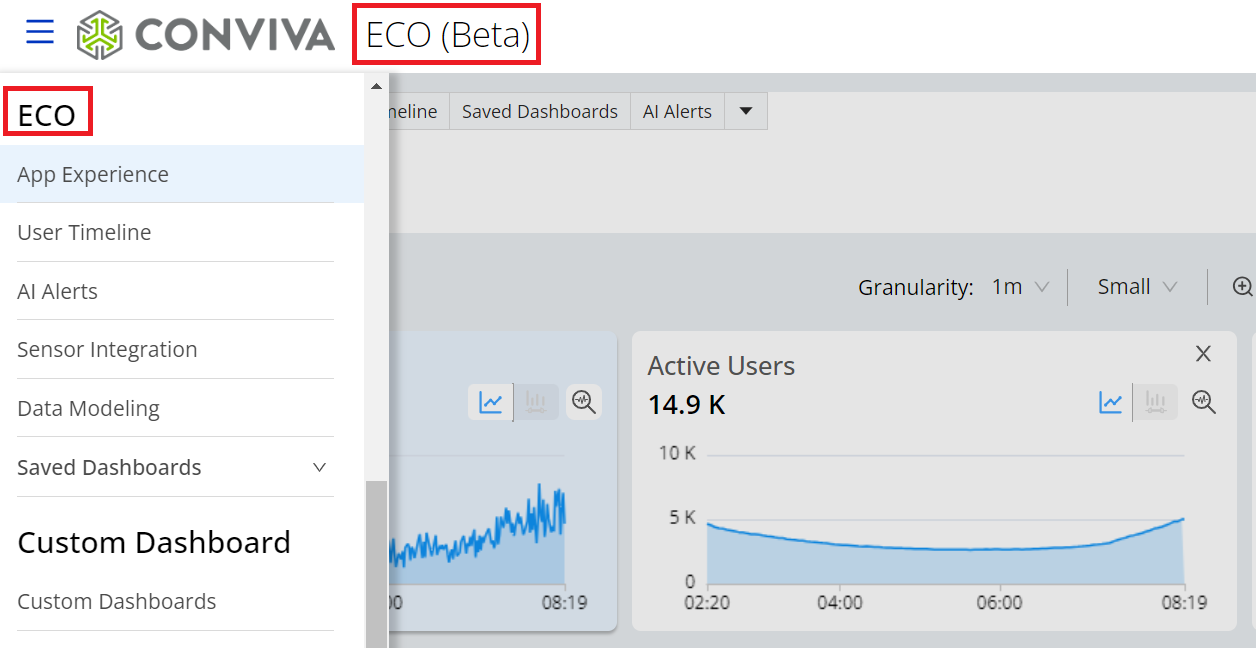
Rename App Experience to ECO. ECO is a short term for Experience-Centric Operations.
Feature Impact:
Replace all instances of the term App Experience in the UI with ECO.
More Details: ECO Help
November 2023
Create User Defined Metrics in the App Experience Dashboard
|
|
Feature Update:
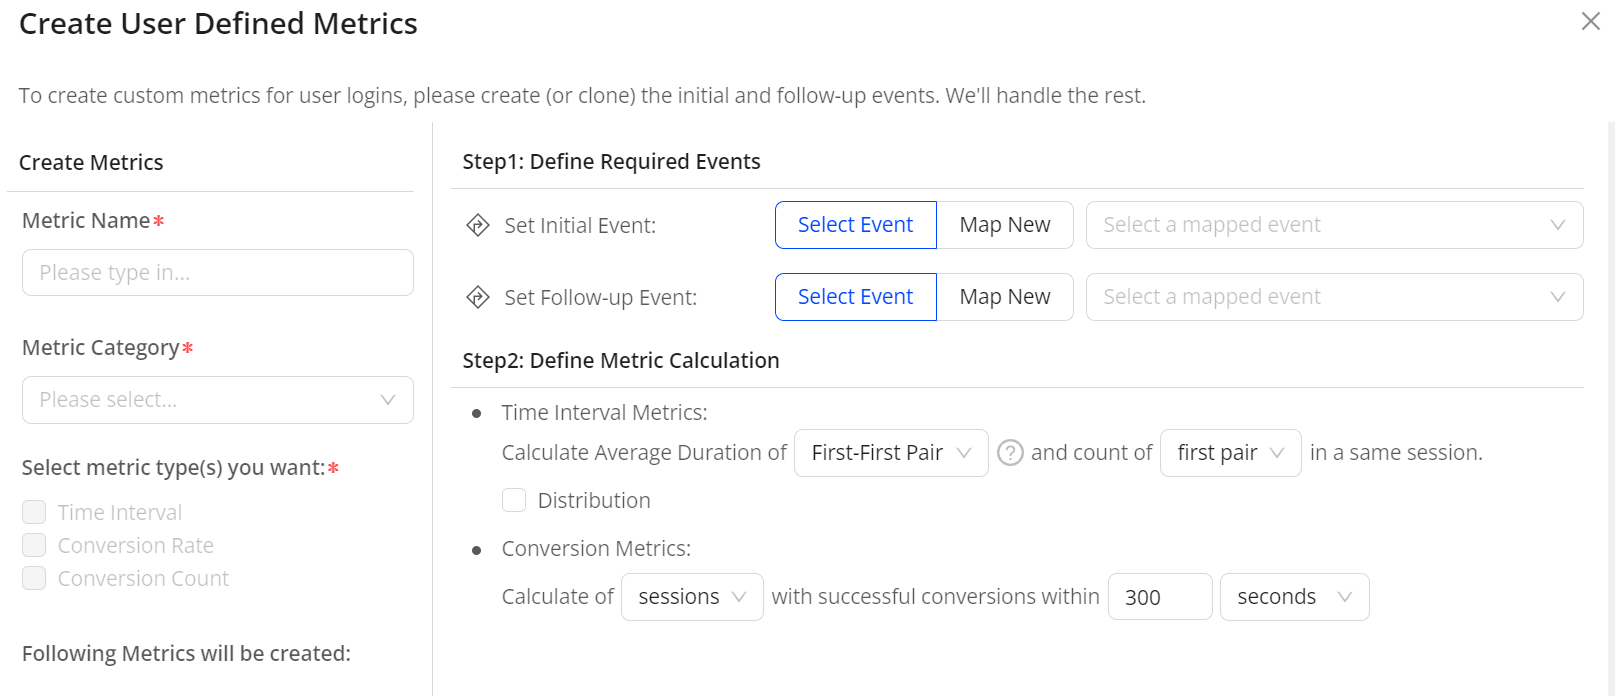
Adds support for creating user defined metrics directly in the App Experience dashboard. Instead of creating user defined metrics solely from the Data Modeling dashboard, this feature offers a convenient shortcut for metric creation in the App Experience dashboard. This feature streamlines the process, saving time and enhancing work efficiency.
Feature Impact:
Adds new UI elements to support this feature, including:
-
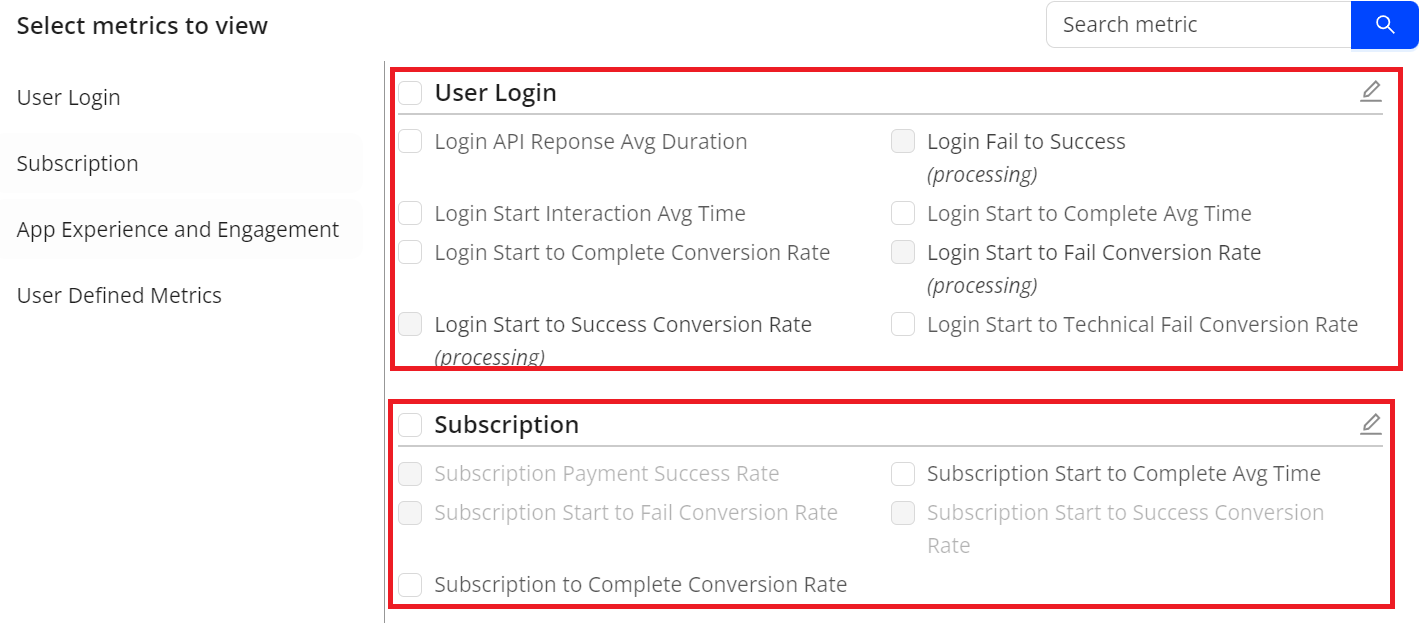
Create New Metrics icons next to the User Defined Metrics list of the Select metrics to view window, providing access to the Create User Defined Metrics window.
-
Create User Defined Metrics window, enabling metric creation.
Use Case:
To analyze your app performance and identify the root causes of slow login times, access the Create User Defined Metrics window from the App Experience dashboard, define required events and metric calculation, create the Full Login Time metric, and check the metric details on the App Experience page.
More Details: Creating User Defined Metrics
Configure Mapped Events in the App Experience Dashboard
|
|
Feature Update:
Adds support for configuring mapped events directly in the App Experience dashboard. Instead of configuring mapped events solely from the Data Modeling dashboard, this feature offers a convenient shortcut for configuration in the App Experience dashboard. This feature streamlines the process, saving time and enhancing work efficiency.
Feature Impact:
Adds new UI elements to support this feature, including:
-
Edit icons in the Select metrics to view window for User Login and Subscription metrics, providing access to the Activate Metrics window.
-
Activate Metrics windows for User Login and Subscription metrics, enabling the configuration of mapped events and activation of metrics.
Use Case:
To analyze your app performance and user behaviors during the login process, access the Activate User Login Metrics window, add the required mapped events for the Login Success metric, activate the Login Success metric, select the metric for viewing, and check the metric details on the App Experience page.
More Details: Activating Metrics
AI Alerts
|
|
Feature Update:
Adds support for AI alerts, eliminating the need to determine thresholds, identify relevant dimensions for monitoring, and set alerts to notify related individuals and groups.
Feature Impact:
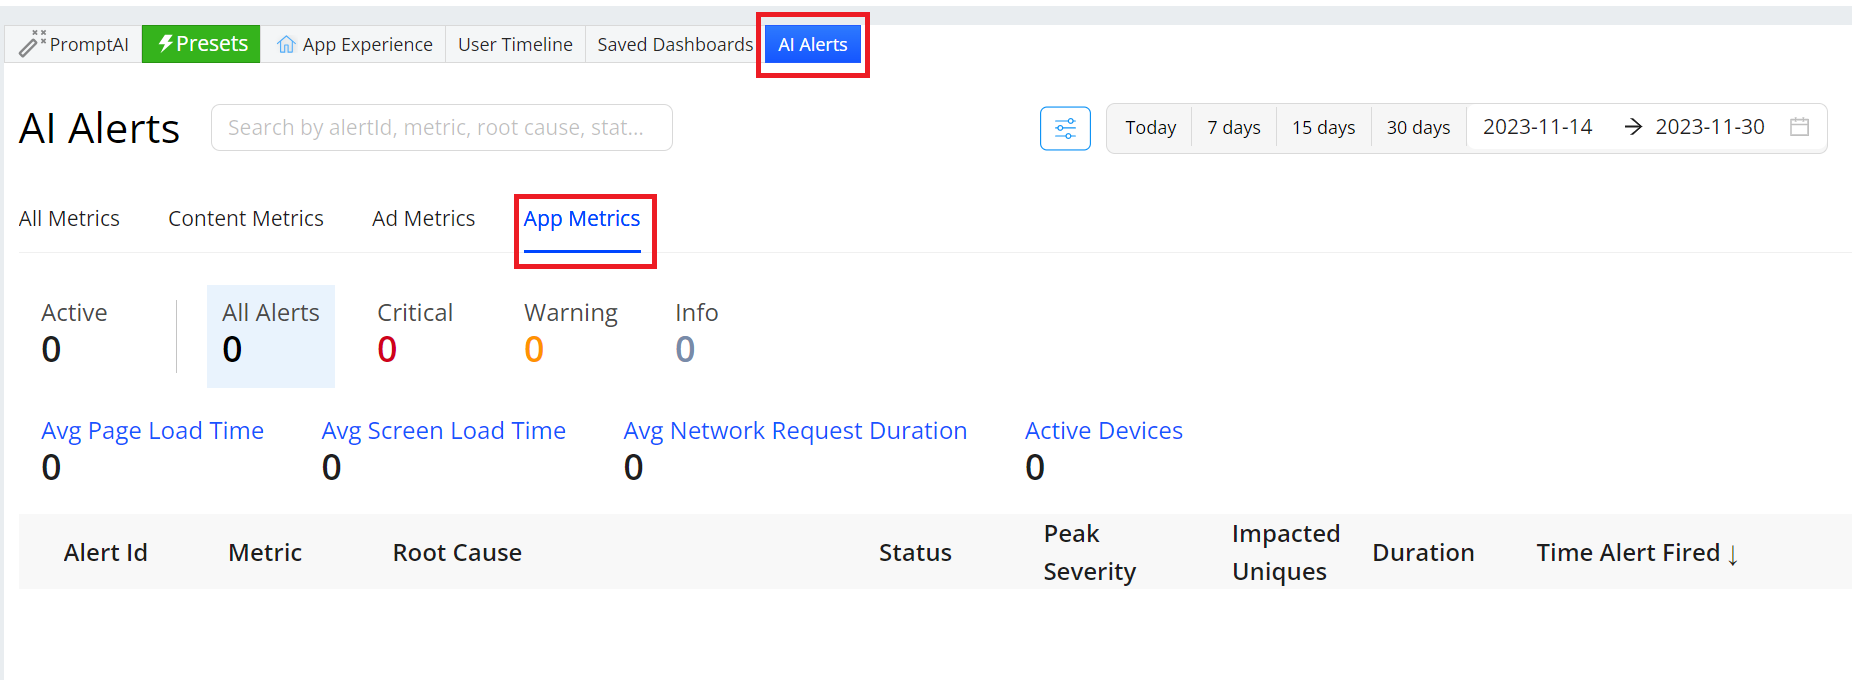
Introduces the AI Alerts dashboard for App Experience and adds the AI Alerts tab to the main App Experience page, providing access to visit the AI Alerts page.
Use Case:
To check app performance and conduct deeper analysis, access the AI Alerts page, review metrics in the critical group, examine the root cause, and click the Time Alert Fired column for alerts, facilitating deeper analysis.
More Details: AI Alerts
October 2023
Custom Dashboards: Support Multiple Data Sources
|
|
Feature Update:
Adds support for multiple data sources in Custom dashboards to enhance analysis across your video streams, ads, and application performance.
Note: Page-level filters are not available when using multiple data sources.
Feature Impact:
-
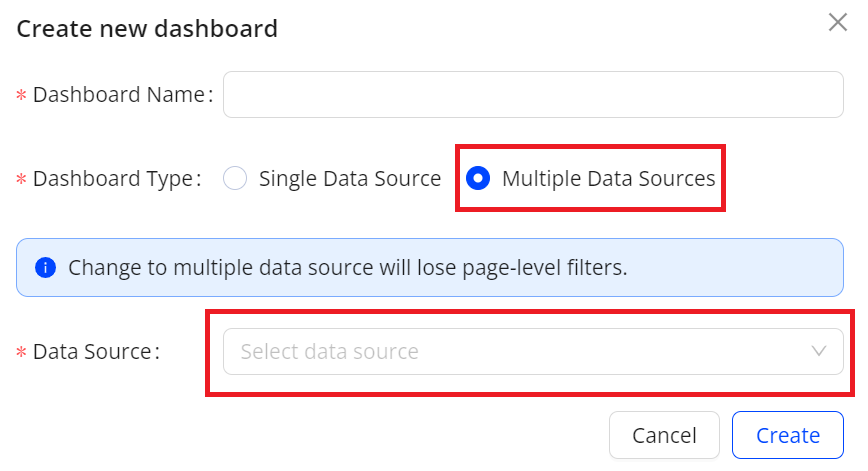
Adds a new pop-up window for creating a new Custom dashboard. The new window includes:
-
Dashboard Name field to enter a dashboard name.
-
Dashboard Type check box to enable the selection of a single data source or multiple data sources.
-
Data Source drop-down list to select a data source type or multiple data sources.
-
-
Adds a Data Source drop-down list to select a data source type on both the Add New Widget page and the Edit Widget page in the edit mode.
Use Case:
To provide an executive overview of streaming and app performance in a single dashboard, select VIDEO and APP as data sources when creating the Custom dashboard, and add widgets for streaming SPI and app crashes metrics.
More Details: Custom Dashboards
Custom Dashboards: Enhanced Filter Comparison
|
|
Feature Update:
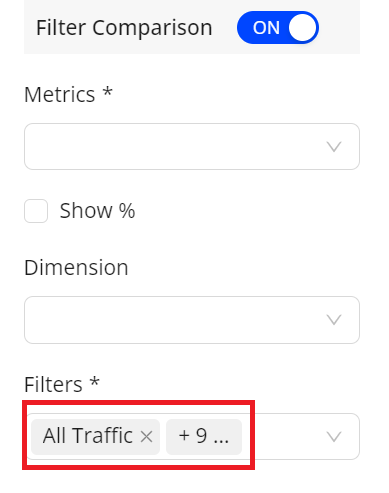
Enhances the filter comparison feature by increasing the number of filters from 5 to 10.
Feature Impact:
Increases the number of filters from 5 to 10 when using the filter comparison feature.
Use Case:
To compare data in a widget from different filters, click Edit in the edit mode, enable Filter Comparison, select desired filters, and click OK.
More Details: Custom Dashboards
Custom Dashboards: Enhanced Bar and Map Filter Functions
|
|
Feature Update:
Enhances the bar and map filters by providing these functions:
-
Set the number of values that can be displayed in the bar or map.
-
Select static values as advanced filters in the bar or map.
-
Toggle between the visual view and the table view.
Feature Impact:
Adds these new field and icons to support the new feature:
-
Row limits field to set the number of values that can be displayed.
-
Advanced Filter icon to select static values as advanced filters in the bar or map.
-
View Table and View Chart icons to toggle between the visual view and the table view.
Use Case:
To compare attempts from specific countries in a created bar chart, click the Advanced Filter icon at the top right corner of the bar in the Edit mode, select the specific countries, and click OK. The bar chart data updates to reflect your selection.
More Details: Custom Dashboards
September 2023
Custom Dashboards: Enhanced Sharing Capability
|
|
Feature Update:
Enhances the sharing capabilities to grant edit or view permissions to individual users within the same C3 account and invite collaborators to make changes to custom dashboards.
Feature Impact:
-
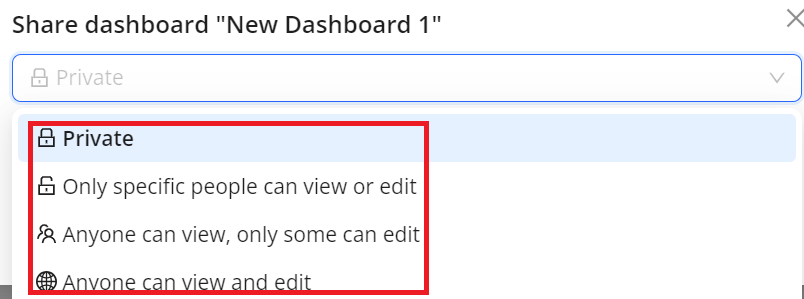
Adds a drop-down list for selecting preset options on the pop-up window after clicking Share for assigning edit or view permissions to individual users.
-
Adds the Edit Dashboard button to enter the edit mode.
-
Adds the Edit Mode switch button in the edit mode to indicate your editing status and to exit when needed.
Use Case:
To collaborate with other users on a dashboard you created, open the kebab menu, choose Only specific people can view or edit from the drop-down list of pop-up window, and do these steps:
-
To grant view permissions to some users, select the email addresses, select Can View, and click Apply.
-
To grant edit permissions to some users, select the email addresses, select Can Edit, and click Apply.
More Details: Custom Dashboards
Custom Dashboards: Map Visual Type
|
|
Feature Update:
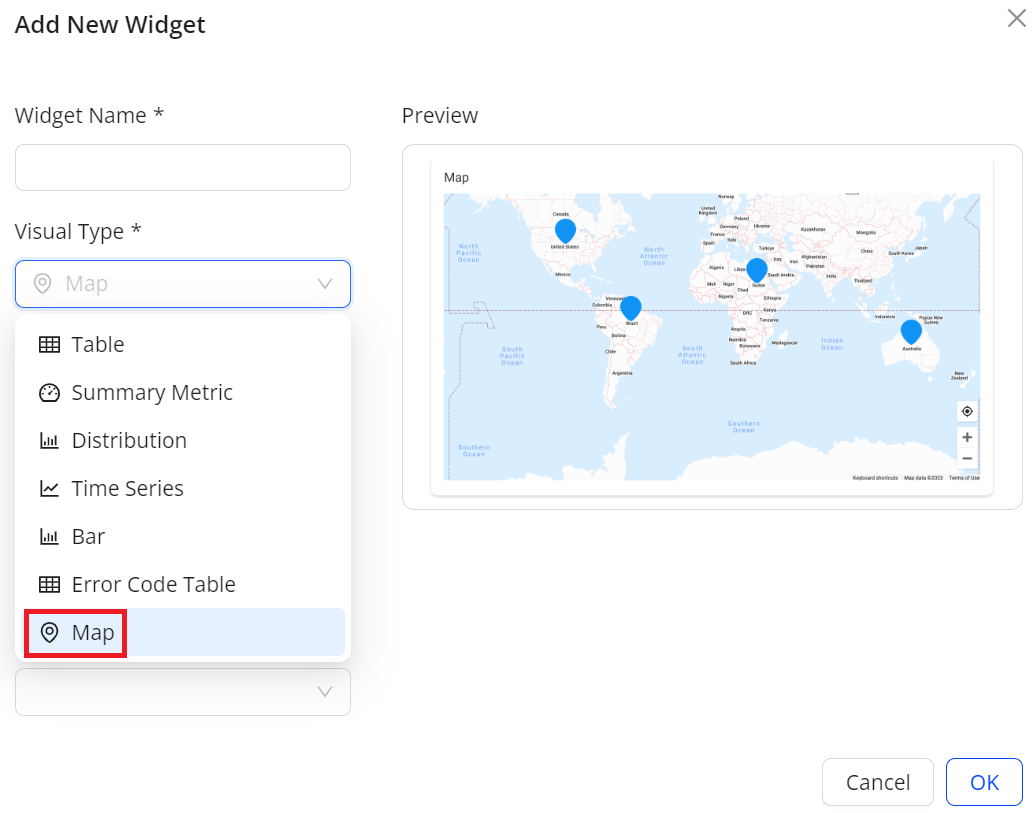
Custom Dashboards now support APP as a data source for creating custom dashboards with App Experience metrics. Custom Dashboards add support for the Map visual type when setting up a new widget. This feature enables an intuitive way to check metrics from geographical perspectives, such as country, state, and city.
Feature Impact:
Adds Map to the Visual Type drop-down list when setting up a new widget to enable an intuitive way to check metrics from geographical perspectives.
Use Case:
To monitor the App Crashes metric in different cities from an intuitive way, create a dashboard using APP as a data source, and then create a widget by selecting these options:
-
Visual Type: Map
-
Metric: App Crashes
-
Dimension: Cities
More Details: Custom Dashboards
August 2023
App Experience Beta Release
On-going Beta release for feature evaluation and feedback.
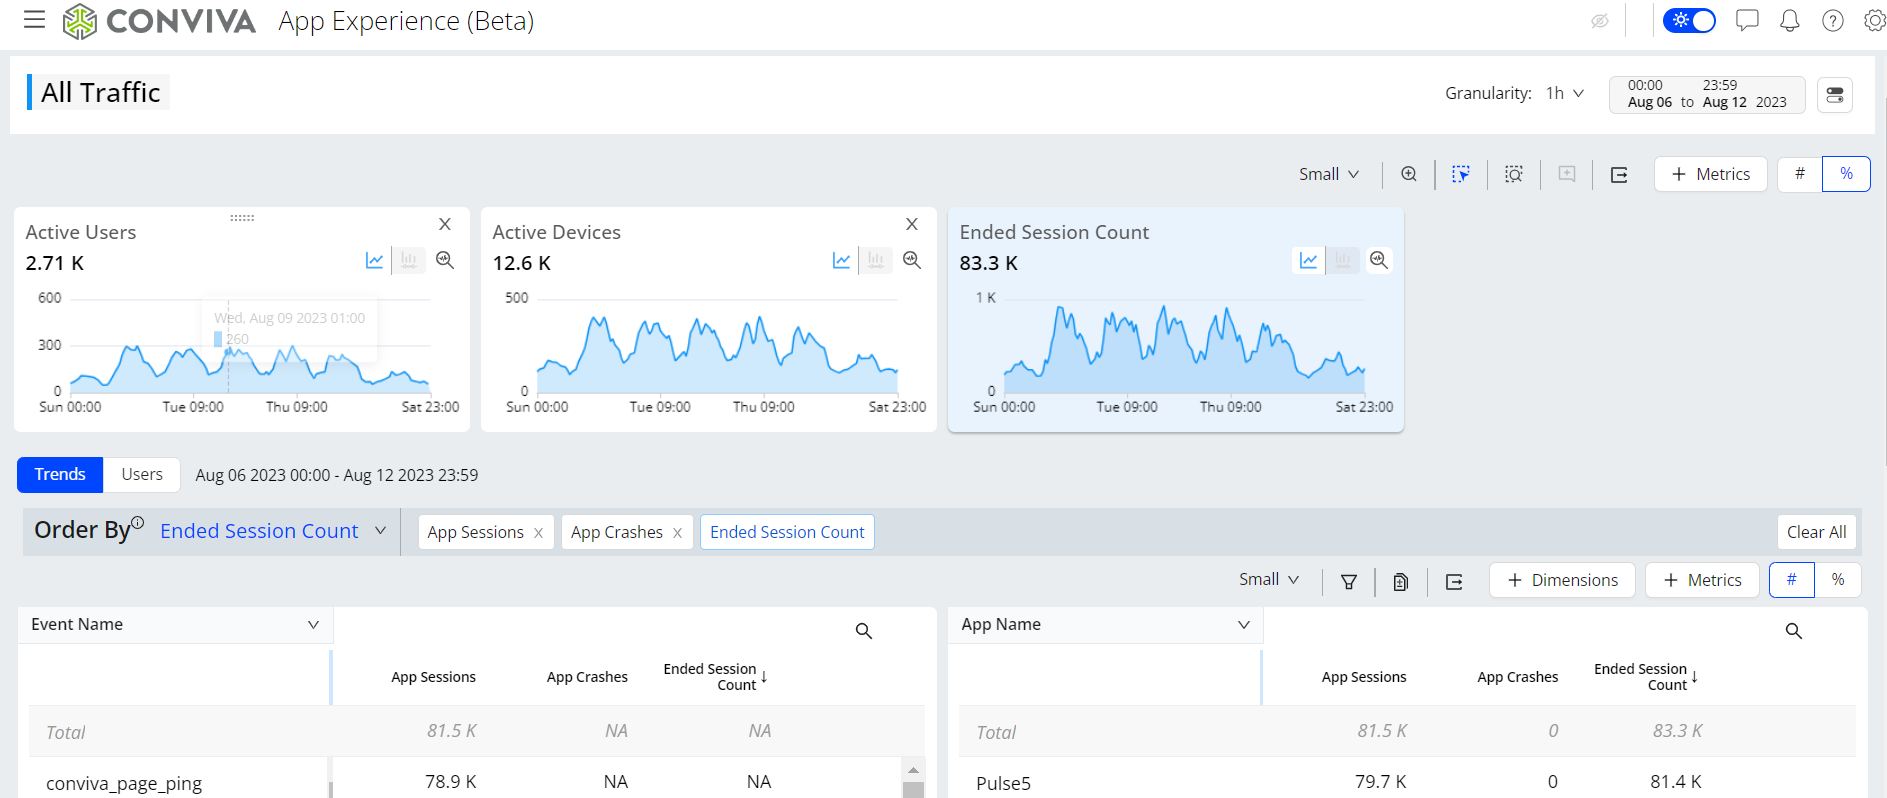
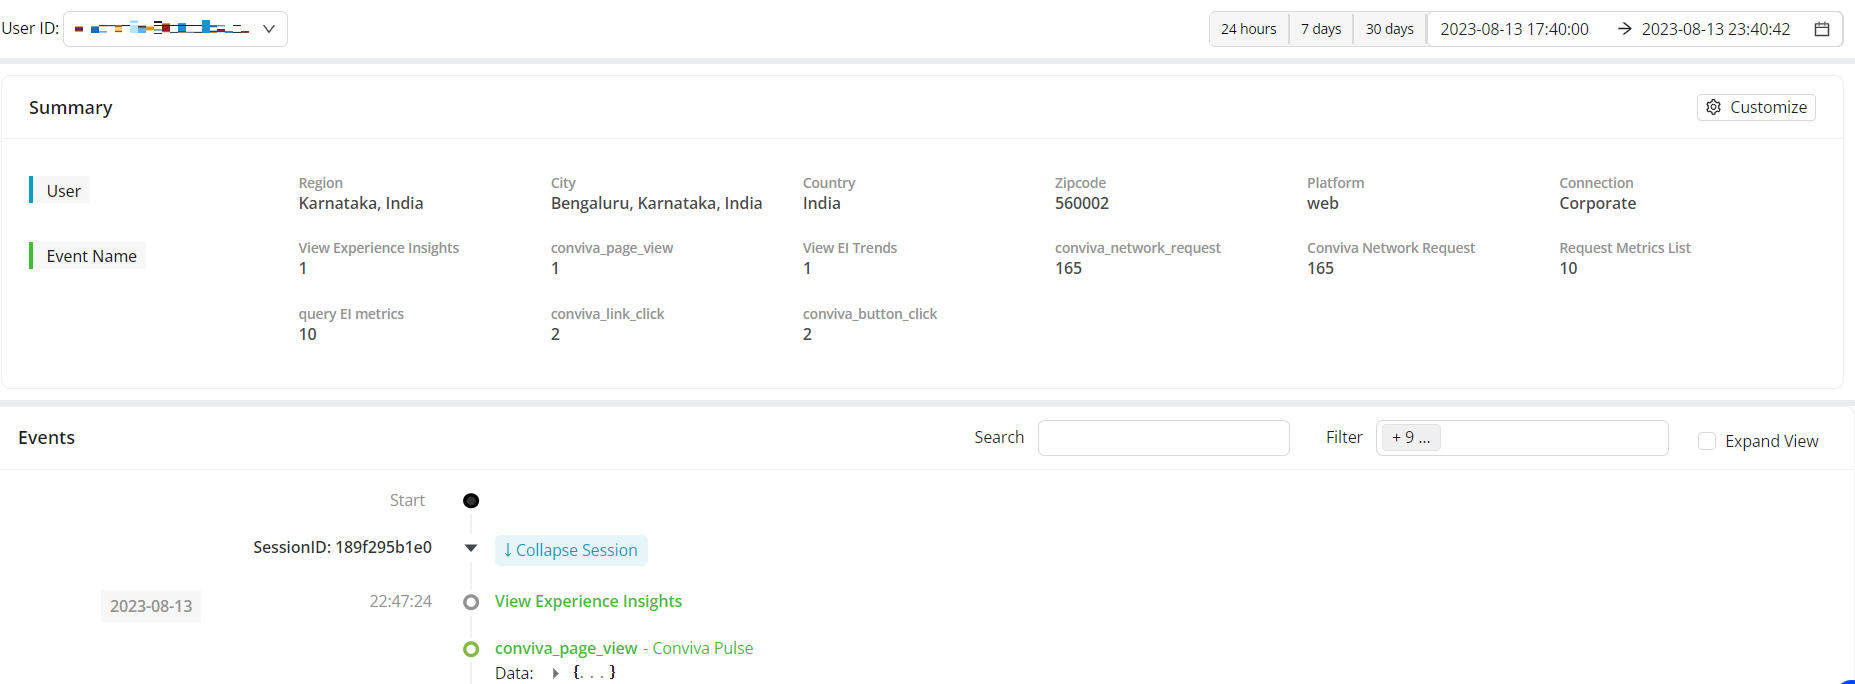
Explore the images to learn about the key functionalities App Experience offers. Click each image to access the corresponding documentation for more details.
Drill-Down Analysis
User Timeline
Map New Event
Metric Builder
