The Trends dashboard provides a convenient shortcut for metric creation and activation, helping streamline the process, saving time, and enhancing work efficiency.
Creating Custom Metrics
DPI enables you to create custom metrics based on your specific performance goals, such as monitoring login time, analyzing user behaviors and app performance. Integration with Conviva app allows for automatic and semantic-less data collection of all application events, providing valuable building blocks for creating new metrics. For example, you can select events like click download trial button and trial download complete to build a time interval metric that measures trial completion time. You can create three metric types: time interval, conversion rate, and conversion count.
-
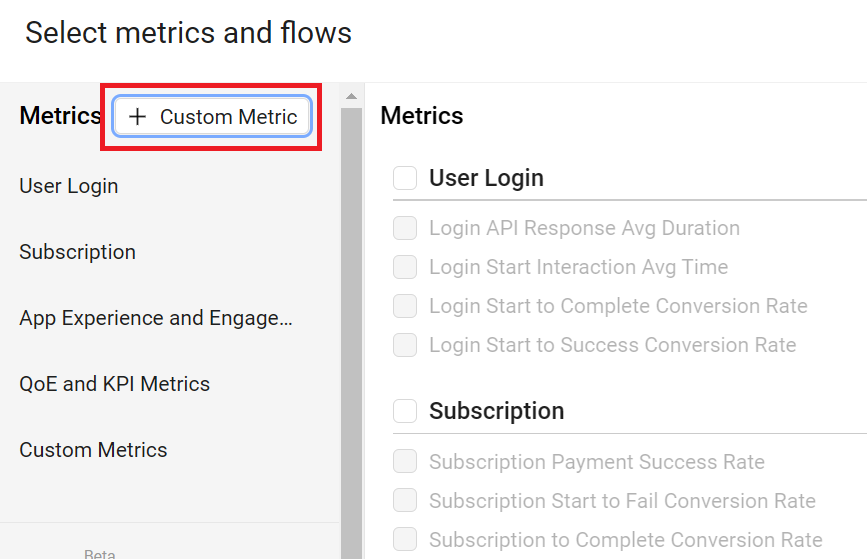
Access the Create Custom Metrics window by clicking + Custom Metric next to the Metrics list.
-
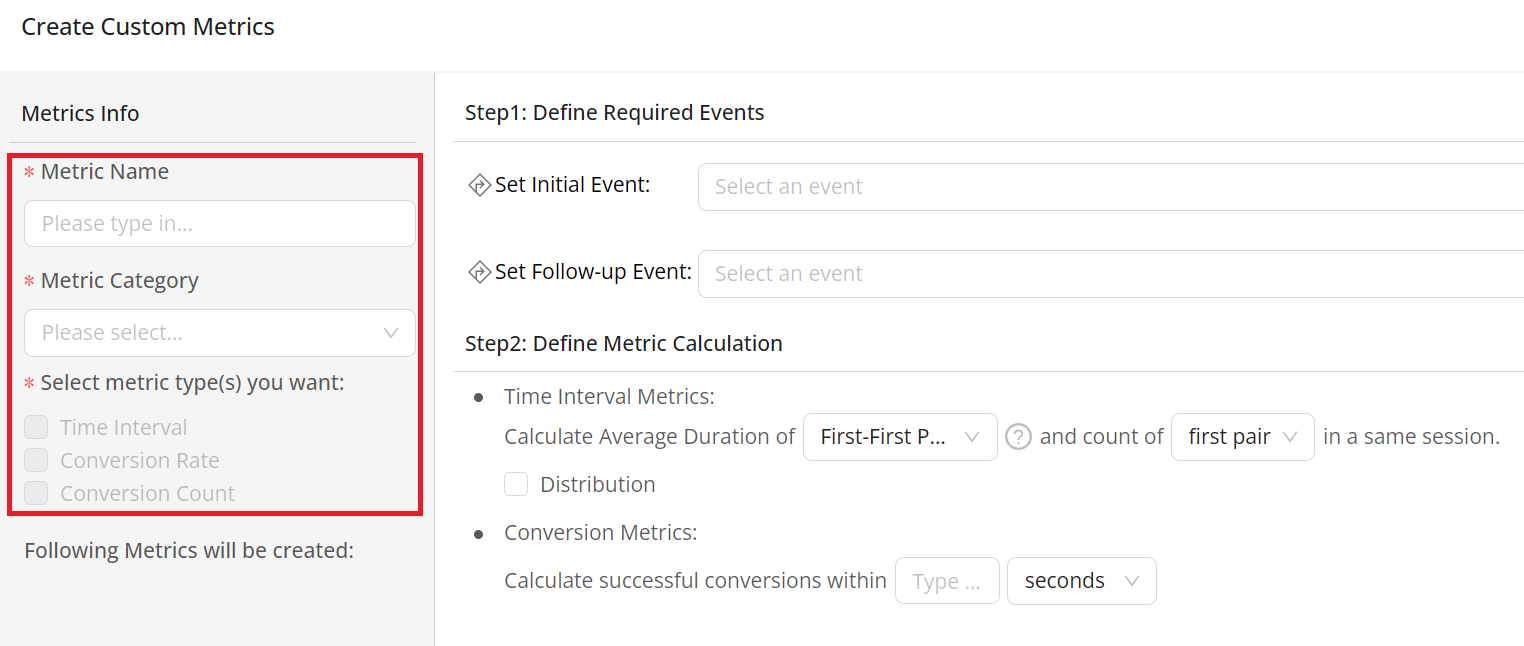
In the Create Custom Metrics window, fill in the metric name, select category and metric types.
-
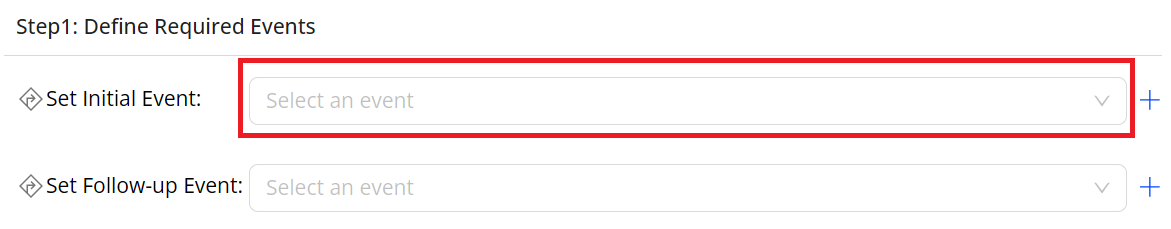
To define required events, select either of the options:
-
Select Event: Select the event from the drop-down list when the required event already exists.
-
Map New: Click the + icon if you need to create new events for defined metrics.

-
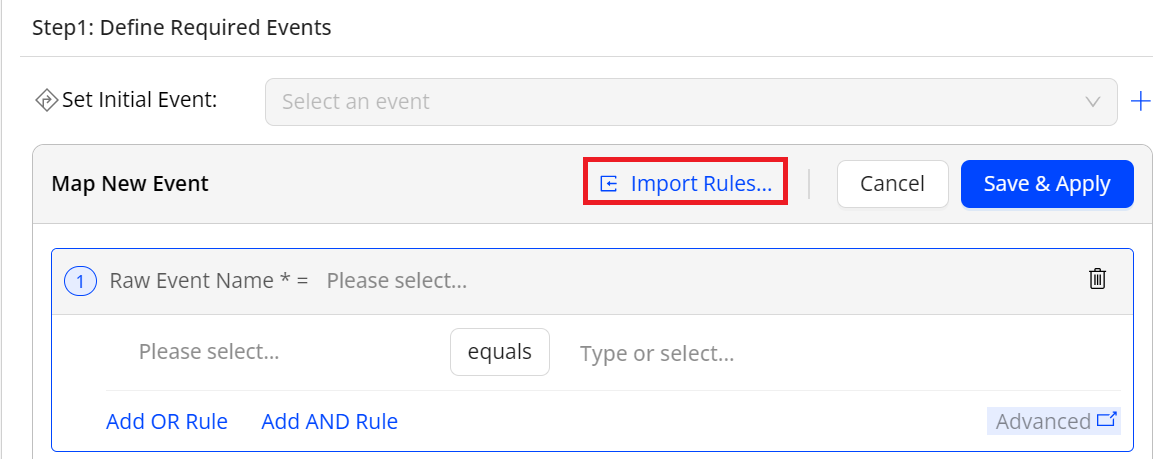
Set the mapping rules:
-
If you want to add mapping rules from an existing mapped event, click Import Rules, select a suitable mapped event from the drop-down list, and click Confirm. The raw event name, attributes and corresponding value are automatically filled out. You can proceed to make any necessary updates.
-
If you want to add mapping rules without referencing mapped events, select a suitable raw event from the drop-down list and set the corresponding attributes and values.
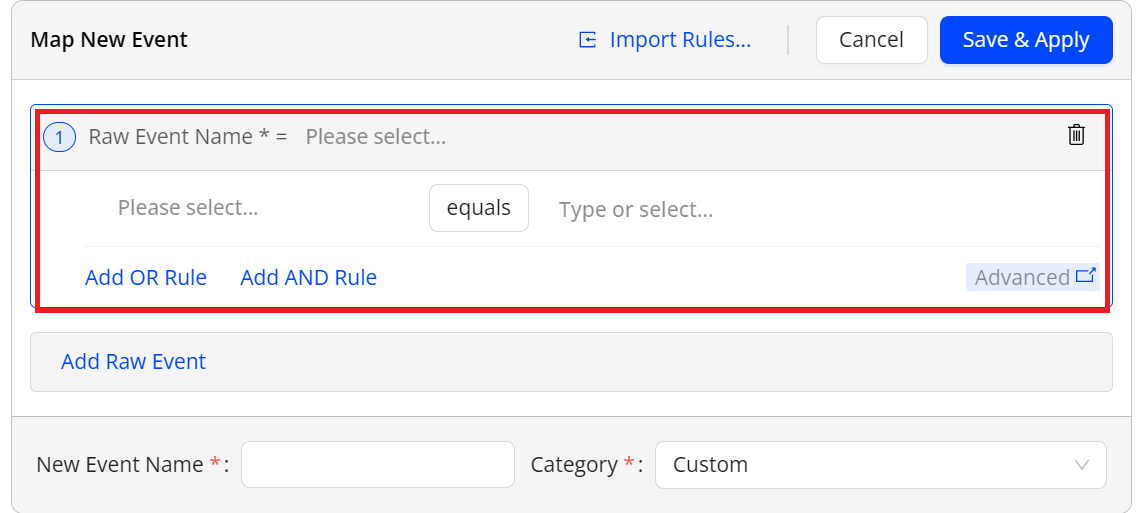
Note: When setting the attributes and tag values, you have several conditions and rule options available, including "contains", "not contains", "equals", and "not equals", as well as "or" and "and" rules. For example, for the raw event _user.login with the event_action tag key, the event tag values are Success and success if you want to a mapped event that indicates the success login. Use one of the options. Option A: Set the tag Value to contain uccess. Option B: Set a tag value to equal Success, click “Add OR Rule” and then set the tag value to equal success.
-
-
Input the new event name and specify the category.
-
After completing the setting of initial event, click Save & Apply. Repeat the same steps to configure the follow-up event, and click Map.
-
-
-
Define metric calculation.
-
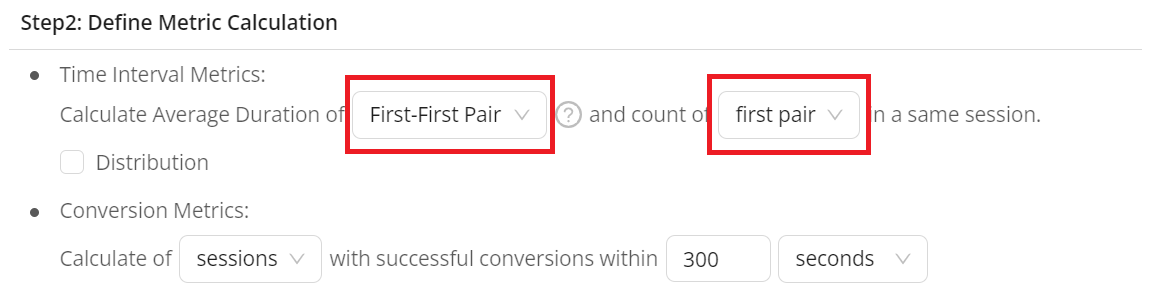
 For Time Interval Metrics
-
Set the pair type.
-
First-First Pair: Uses the first Initial Event and the Follow-up Event as a pair.
-
Last-First Pair: Uses the last Initial Event and the first Follow-up Event as a pair.
Note: Initial Event: The first event that triggers a particular process or workflow. It serves as the starting point for measuring and tracking user interactions or system behavior.
Follow-up Event: A subsequent event that occurs after the Initial Event. It is a continuation or a result of the initial action. The Follow-up Event helps track and measure user engagement or system behavior beyond the initial interaction.
-
-
Set the count type.
- first pair: selects only the first pair in a session.
-
multiple pairs: selects all pairs that meet the pairing logic in the same session.
-
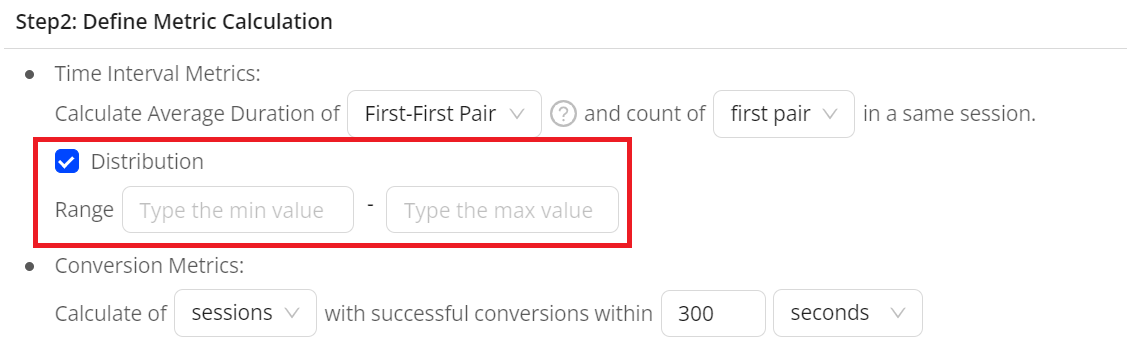
(Optional) To show the distribution of the metric in the DPI dashboard, select the Distribution check box and fill out the range.
-
-
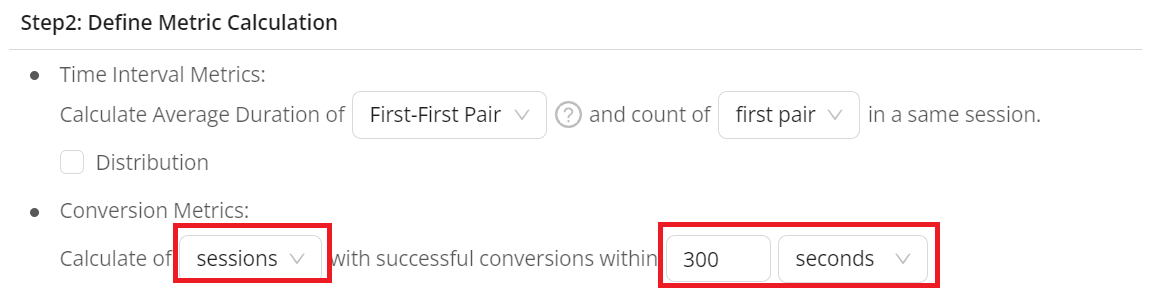
For Conversion Metrics
-
Set the calculation type.
-
sessions: This calculates the count of sessions with successful conversions.
Note: A successful conversion is that one initial event followed by a subsequent event within a specified period. A failed conversion is that an initial event appears but the follow-up event does not occur within the specified period.
-
attempts: This calculates the count of all successful attempts in the time interval.
-
-
Set a criteria for the duration between the two events.
For example, if you set Completed within 30 seconds and the Initial Event is Login Screen View and the Follow-up Event is Login Success, the criteria is that the two events must occur within 30 seconds to be considered a successful conversion.
-
-
-
Click Create, and then you can check the created metrics in the User Defined Metrics list.
Activating Metrics
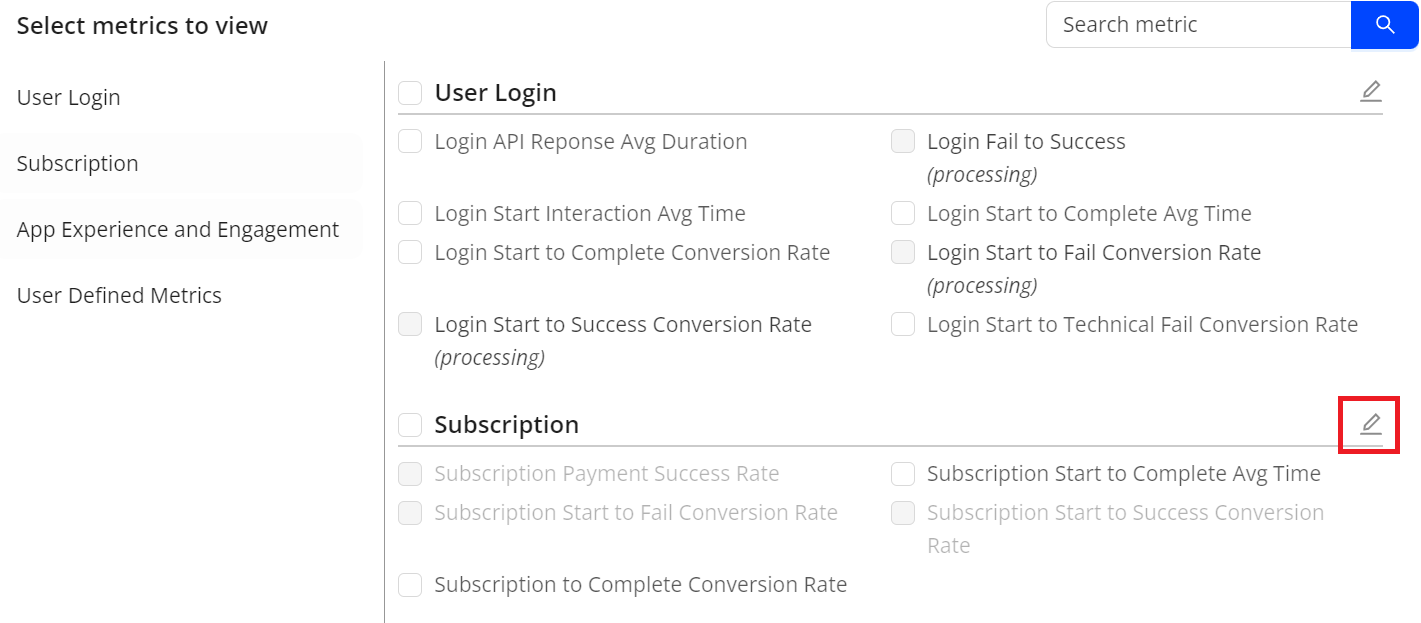
After activating the available metrics of User Login and Subscription, these metrics are visible in the Select metrics to view window. You can select desired metrics to check the details for further analysis on the DPI page.
-
Access the Activate Metrics window by clicking the edit icon.
-
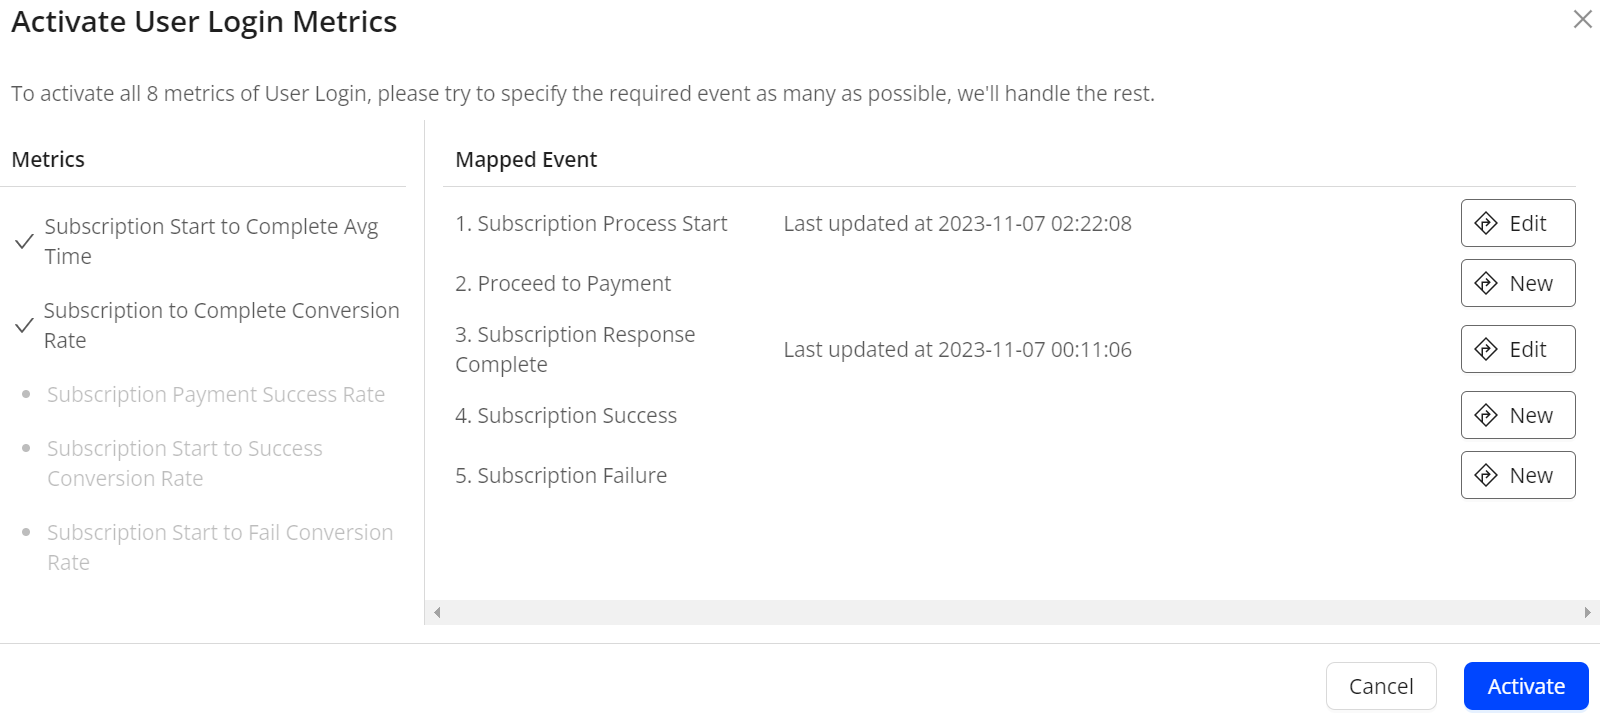
In the opened window, check the metrics and mapped events. Metrics displayed in a lighter color indicate their unavailability, suggesting the addition of specific events to enable these metrics.
-
(Optional) In the Required Events list, edit the current mapped event or add a new mapped event based on your requirements. For detailed steps, check Map New.
-
Activate all available metrics by clicking activate.
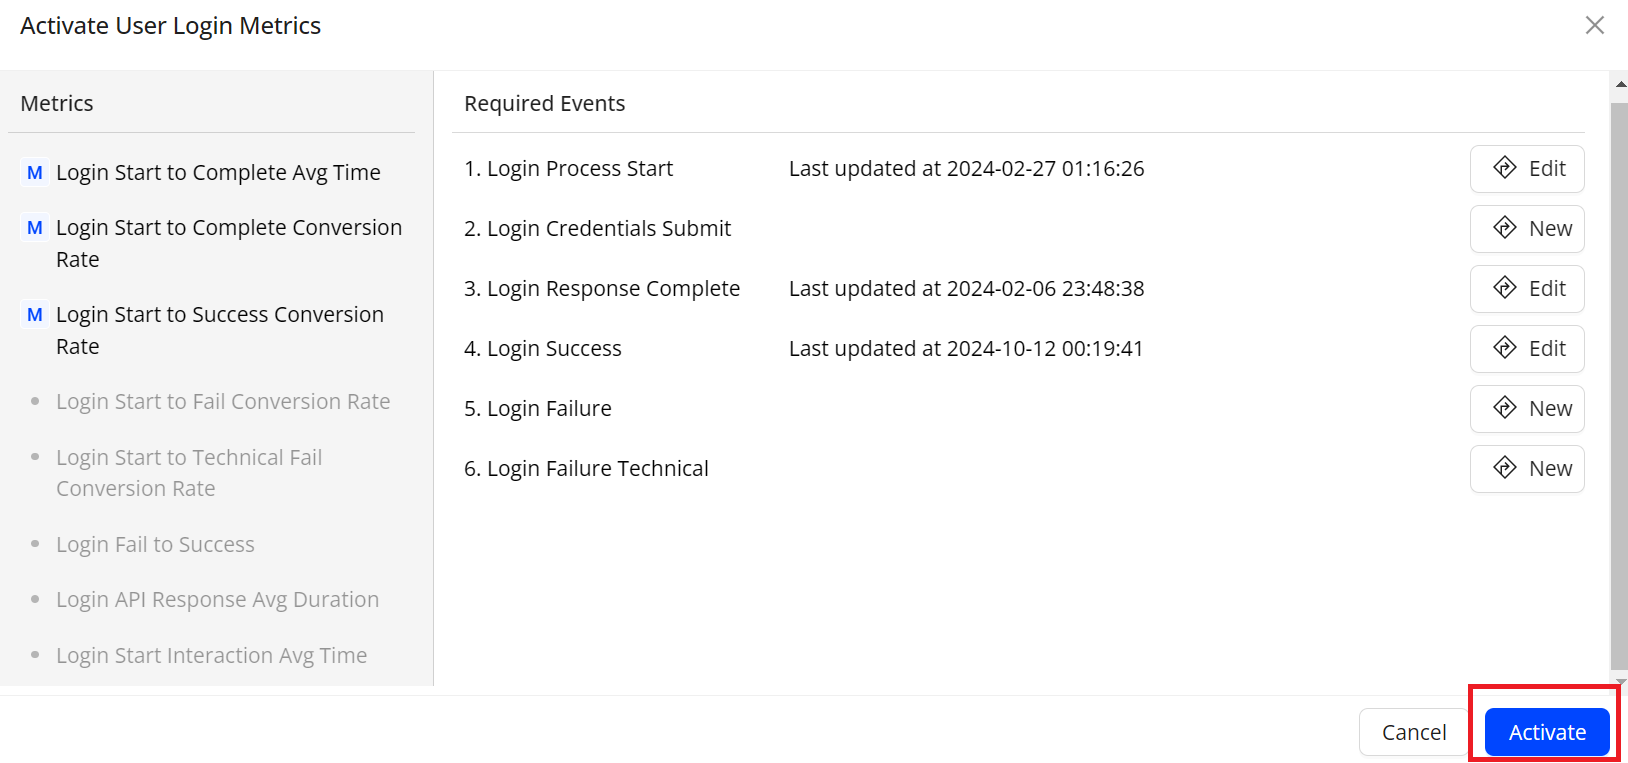
activate metric activate metrics