Conviva VSI Dashboards
Conviva VSIdisplays a variety of dashboards for access to the most commonly used features. You can also save a dashboard to maintain the data and settings. For more details, see Saved Dashboards.
Dashboard Summary
The following dashboards are available in Conviva VSI.
| Conviva VSI Dashboard | Description |
|---|---|
| Trends | The Trends dashboard offers all the features from the old trends and includes several innovative features. These new features include advanced metric filtering, customizable widgets, improved metric summary, and many more. |
| Overview | Highlights your streaming activity and performance so you can quickly compare your streaming performance with the Conviva Streaming Performance Index, and analyze opportunities for improvement with dimensional analysis across key performance areas. |
| Real-Time | Conviva's Real-Time dashboard provides a visual presentation of QoE metrics for actionable streaming intelligence in real time. Enhanced by selected filters and dimensions, you can monitor the performance of your most critical streaming KPIs with visual threshold crossing indicators to quickly identify and correlate changes in QoE metrics. With up to 20 filters and 200 monitored dimension values per Real-Time dashboard, you can customize the dashboard settings to focus on the most critical performance, such as Live traffic across channels for tent pole events or All Traffic across assets for on-going operations. |
| MetricLens | MetricLens enables the dimensional analysis of quality and audience metrics in a unified visual presentation of metric comparison bars and time series with 1-hour granularity. Enhanced with up to three selected filters, you can customize the data analysis to monitor the performance of your most critical streaming KPIs and easily narrow the root cause of performance impacts. |
| Viewer Timelines | Viewer Timelines enable you to drill-down into session timelines for comprehensive and granular analysis of a session, including session performance details, QoE metric performance, session events, session state changes, and related session metadata. |
| Viewers | The Viewers dashboard enables customer care teams to quickly display the details of viewer streaming experiences across the sessions watched in a give time period. |
| AI Alerts | The AI Alerts feature offers proactive anomaly detection and instant alerts to help shorten time to resolution. This advanced feature eliminates the need to determine the thresholds, identify the relevant dimensions that you need to monitor, and set alerts to notify related individuals and groups. |
| Manual Alerts | VSI manual alerts enable you to define alert conditions that act as tripwires for email notifications when a configured alert condition is met. Alert conditions can span the video delivery chain to monitor all aspects of your video stream performance. |
| New Viewer Module | The Viewer Module enables customer care teams to quickly display the details of viewer streaming experiences across the sessions watched in a give time period. |
| Device Validation | Device Validation feature provides user a tool to test and verify the accuracy of the metadata that has been set during integration. |
%/# Toggle
You can see the values in numbers or percentage in Diagnostic metric widget in Trends.
Exporting data
Depending on your analysis needs, you might want to export the data from a dashboard or other page for use elsewhere. It's easy to do: just click Export in the kebab menu. The resulting file is a comma-separated text file that you can import into a spreadsheet or other analytical application.
For more details, see Export Data.
You can also use Executive Emails to share performance data with key stakeholders.
Sharing
You can share snapshots of dashboards with other Conviva VSI users by clicking Share in the kebab menu. Sharing is supported in Trends, Overview, MetricLens, Real-Time, Compare, and Viewers dashboards.
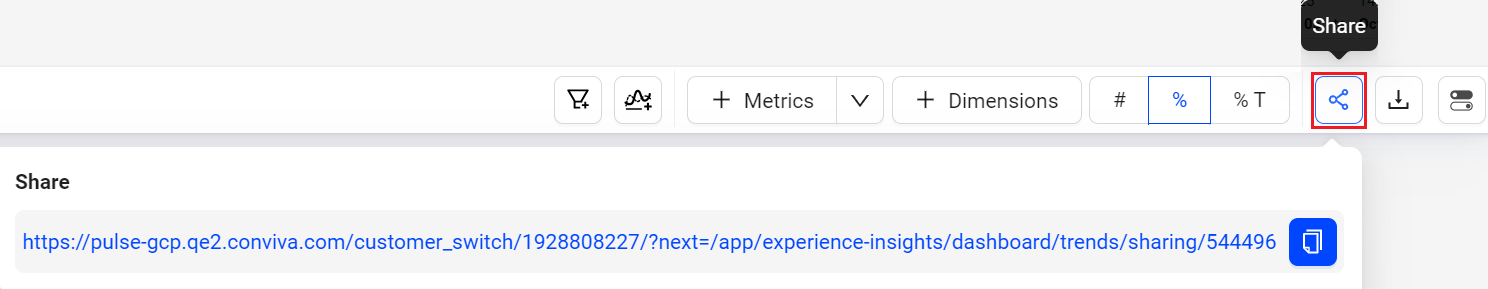
When you click Share, VSI saves a snapshot of the item and produces a link that you can make available to other user for collaboration through email, Slack message, or by pasting the link.
When a user opens the link, they see an exact copy of the dashboard you shared. They can change how Conviva VSIpresents the data in the snapshot, but cannot change data that are part of the snapshot. For example, they can deselect metrics to hide them, but they cannot change the dimension or time series.
Note: Special character and emojis are not supported in the shared links.
Saving
In a shared dashboard, click the kebab icon to Save the dashboard for re-use and further collaboration.
![]()
Saving shared dashboards is supported in Overview, Trends, MetricLens, Real-Time, Compare, and Viewers dashboards.
Note: Only shared Overview, MetricLens, Trends, Real-Time, and Viewers dashboards can be saved. Compare dashboards can be saved without sharing. A blue dot indicates that the dashboard is unsaved.
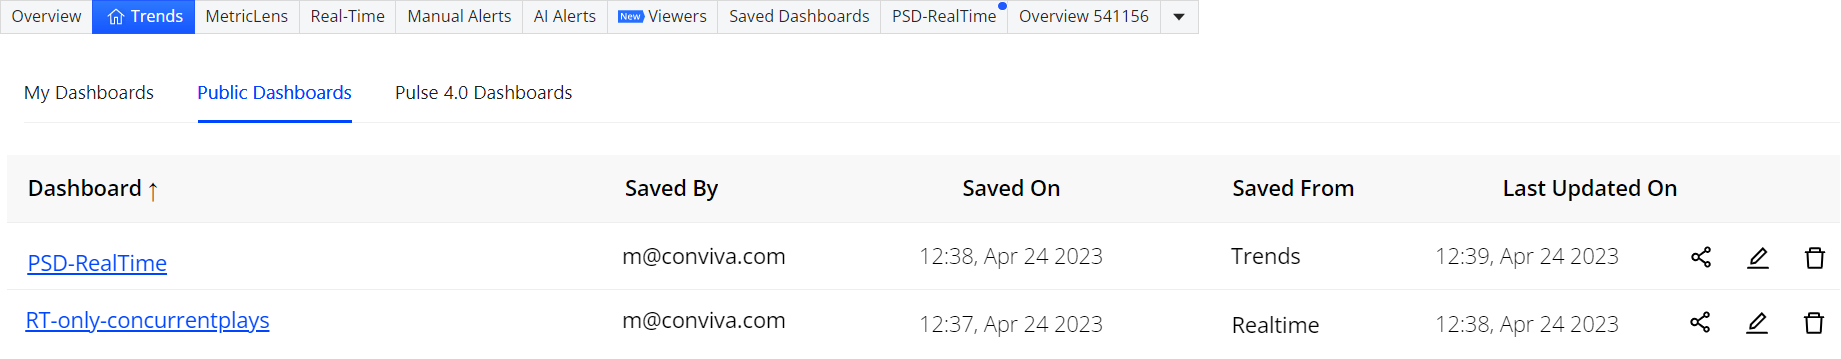
Saved Dashboards appears in the Saved Dashboard tab, similar to Trends.
In the Saved Dashboards tab,
-
My Dashboards displays the private saved boards.

You can edit the data after the dashboard has been saved.
For more information on save, share and delete the public saved dashboards, see My Dashboard.
-
Public Dashboards displays the public saved boards.
For more information on save, share and delete the public saved dashboards, see Public Saved Dashboard.