July 31, 2025
-
Flow Creation: Connect Host and Path for Flow Network Request Association
-
Webhooks: Enhances Webhook URL Authentication with Custom Authorization
-
AI Alerts: Supports AI Alerts for Flow Success Metrics (Beta)
-
AI Alerts: Supports AI Alerts for Min with 0/4xx/5xx Metrics (Beta)
Flow Creation: Connect Host and Path for Flow Network Request Association
|
|
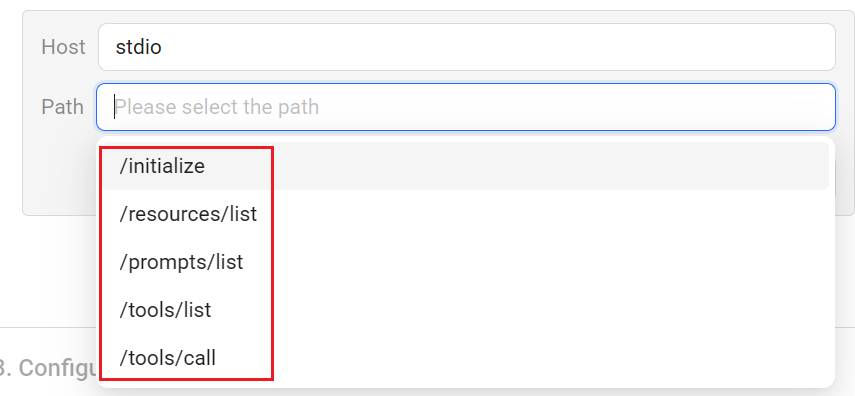
Feature Update:
Introduces display filtering for Host and Path values to improve Flow network request association. With this enhancement, selecting a value from either the Host or Path drop-down automatically shows only the compatible combinations in the drop-down, reducing the risk of selecting incompatible host-path combinations.
Click to expand the image

Use Case:
When creating flow metrics for Network Request Avg Duration, Network Request Failure, and Network Request Count, more easily select host and path values from the drop-down list.
More Details: Flows.
Flow Creation: Support for Pairing Logic Options
|
|
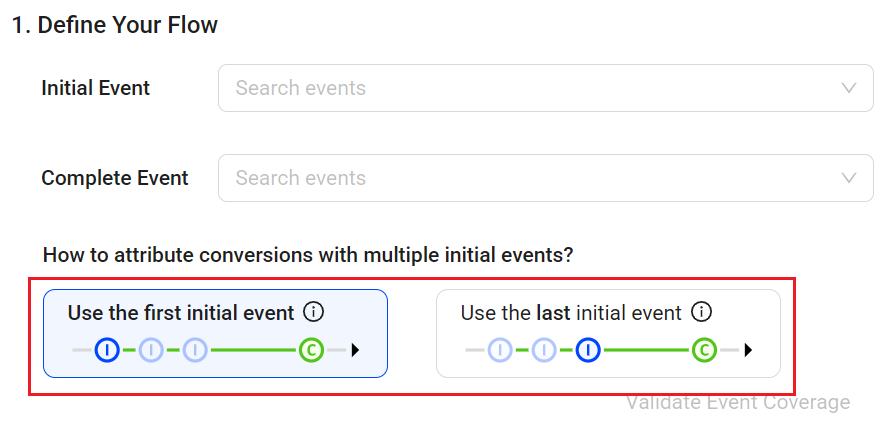
Feature Update:
Enables flow pairing logic selection for either the first or last initial event, customizing the starting point of the measured Flow experience.
Click to expand the image

Use Case:
Select the pairing logic based on the optimal journey analysis:
-
Select the first initial event when the first event attempt starts the measured flow experience. For example, select the event for the first attempt to submit payment in a payment success flow. This option includes subsequent initial events for a more comprehensive measure of related user activities in the Flow.
-
Select the last initial event when the last event attempt starts the measured flow experience. For example, select the event for the final search results prior to a video play. This option includes only the last initial event before the Flow completion for a more focused measure of user activities related to the Flow completion.
More Details: Flows.
Webhooks: Enhances Webhook URL Authentication with Custom Authorization
|
|
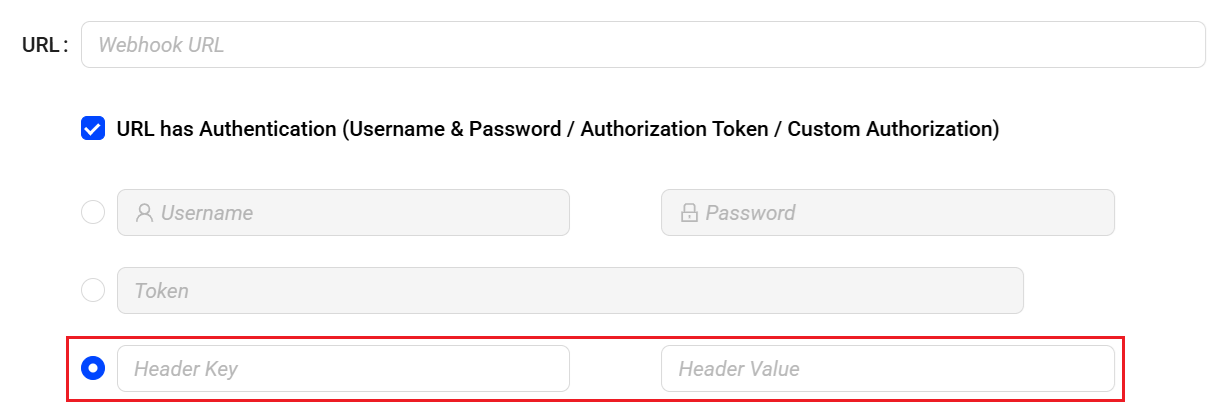
Feature Update:
Introduces an additional option, Custom Authorization to authenticate Webhook URLs securely. Admins can now provide the Header Key and Header Value to authenticate the URL, enabling more secure and flexible integration with external systems. This enhancement strengthens the overall webhook authentication process, providing a flexible mechanism for validating requests based on organisational requirements.
Click to expand the image

Use Case:
Admins can specify a unique header key and value recognized by the internal server. Header-based authentication reduces the risk of spoofing or unauthorized triggers and ensures compliance with internal security protocols, without requiring changes to external webhook configurations. This method supports stringent authentication requirements when the receiving server expects specific authorization.
More Details: Webhooks.
AI Alerts: Supports AI Alerts for Flow Success Metrics (Beta)
|
|
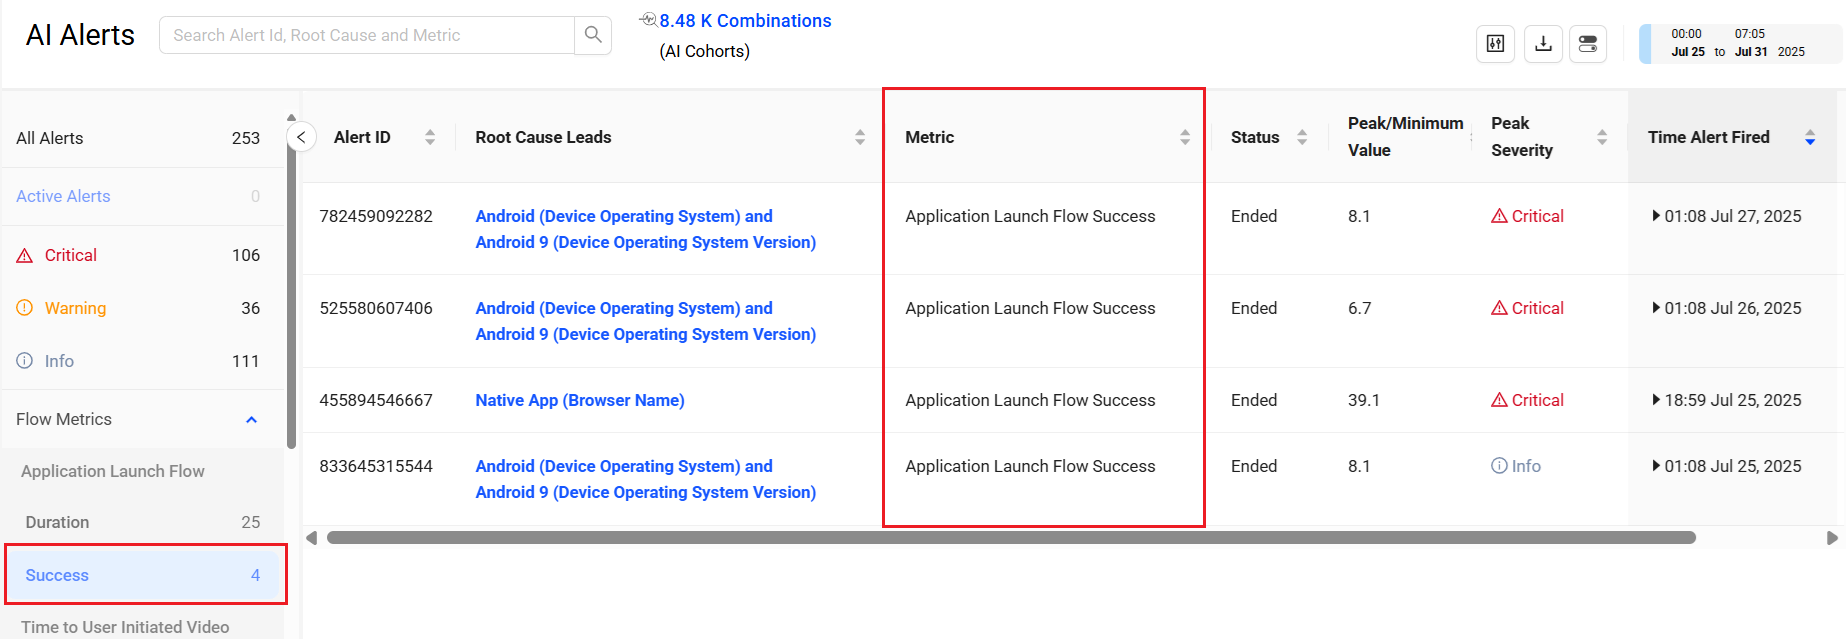
Feature Update:
Introduces AI Alerts for Flow Success Rates that trigger when the success rate degrades below the configured success level. These AI alerts provide proactive notifications based on the flow success rate and the configured persistence. Conviva DPI lists each success alert on the AI Alerts page and adds alert indications to the flow time series with links to the AI Alert Diagnostics for detailed analysis and impact insights.
Click to expand the image

Use Case:
Monitor the flow success rates for proactive notification when the flow success rate degrades below the configured success rate and persistence. For example, create an AI alert for the login success flow and receive a notification when the login success rate drops below the configured rate. Utilize the AI Diagnostics to identify the root cause and maintain high application availability.
More Details: AI Alerts.
AI Alerts: Supports AI Alerts for Min with 0/4xx/5xx Metrics (Beta)
|
|
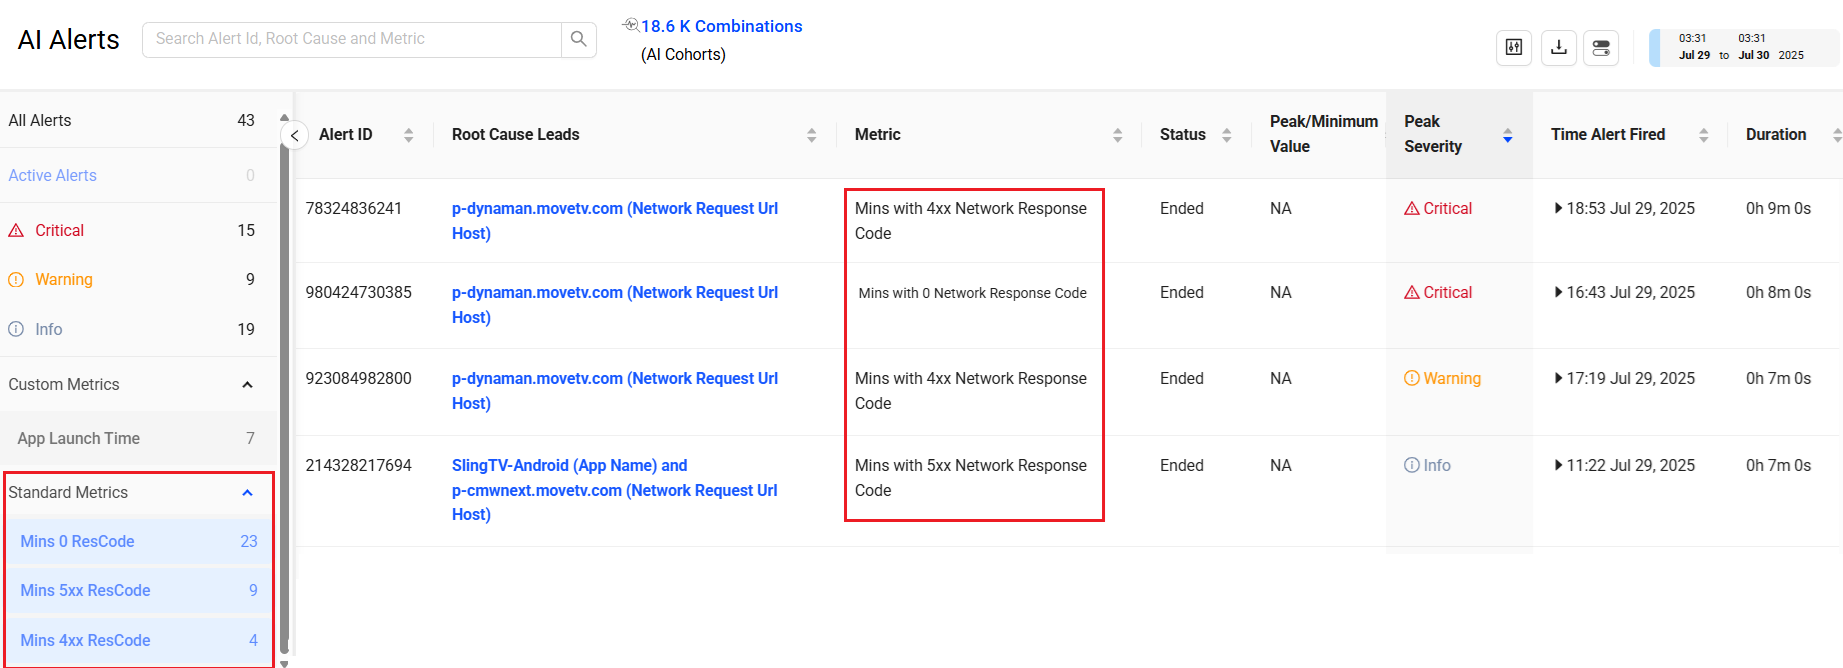
Feature Update:
Introduces the AI Alerts notification for Min with 0/4xx/5xx network request response code metrics. These AI alerts serve as proactive notifications based on issues with HTTP response code processing, client-side request handling, and service-side request response failures, as well as the configured persistence level. Conviva DPI lists each Mins with x Network Response Code alert on the AI Alerts page, adding alert indications to the flow time series with links to the AI Alert Diagnostics for detailed analysis and impact insights.
Click to expand the image

Use Case:
Monitor the network request response code for proactive notification when the performance drops below the threshold. For example, create an AI alert for 5xx response codes and receive the notification for server-side response failures. Utilise the AI Diagnostics to identify the root cause and ensure optimal server-side performance.
More Details: Minutes with Network Request Response Code Metrics.
Settings: Renames Service Integration to More Channels
|
|
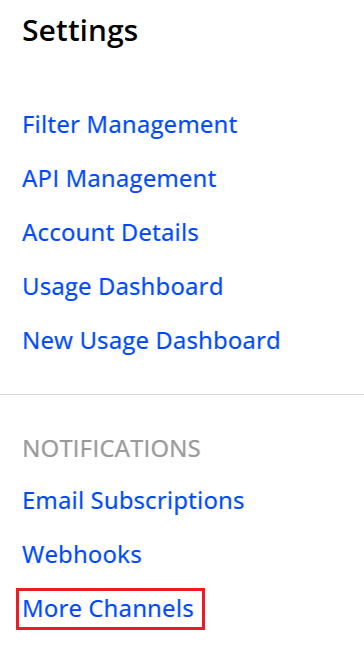
Feature Update:
Renames the Service Integration to More Channels.
More Details: More Channels.
July 22, 2025
Activation: New Sensor Remote Control Tab for Blocked Events and Configured Network Request
Activation: New Sensor Remote Control Tab for Blocked Events and Configured Network Request
|
|
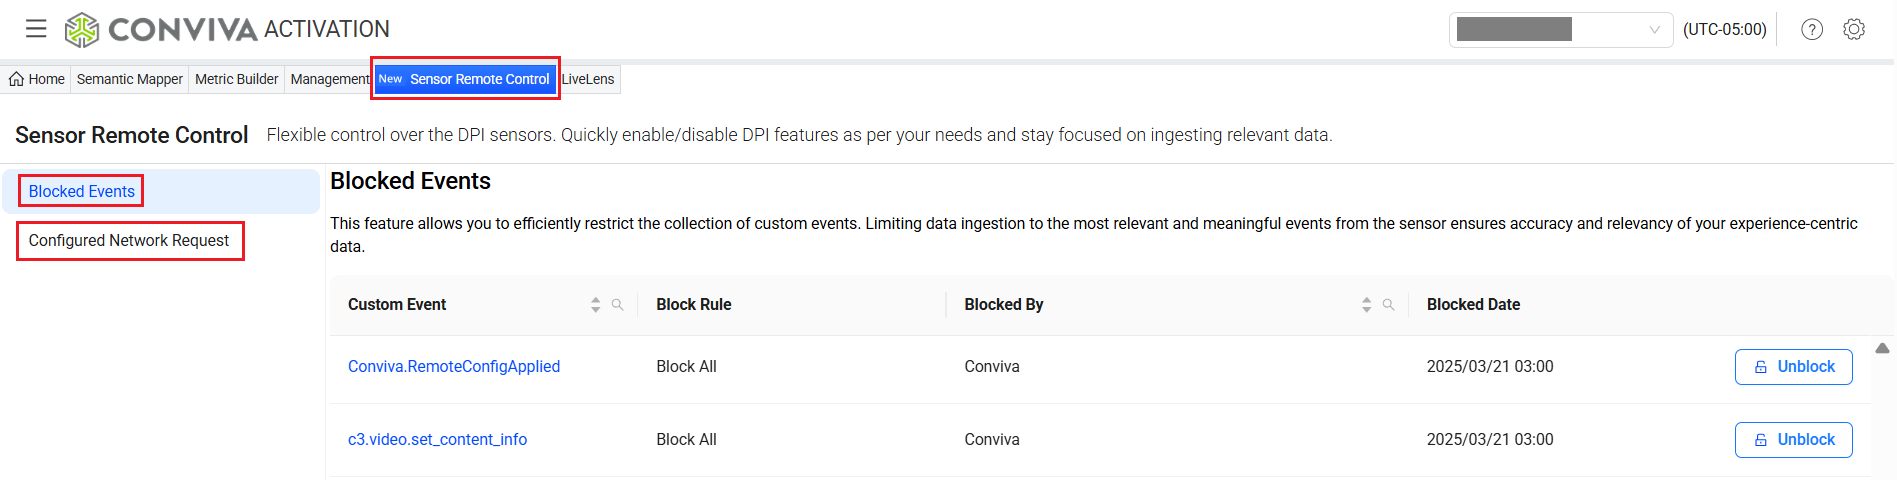
Feature Update:
Introduces a new tab, Sensor Remote Control, with the existing DPI sensor configuration options, which shifted from the Management tab:
-
Blocked Events: To set rules for blocking unwanted events.
-
Configured Network Request: To set rules for collecting specific conviva_network_request events.
Click to expand the image

Use Case:
After integrating the DPI sensor with the app, use the Sensor Remote Control tab to handle post-integration sensor configurations from one place. Define the collection rules for configuration options, like Blocked Events (to block unwanted events) and Configured Network Request (to collect specific conviva_network_request events).
More Details: Sensor Remote Control.
July 3, 2025
-
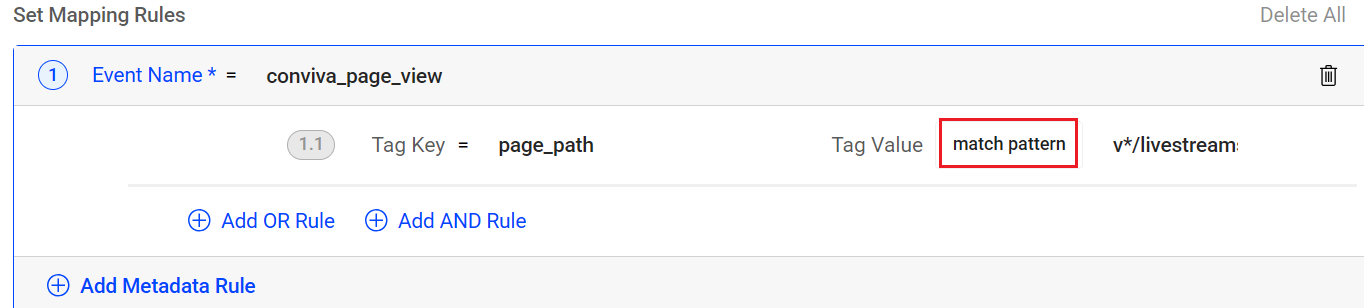
Semantic Mapper and Metric Builder: New Filter Operator – Match Pattern
-
Trends: Updated Calculation of Critical and Non-Critical Error Percentages
-
Trends: Enables Secondary Filters for Flow Avg Network Request Duration Metrics
-
Presets: Introduces New Web and Mobile Experience Presets (Beta)
Semantic Mapper and Metric Builder: New Filter Operator – Match Pattern
|
|
Feature Update:
Enables a new match pattern operator to support more flexible event mapping.
Note: The asterisk (*) wildcard represents one or more characters, depending on the data, and must be used with other characters, such as v*/livestreams to represent v1/livestreams or v2/livestreams. A standalone asterisk as a match pattern is not supported. The metadata names, including Cities, Countries, and States, do not support the match pattern operator.
Click to expand the image

Use Case:
To track views of livestream experience pages across all versions, instead of listing each version, simply use: page_path, match pattern, /experience/v*/livestreams.
More Details: Semantic Mapper.
Trends: Updated Calculation of Critical and Non-Critical Error Percentages
|
|

Feature Update:
Updates the calculations for Critical Error %, and Non-Critical Error % to align with the overall Error %. This update improves clarity and consistency in error reporting.
Note: Error %: Number of Flows with errors divided by the total number of Flows.
Critical Error %: Number of flows with critical errors that caused the conversion to fail, divided by the total number of flows.
Non-Critical Error %: Number of Flows with non-critical errors divided by the total number of Flows.
Click to expand the image

Use Case:
Use metrics such as Critical Error % and Non-Critical Error % to understand how errors impact flow completion. To prioritize fixes, focus on Critical Error %, as these are more related to conversion failure.
More Details: Trends.
Trends: Enables Secondary Filters for Flow Avg Network Request Duration Metrics
|
|
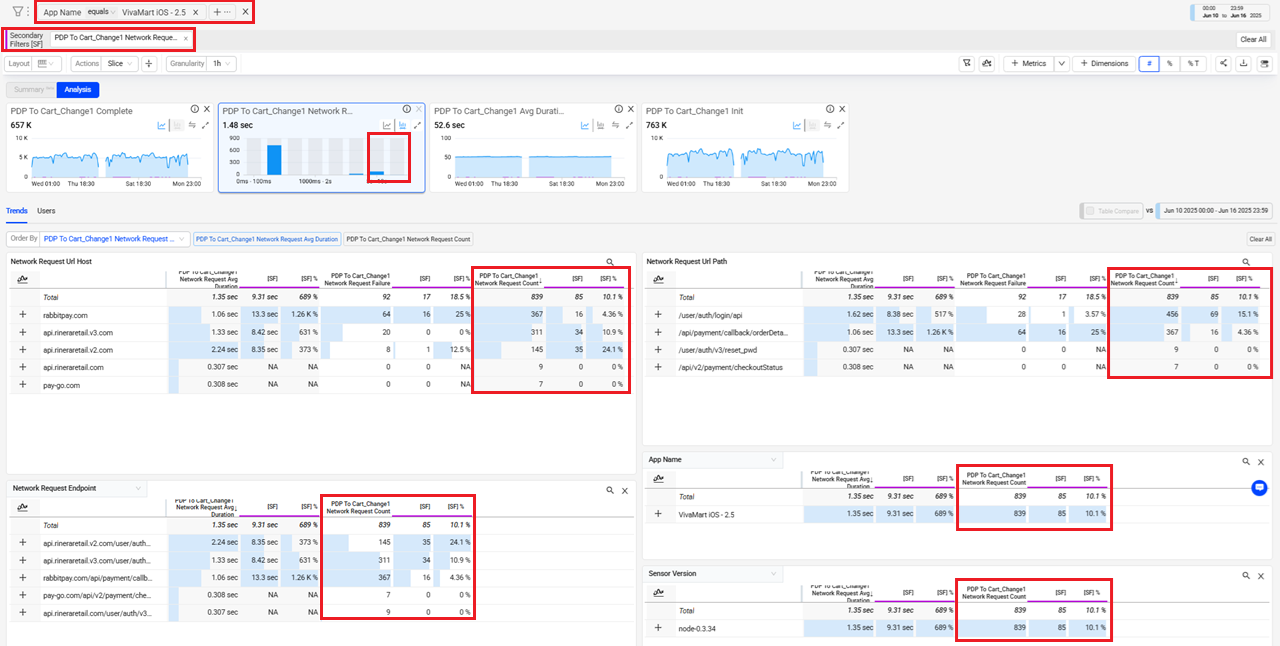
Feature Update:
Enables secondary filtering on the Flow Avg Network Request Duration metrics. Use a distribution of average request durations to select a secondary filter data range, such as durations greater than five seconds. The distribution ranges provides an easy way to focus the data selection on specific sets of durations, e.g., long-duration network requests that may require higher priority.
The Trends dashboard displays the secondary filter values with a purple line in the time series view and underlined columns in the dimension tables.
Click to expand the image

Use Case:
Analyze the PDP To Cart_Change1 Network Request Avg Duration metric for platform-specific PDP to Cart data, and apply a secondary filter to highlight the long average durations to determine the scope and severity of the long durations.
-
Select this metric and set VivaMart iOS - 2.5 from the App Name dimension data as the primary filter.
-
Click the distribution icon next to the PDP To Cart_Change1 Network Request Avg Duration metric, and select the distribution range >= 5 seconds to apply a secondary filter.
In this example, applying a secondary filter with a duration of 5 seconds or more enables a comparison of the success rate between the overall network request and the subset of sessions with long durations. This primary and secondary filter combination displays the primary filter data alongside the secondary filtered data, highlighted in purple. In this case, the secondary filter highlights the long-duration network requests generated by the VivaMart iOS-2.5 app, which affect overall network performance.
More Details: Trends.
Presets: Introduces New Web and Mobile Experience Presets (Beta)
|
|
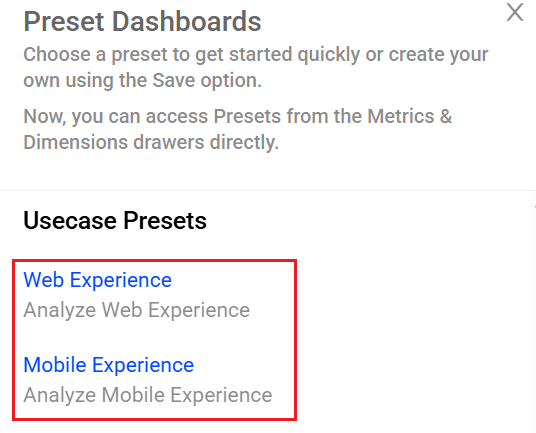
Feature Update:
Introduces new presets for Web Experience and Mobile Experience, to accelerate experience-based data analysis and anomaly detection. Each preset includes a predefined set of key metrics and corresponding dimension data, offering a structured starting point for investigating trends and identifying issues across critical user experience areas. These presets reduce setup time and promote consistent data analysis across teams.
Click to expand the image

Use Case:
Select a platform type as the primary filter and use the presets to gain quick insights into user experiences on that platform.
Set the primary filter to Platform equals to Web and use the Web Experience preset to display Web experience metrics, such as page load time, web errors, active devices, and sessions, segmented by page and web attributes. Similarly, set the primary filter to Platform equals to Mobile and use the Mobile Experience preset to highlight Mobile experience metrics, including screen load time, crashes, and ANRs, segmented by app, device, and screen title.
These presets support efficient issue detection, performance optimization, and root cause analysis, enabling faster resolution of user-impacting issues across web and mobile platforms.
More Details: Presets.
Metrics: New User Session and Active Time Metrics (Beta)
|
|
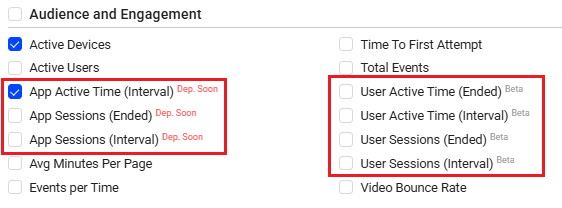
Feature Update:
Enhances the Audience and Engagement metrics in Trends with new user session and active time metrics:
-
Users Sessions Metrics:
-
Introduces new metrics for tracking user sessions and active user time, providing more accurate insights into user engagement and session behaviour:
-
User Sessions (Interval)
-
User Sessions (Ended)
-
User Active Time (Interval)
-
User Active Time (Ended)
-
Note: Conviva Sensors for Android, iOS/tvOS, and JavaScript support these metrics.
-
-
App Sessions metrics:
-
Renames the following metrics to segregate the users and app session metrics.
-
Active Time is renamed to App Active Time (Interval)
-
Sessions metric is renamed to App Sessions (Interval)
-
Ended Session Count is renamed to App Sessions (Ended)
-
Note: These renamed app session metrics will be deprecated soon.
-
Click to expand the image

Use Case:
Use the new user session metrics to identify usage patterns associated with a session.
Similarly, use the renamed app session metrics to evaluate app engagement and retention details. Also, track the active session count, total active time, and average session duration to identify peak usage periods, quantify engagement levels, and evaluate user engagement. Utilize the session interval breakdown to analyze shifts in session length.
More Details: DPI Metrics.