The Mins with x Network Request Response Code metrics help to analyze the different types of network request performance issues in app sessions based on the number and percentage of one-minute intervals during which the performance issues occurred. These metrics categorize performance issues based on issues with HTTP response code processing, client-side request handling, and service-side request response failures.
-
Mins with 0 Network Response Code
This metric indicates the impacted minutes in app sessions where network request failures occurred with a response code of 0, indicating issues like timeouts or requests that did not reach the server, causing a network request failure or an aborted request before a valid HTTP response was received and processed. Root causes often involve a client-side issue or a problem preventing the connection from being established or maintained.
-
Mins with 4xx Network Response Code
This metric inidcates the impacted minutes in app sessions with network request failures and response codes between 400 and 499, indicating client-side errors caused issues with the client's request that prevented a valid server response. Root causes often involve malformed or invalid request bodies or authorization/resources access.
-
Mins with 5xx Network Response Code
This metric indicates the impacted minutes in app sessions with network request failures that have response codes between 500 and 599, indicating server errors that preventing the server from fulfilling a valid request from the client.
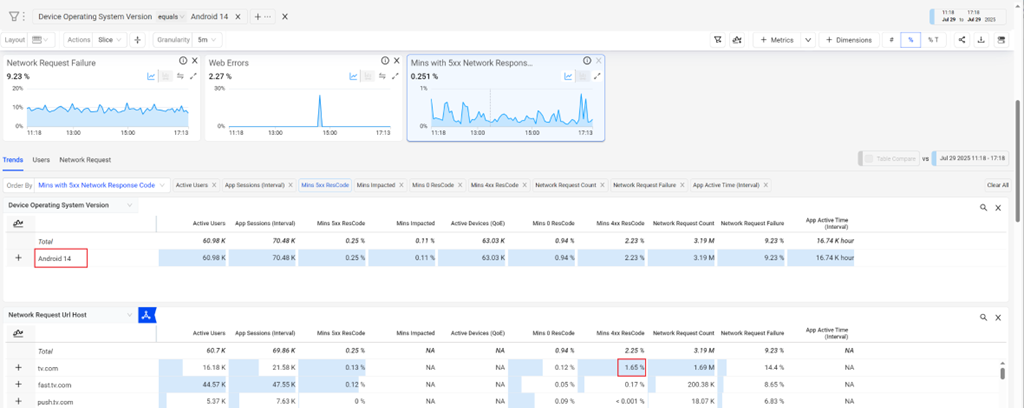
These metrics highlight the frequency of response code impacts and enable proactive notifications and cross-dimensional drill-downs to isolate the duration of network request performance issues across different dimensions. Set up AI Alerts for Mins with xxx Network Response Codes to enable real-time alert messages and time series alert markers. For example, starting with a highly impacted device OS version, analyze response code impacts across network request URL hosts, paths, and endpoints to quickly focus on the most likely root cause of the persistent network request issue.
Secondary Metric
These metrics apply ‘Minutes of Active Time’ as the secondary metric to frame the scope of the impacts with the amount of active user time. The Minutes of Active Time secondary metric also functions as the denominator in the percentage metrics, calculated by dividing the minutes with x response code by the minutes of active time during the selected time period. The percentages help isolate how prevalent the network request performance issues were across different dimensions.
AI Alerts
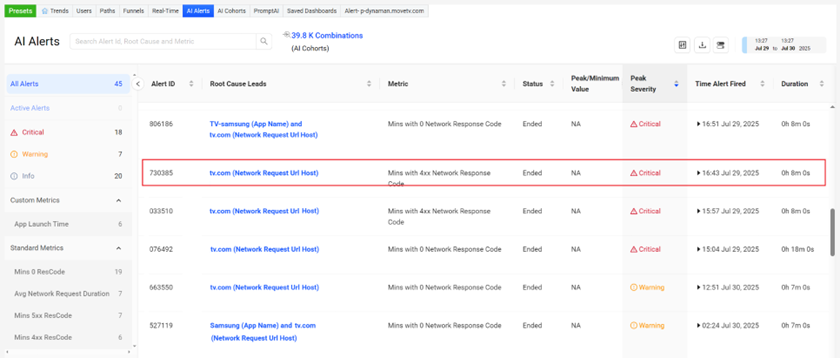
AI alerts for Mins with x Network Response Code metrics help shorten time to resolution with proactive notifications based on configured persistence levels. Conviva DPI continuously checks for network performance issues that exceed the configured persistence levels and when exceeded, proactively fires an AI alert for the affected network request codes, alerting users to continuous critical user experience impacts as they happen.
For each generated Mins with x Network Response Code alert, DPI lists the alerts in the AI Alerts page and inserts the timeline markers in the related metric time series with links to a AI alert diagnostics page for detailed alert analysis with focused dimension drill-downs along with analysis of impacted users and network requests.
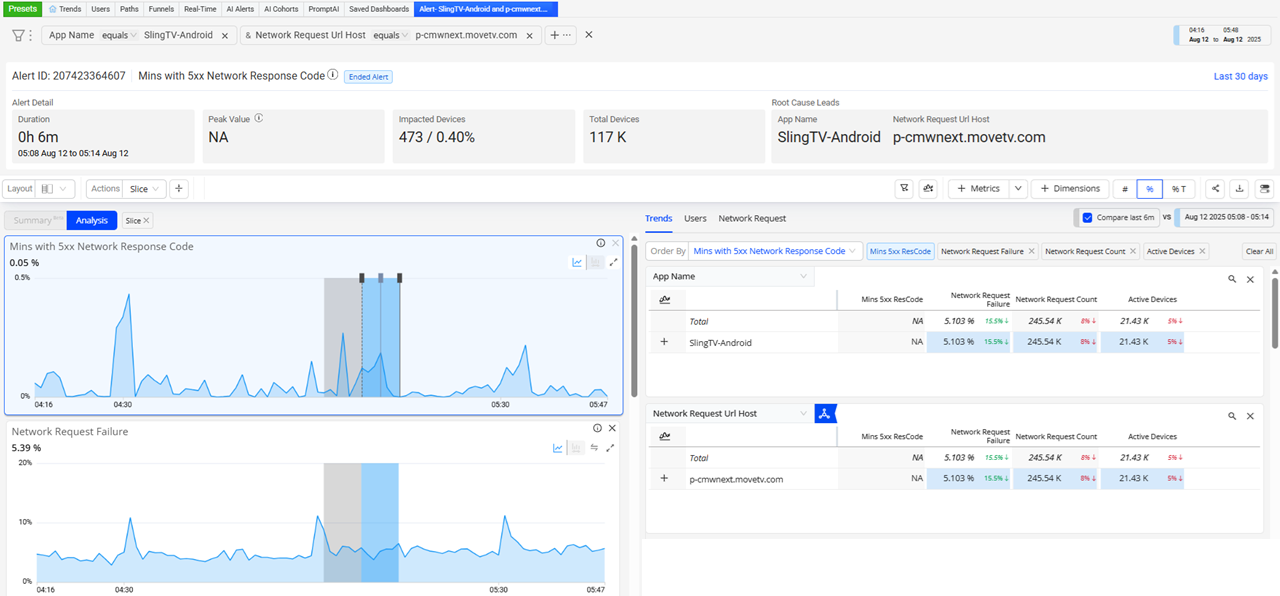
Note: Since the AI alerts for Mins with xxx NWR Response Code metrics track the frequency of 1-minute intervals with these response codes, rather than analyzing past behavior patterns, the system does not display the alert threshold, baseline, or impacted device levels.
Mins Response Code Metrics Mins Response Code Metrics Mins 0 Response Code Metrics Mins 4xx Response Code Metrics Mins 5xx Response Code Metrics