Conviva VSI use cases provide a hands-on way for customers to quickly implement key Conviva VSI feature scenarios.
 Analyzing Issues and Traffic Patterns in AI Alerts
After a recent AI alert impacting several cities serviced by a specific ISP and CDN, monitor the traffic from that ISP and CDN across the impacted cities to verify the issue is not recurring.
To apply instant filtering, create a combinatorial instant filter to analyze traffic patterns within that alert group (CDN, cities, players, browser versions). This combination of known filter rules spans a variety of dimension values using both AND and OR logic, so use the combinatorial filter options to build these filtering settings.
Mouse over and click the highlighted + symbol next to the target ISP, CDN, and city dimension values. The selected combinatorial filter settings appear in the Combinatorial Filter bar, with filter rules within the same dimension, such as ISP and CDN, applied using logical OR rules, and filter values across different dimension values within the same dimension, such as cities, applied using logical AND rules.
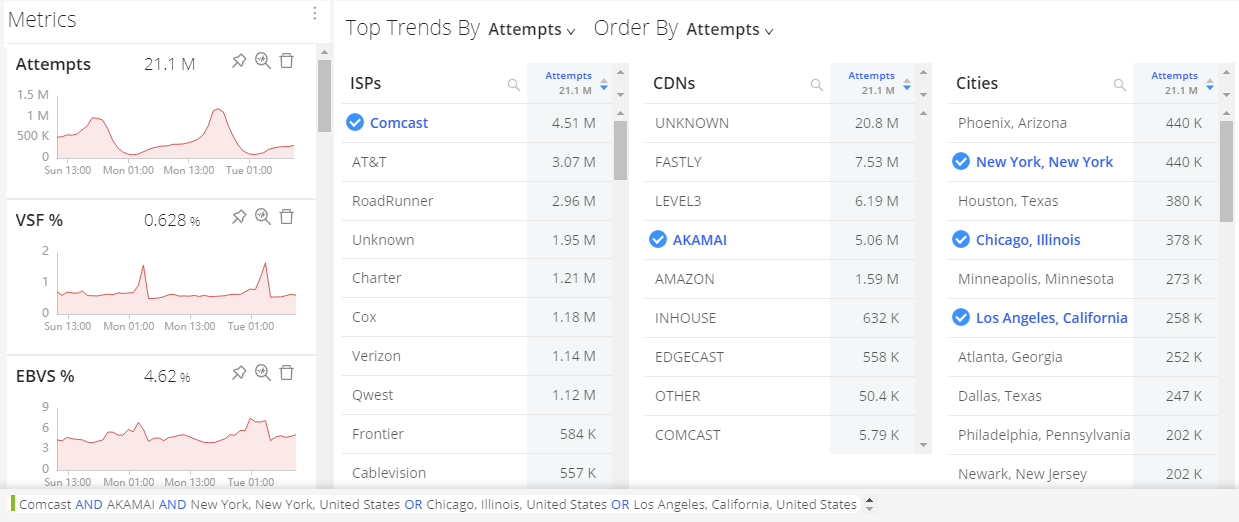
For more details, see Trends Dashboard, AI Alerts, One-Click Filters, Combinatorial Filters, and Diagnostics and Distributions.
Monitoring New Player Versions
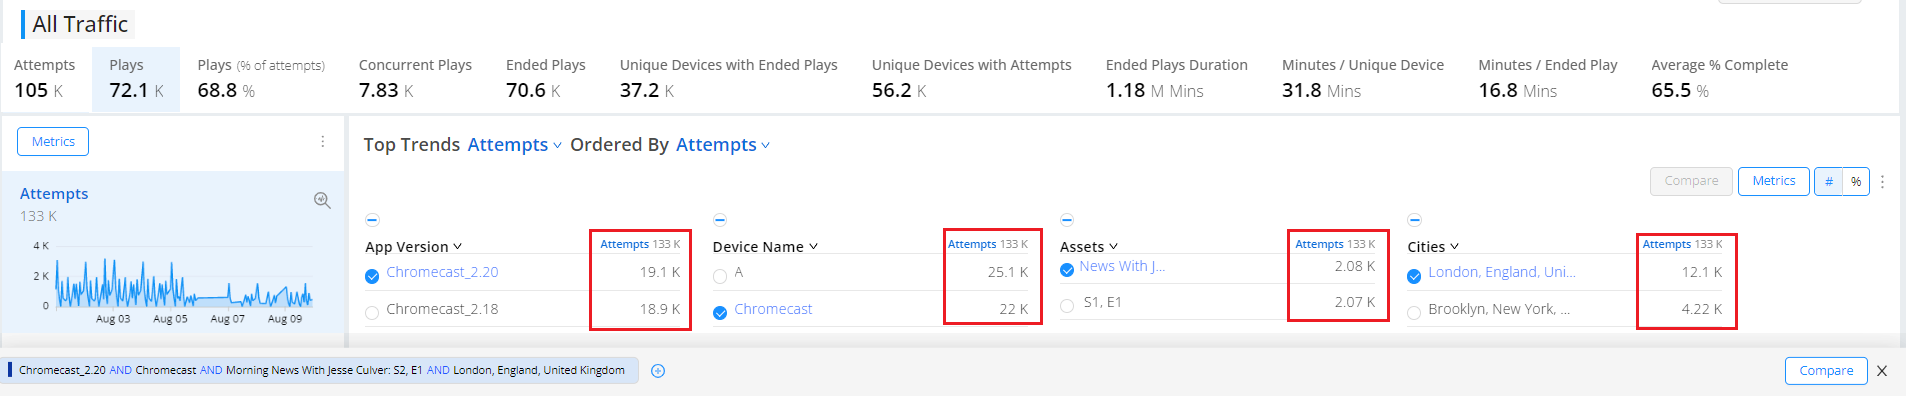
After a new player version is deployed, monitor player performance for indications of compatibility issues.
To apply instant filtering, click the player in the Player dimension. This applies a one-click instant filter for that player. Next, add additional filter settings based on the metric values for the most impacted city, asset, or other dimension. Select different Order By metrics and dimension values to toggle between the most impact dimension values for that player. Clicking the highlighted dimension values applies logical AND filter rules to collectively view the player performance across those cities.
Be aware that when clicking a highlighted dimension value, not the + sign, adds a filter value to the current filter settings, applying logical AND filter rules.
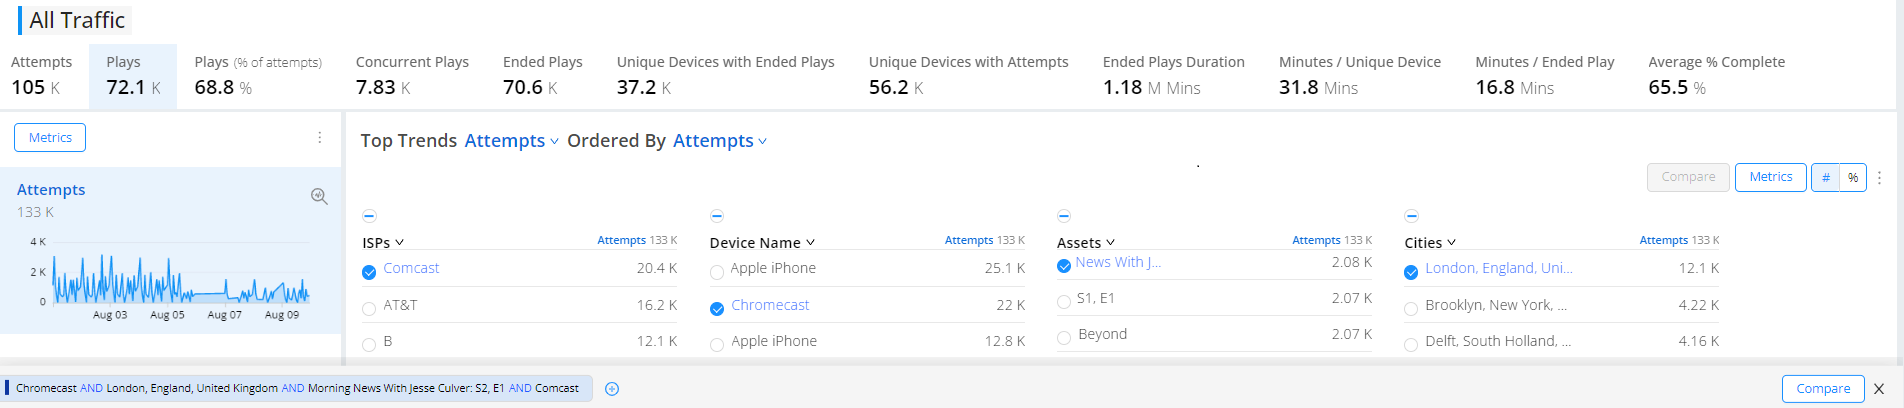
For more details, see Trends Dashboard, One-Click Filters, and Combinatorial Filters.
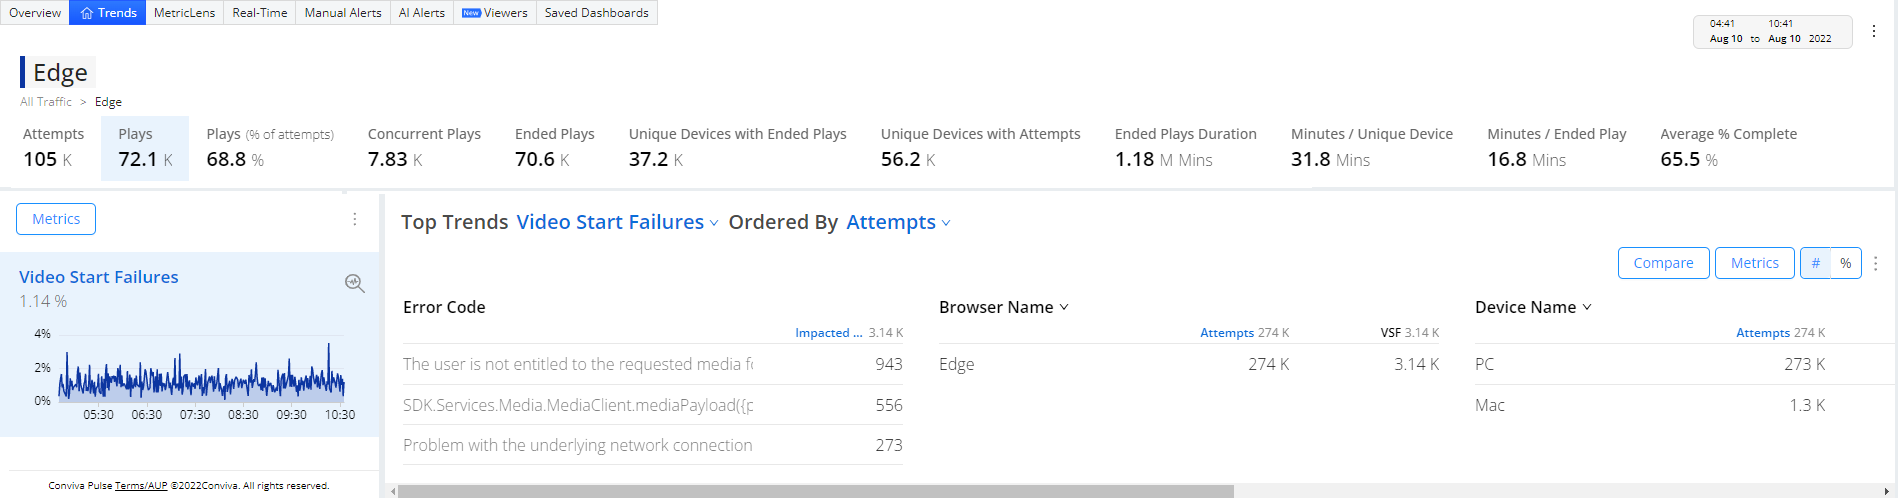
Verify Browser Performance
After a new version of a browser is deployed, analyze the browser performance for VSF errors to verify the deployment and streaming for viewers using the new browser in different cities.
To apply instant filtering, simply click the new browser version in the Browser Version dimension list. This applies a one-click instant filter for that Browser. Next, analyze the VSF metric for each of the top impacted cities to look for a high rate of VSFs. Repeat this process for other browsers versions and cities.
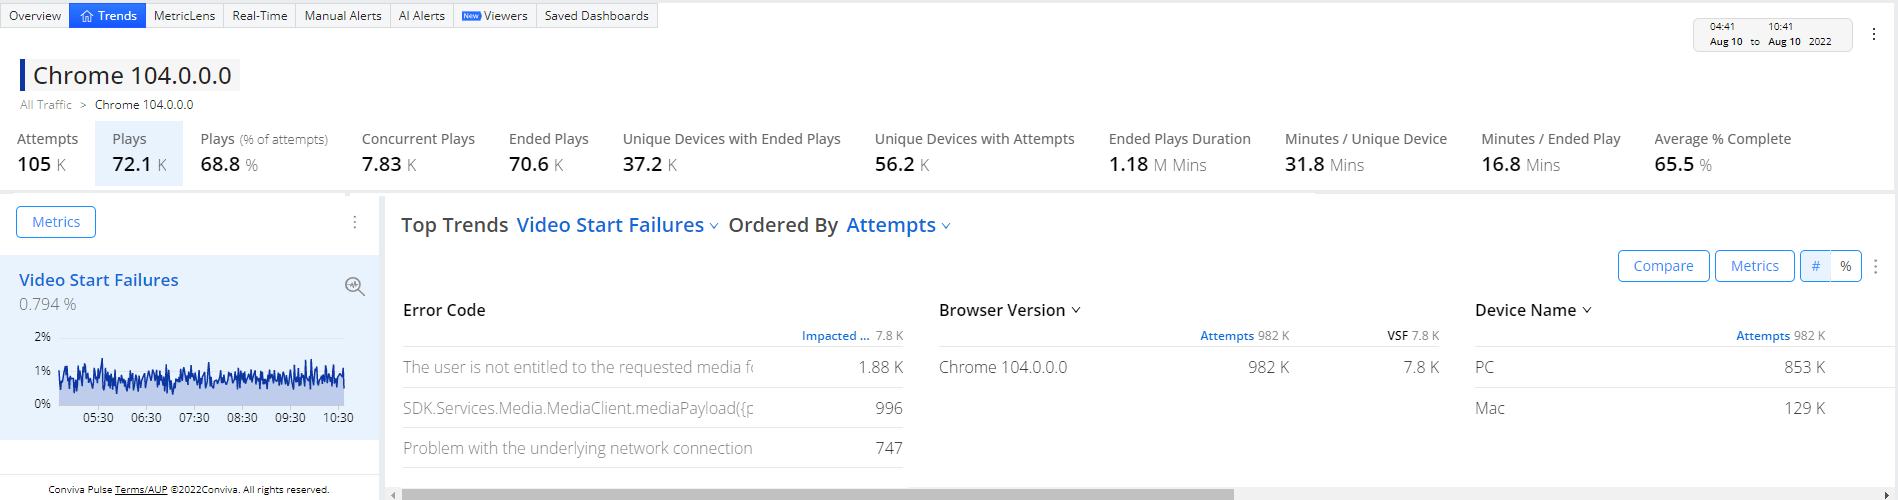
Consider other dimensions to quickly build logical AND filters across the support dimensions and expand the scope of your analysis.
For more details, see Trends Dashboard, One-Click Filters, and Combinatorial Filters.
Comparing Streaming Performance
Using the Compare feature makes it easy to metric time series side-by-side for comparative dimension analysis, such as different streaming events, players, or assets. .
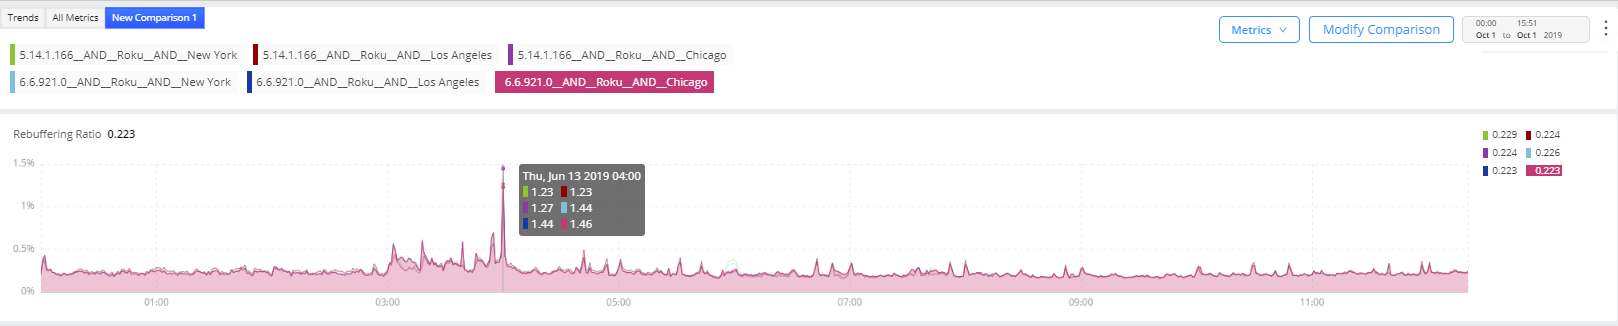
This scenario sets filters to compare Rebuffering Ratio across two application versions on Roku devices in multiple cities to analysis and isolate rebuffering to a specific application version.

For each application version, click the version in the Application column, select Roku as the device, and select a city. Repeat this for each version and city.
This creates six filters in the filter panel for comparison.

Click Compare in the bottom Filter bar to view the comparison time series. In the Comparison dashboard, note the spike in rebuffering on version 6.6 on Roku devices in the Chicago area.
Click the kebab icon to Share, Save and/or Export the dashboard for re-use and collaboration. You can also make this page your default home page.
![]()
For more details, see Trends Dashboard, One-Click Filters, Combinatorial Filters, and Comparison Example.