This use case demonstrates a common scenario using the comparison filtering to isolate metric anomalies across multiple dimensions.
This scenario sets filters to compare multiple metrics, such as Rebuffering Ratio and VPF, across several browsers and devices in multiple cities to analysis and isolate performance issues.
Click Compare to initiate the Compare filter selection.
-
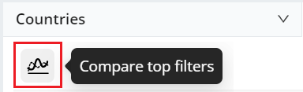
Click Compare top filters on the dimension data table.
The top ten filters are displayed in the Compare Filters bar and the diagnostic metric widget displays the filters in different color codes to enable comparative analysis.
In this example, the High Startup Time is compared across the top ten country filters, also including All Traffic.

-
You can click the Expand Icon to see the full table.

-
Click the drill-down icon to see the filter dashboard for further data analysis to drill down on the anomaly.
