You can easily create manual alerts, just click the Add Alert tab on the Trends page, specify the alert settings, and click Save. In order to simplify the process of creating an alert, specify the basic settings on the first alert display, the more advanced settings are on the second display. Advanced settings depend on the metric you choose – there are different default values for each metric, each of which is calculated to provide the optimal balance between the minimum size of the sample and frequency of notifications.
Note: Before you create an alert, consider several factors for optimizing your alert notifications and responses.
-
It's a good idea to know what your traffic patterns are in order to set meaningful thresholds and samples. It might take several weeks before clear patterns emerge.
-
There's a trade-off when you set a threshold. If you set a higher threshold, the alert will be triggered less often and notification emails will not go out as often. The downside to having a higher threshold is that the condition will become more severe before the alert is triggered and you're notified. It might take some tweaking to find the right balance for your organization.
-
Configure the business logic settings to highlight which video playback failures and video start failures were trigger by business rules or actual technical issues. For more details, see Business Error Configuration.
To create an alert:
Click the Alerts tab in the tabs section. 
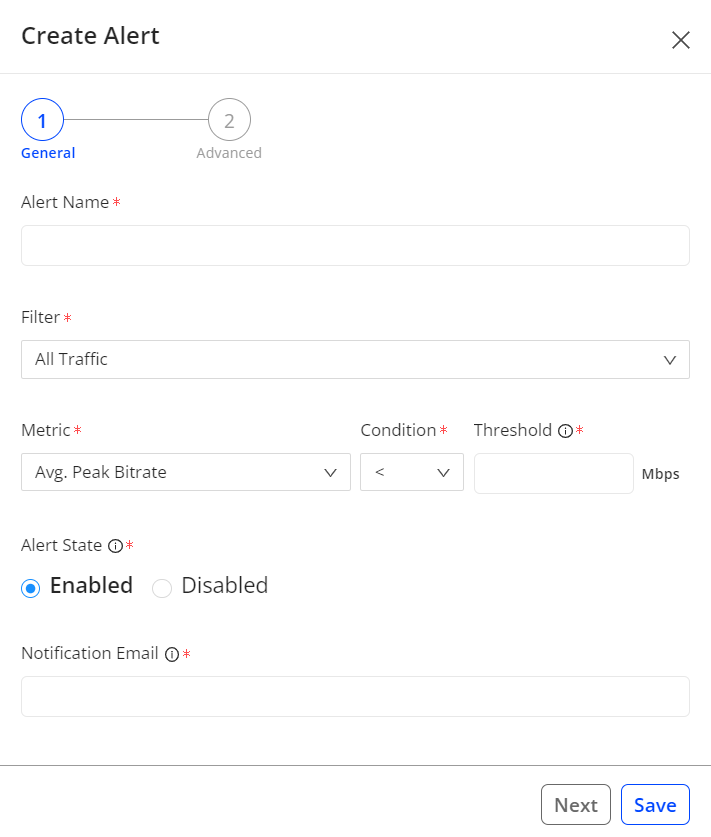
The Alerts appear. Click Create Alert to display the options for creating an alert.
-
Alert Name: Enter a name for the alert, between 3 and 256 characters. Make the alert name as descriptive as possible. The name appears in all of the Alerts pages and in alert emails, so a descriptive name will help you and the email recipients distinguish between various alerts. You can always edit the alert name if needed.
-
Filter: Select the required filter to focus the alert condition on specific types of traffic (Live, VoD) and other filter criteria such device type or asset. The filter determines the traffic segment to monitor for this alert.
-
Metric: Select the metric and set the condition and threshold for the alert condition. of the quality metrics described above and any MetricLens filter for your account. Choose a condition type (< or >) and enter a threshold value that when crossed will trigger the alert. The units are based on the metric you choose. Video start and playback failure metrics are available to help you distinguish issues that occurred because of business rules, such as expired subscription, and actual technical performance issues.
Note: Manual alerts do not support alerting based on filter conditions for failure error codes, such as VFP Error, VPF-T Error, VPF-B Error, VSF Error, VSF-T Error, VSF-B Error, AD Error, ASF Error, and APF Error.
-
Alert State: Change the state to disabled if you don't want the alert to be active immediately.
-
Notification Email: Enter a list of email addresses or email aliases for the people to be notified when the alert is triggered.
-
Click Save to save the current alert settings. Click Next to display the advanced alert setting options.
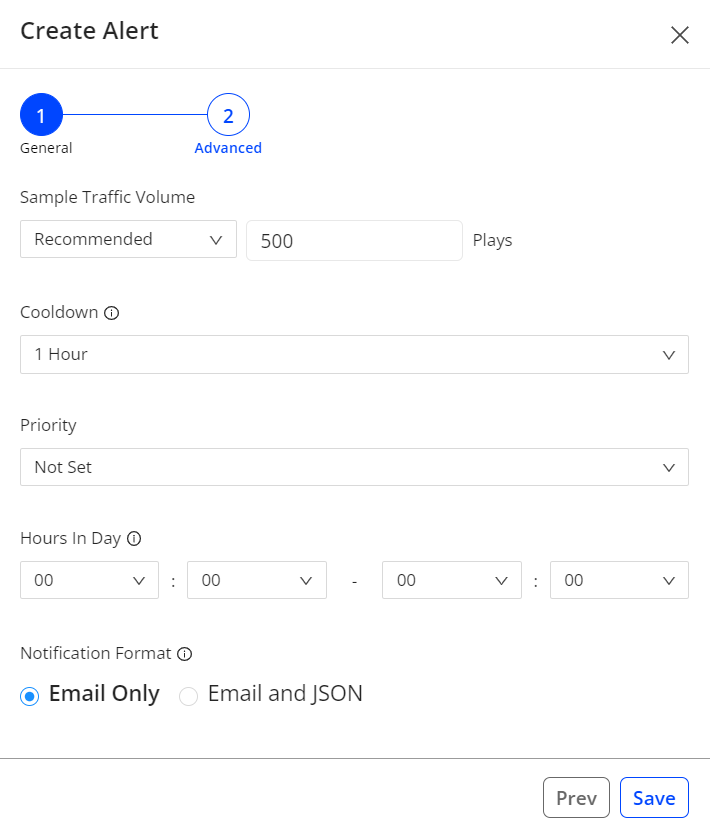
Enter the advanced alert settings.
-
Sample Traffic Volume: Use the recommended setting or select Custom to specify a different same size.
Sets the size of the data sample before the alert can be triggered. This helps ensure you only receive alerts when the number of users impacted is significant. For example, let's say you have an alert for VSF greater than 10%. The alert could trigger when you have 1 failure out of 5 attempts, which is not very interesting. If you add a required sample of 1000 attempts, you focus the alert on larger scale problems. The default setting depends on the metric you choose. To change the size of the sample, choose Custom and enter a value. -
Cooldown: Set the cooldown period. Determines how long the system waits before pinging you again for a new event on the same alert. This allows you to set the sensitivity for the alert. If it's a super-critical metric, you might want to set it for no cool down. The system continues to record activity during the cool down period; it simply doesn't ping you with new alert emails until the cool down period expires.
-
Priority: Set the alert priority as P1, P2, P3 or 'Not Set'.
-
Hours in Day: Set the hours during which alerts can be generated. The allows you to limit alert notifications by settting blackout periods during which alerts will not be generated.
-
Notification Format: Set the notification as email or email with JSON data.
JSON Data Example
If you select Email and JSON notification format option, JSON data for the alert is included with the alert email. To view the included JSON data, your email program must be able to parse JSON data. For example in Gmail, open the alert email and select the Show original email option. Then, scroll to view the raw email information, including the JSON data.
For example, this JSON data was included with a rebuffering error.
|
{"alert": {"condition": {"type": ">", "value": 1.0}, "cool_down": "1 hour", "filter": {"id": 52739, "name": "Country!=USA"}, "id": 5495, "name": "Rebuffering-Error", "priority": "Not set", "quality_metric": {"name": "Rebuffering Ratio", "units": "%"}, "samples": {"metric": "Concurrent Plays", "units": "plays", "value": 500} }, "event": {"id": 26619877, "quality_metric_value": 6.16, "samples_value": 3215, "timestamp": "Jan 30 2018 13:08", "url": "https://pulse.conviva.com/customer_switch/1928808/?next=3D%2Freports%2Fdiagnostic%2F%23alert%3D5495%26event%3D266198"}, "version": "2.0"} } |
| Key | Indicates: |
|---|---|
| "type" | Alert condition type as > greater than or < less than the configured condition value. |
| "value" | Alert condition value, as a positive number, applied to the condition type. |
| cool_down | How long the system waits before pinging you again for a new event on the same alert. |
| fitler:"id" | Filter used to define the alert condition. |
| filter:"name" | Filter name used for this alert. |
| "priority" | Priority set for the alert. P1 is typically the most severe alert. |
| quality_metric:"name" | Name of the quality metric that triggered the alert. |
| quality_metric:"units" | Units of the quality metric that triggered the alert. |
| samples:"metric" | Name of the sample metric used to calculate the alert. |
| samples:"units" | Units of the sample metric used to calculate the alert. |
| samples:"value" | Value of the sample metric at the time the alert fired. |
| event:"id" | Unique ID of the specific event for which you are receiving this manual alert. |
| event:"quality_metric_value" | Value of the quality metric that triggered the alert, at the time the alert fired. |
| event:"samples_value" | Sample value, at the time the alert fired. |
| event:"timestamp" | Date and time the alert fired. |
| event:"url" | Link to the diagnostic page to analysis the root cause of the alert. |
| version |
Version number of the manual alert JSON format. Format: "Major.Minor.Revision" |
For more of an overview of alerts, see
Creating Manual Alerts