There are several ways to view alert-based diagnostics:
-
From the Manual Alerts page, click an alert link to view the related time series and diagnosis the events for each alert that occurred in the specified period. The Diagnostics page displays alert time series and metric data about the events.
-
From an Alert email notification. Click the link in the alert email and the Diagnostics page displays information and metrics for the event you received email about.
-
From the Diagnostic page. Use the alert slider to enabled the alert information display. Visual indicators in the metric timeline show when alerts were generated. Hover over an alert indicator to display the alert details.
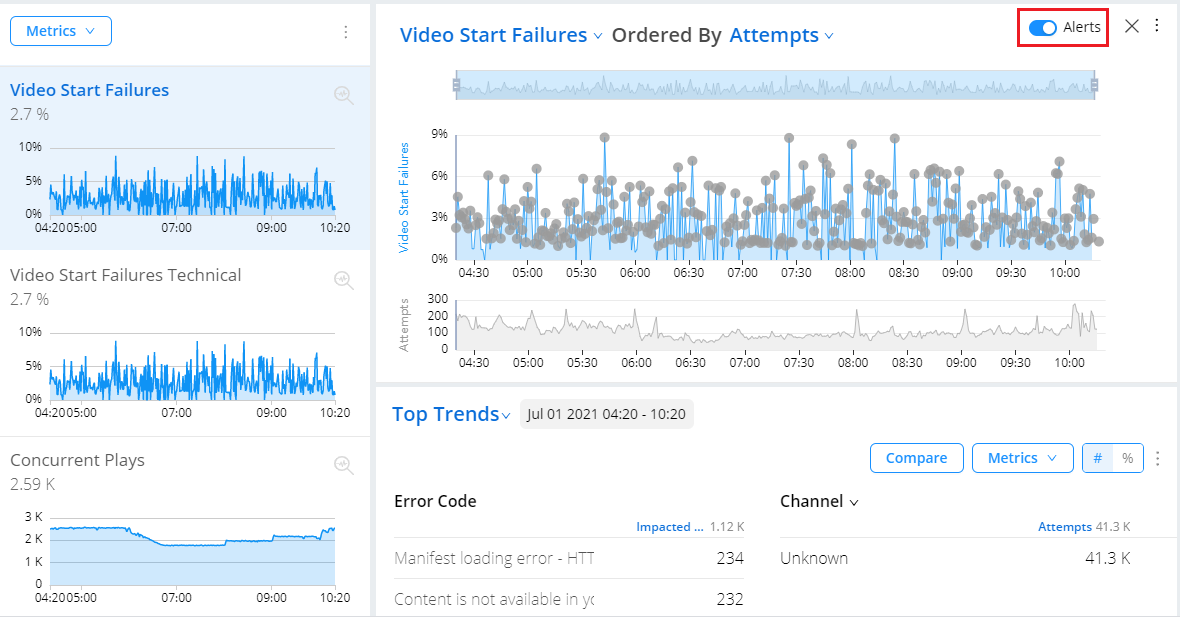
The main timeline shows all of the activity during the selected time segment, with dots to indicate events. Select an alert dot to display date and time of the alert along with the impacted dimensional data. The shaded analysis marker highlights the interval during which a selected alert occurred.
Click the alert kebab icon to edit the alert settings.
For more of an overview of alerts, see:
Diagnostics
Manual Alerts within the metric widget time series, provides the vertical bar indication of the alerts. Click the bar to jump directly to the Manual Alert diagnostics to analyze alert frequency and details. For more information on diagnostics of the AI alerts, see Manual Alert Diagnostics.