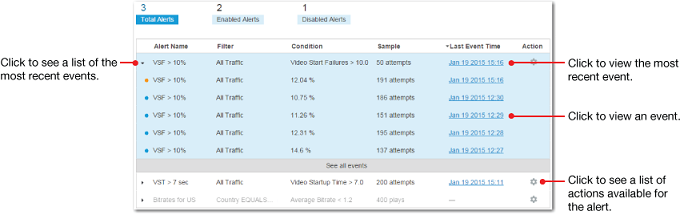
The Manage Alerts page shows you a list of all the alerts defined for your account. For each alert, you see the alert name, the filter used, the metric being monitored, and the minimum sample required to trigger the alert. You also see the date of the most recent event for the alert and an Action menu.
For more of an overview of alerts, see Alerts.
Alerts can have one of two status states: enabled or disabled.
- Enabled means that the alert is monitoring data and ready to fire.
- Disabled means that the alert is turned off. Nothing is happening.
Note: There is a third transient state, cool down, where the alert is monitoring data but is not sending emails. This state starts when an alert is triggered and ends when the cool down period for the alert is over.
- The arrow to the left of the alert name displays the five most recent events.
- An orange dot indicates that a notification was sent for the alert.
- A blue dot indicates that the event occurred while the alert was in cool down.
From the Manage Alerts page you can change the status of an alert, delete an alert you no longer want, or edit an alert, or view the corresponding Diagnostic page for each alert event.
Click these links for more information.
- Enabling or Disabling Alerts
- Editing an Alert
- Deleting Alerts
- Searching Alerts
- Viewing Alert Diagnostics
- Business Error Configuration
Enabling or Disabling Alerts
By enabling and disabling alerts you control which alerts are active at any point in time. This is in addition to the cool down period you set for each alert when you create (or edit) it. You might, for example, set up a series of alerts for upcoming events and then enable them when they're needed. Or, you could decide that you want to take a vacation from a particular alert.
The advantage of disabling an alert over deleting it is that deleting removes all data associated with an alert. Disabling an alert merely stops it from firing. Any data associated with the disabled alert is subject to the normal data retention limits. In practical terms, you can go back and look at the events for a disabled alert, but not for one that has been deleted.
In the Manage Alerts page, you can use the links at the top of the page to display all alerts, only alerts that are enabled, or just disabled alerts.
To enable or disable alerts
- Click the Action control for the alert you want to enable or disable.
- Click Enable or Disable.
The status for the alert changes immediately and the totals are updated the next time you refresh the page.
Editing an Alert
There's a fine art to creating the perfect alert: one that tells you what you need to know without burying you in needless noise. Sometimes you get it right the first time; other times you need to adjust some the alert settings, such as condition value, after you see how an alert is performing. You can change the name for an alert, the condition value, the minimum sample, the cool down period, the priority, and the JSON attachment setting. You cannot change the metric, diagnostic filter, or condition. Instead, you must create a new alert that has the desired metric, filter, and condition.
To edit an alert:
- Click the Action control for the alert and clickEdit.
- Make the changes. If required, click Advanced Settings, make the changes, and click Update.
- Click Save.
Deleting Alerts
If you no longer need one or more alerts, you can delete them from your account. All data associated with the alert, including incidents and diagnostics, are also deleted. There's no way to recover this information once you delete the alert.
To delete alerts
- Click the Action control for the alert you want to delete.
- Click Delete and confirm the action.
Searching Alerts
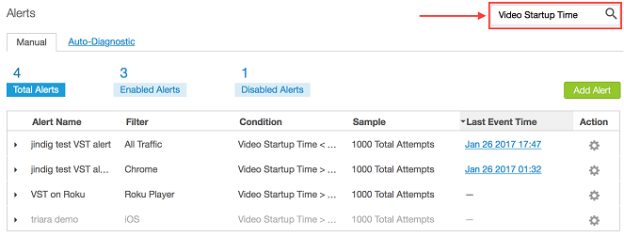
The Manage Alerts page allows you to perform searches by the Alert Name, Filter, or Condition fields.
- Type a search term in the search box and press Enter. In this example, we search for "Video Startup Time":
- To clear your search and see all alerts again, clear the search box and press Enter.
Note: If your search yields no results, click the search box and press Enter. This will re-populate the Manage Alerts page with all alerts.
Viewing Alert Diagnostics
Each alert produces an event when it fires. The best place to examine events is the Diagnostics page, where you can dig down into event data to see information about the conditions that were in effect when the event occurred.
On the Manage Alerts page you can expand the view to see the five most recent events or click to see a list of all events that occurred within the last 31 days. Pagination controls at the bottom of the page let you see more of the list. Each event has a link that takes you to the corresponding Diagnostics page. You can also get to the diagnostics page for an event from the Manage Alerts page of from the link in the notification email.
Another way to access the Diagnostics page is from the main Pulse Navigation (Alerts > Diagnostics).
If an alert has fired, the Diagnostic page shows the name of the alert, the date and time it fired, and the triggering value. Additional information varies by metric. See Viewing Manual Alert Diagnostics for more detailed information about the Diagnostic page.
To view alert diagnostics for a selected date range and filter, click Alerts > Diagnostics. Choose the date range and filter.
To view the diagnostics page for a specific alert event, open the alert on the Manage Alerts page and click the time stamp link for an alert incident. Or, you can click the link that appears in the alert email.
Alerts Mapping
The alerts mapped in BigPanda are as follows
| Severity | Status |
| P1 | Critical |
| P2 | Warning |
| P3 | Warning |
| Not Set | Warning |
Manage Alerts Manage Alerts Manage Alerts