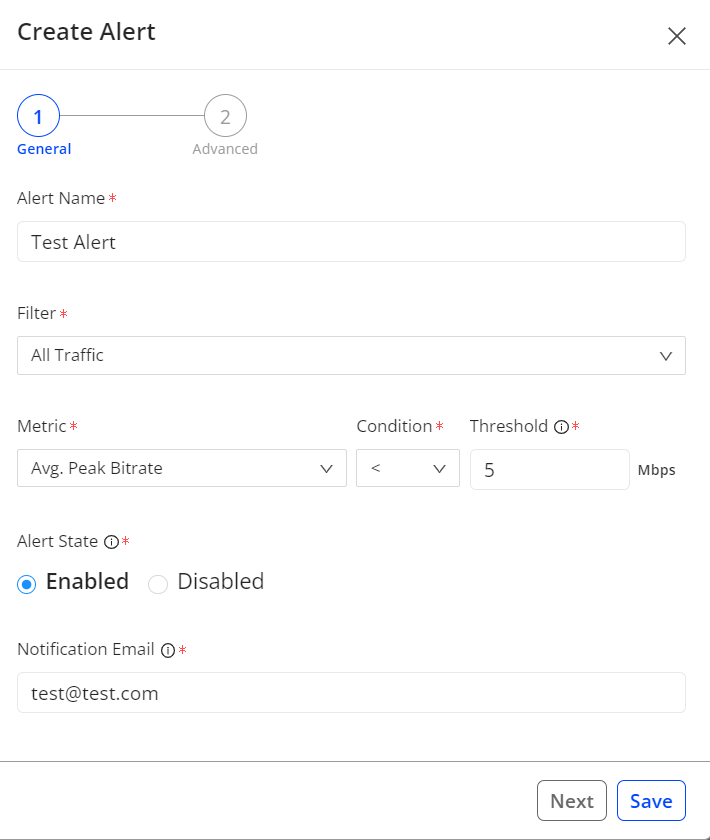
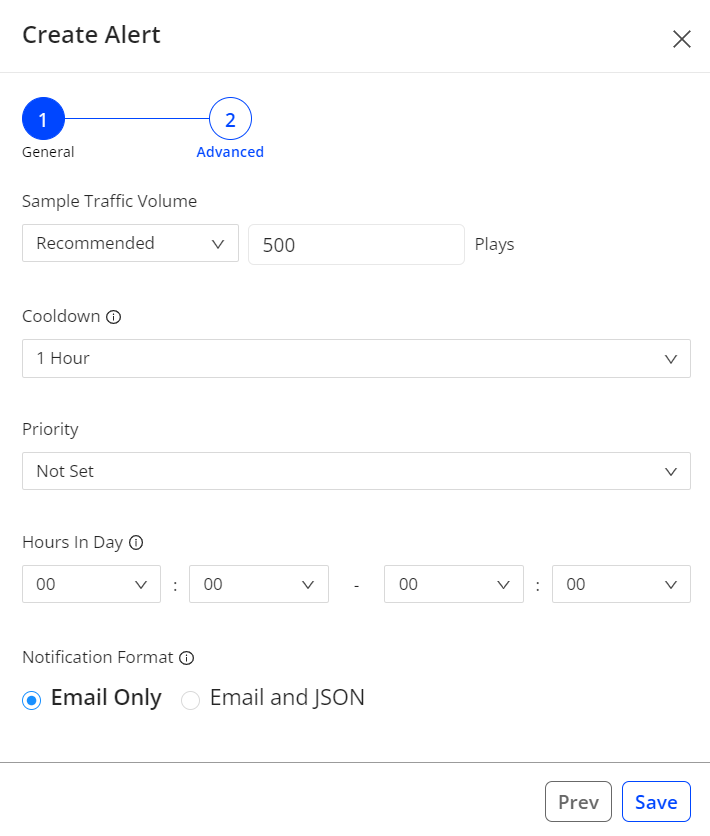
When you create or edit alerts, you can choose advanced settings to customize the alerts.
To access the advanced settings, click Advanced Settings when you create or edit an alert.
The image shows the Advanced option in the Create Alert page.

The image shows the Advanced Settings options that are available.

| Advanced Setting | Functionality |
|---|---|
| Time-of Day | Controls when each alert is evaluated each day. This capability allows you to restrict the time period when an alert will trigger instead of manually disabling or ignoring it, which prevents confusion and improves your ability to focus on your service’s quality events. |
| Sample | Sets the size of the data sample before the alert can be triggered. This helps ensure you only receive alerts when the number of users impacted is significant. For example, let's say you have an alert for VSF greater than 10%. The alert could trigger when you have 1 failure out of 5 attempts, which is not very interesting. If you add a required sample of 1000 attempts, you focus the alert on larger scale problems. The default setting depends on the metric you choose. To change the size of the sample, choose Custom from the list to the right of the sample value and enter a value. |
| Cool Down | Determines how long the system waits before pinging you again for a new event on the same alert. This allows you to set the sensitivity for the alert. If it's a super-critical metric, you might want to set it for no cool down. The system continues to record activity during the cool down period; it simply doesn't ping you with new alert emails until the cool down period expires. |
| Priority | Assigns a qualitative importance to the alert. The priority appears on the email notification, so recipients can tell at a glance how critical the alert is. P1 is typically the most critical; P3 is the least. You can also choose not to set a priority. |
| Notification Format | Provides choice of two notification formats: plain email or email + JSON. The appearance of the plain email depends on your email client. |
Email Example

JSON Data Example
If you select Email and JSON notification format option, JSON data for the alert is included with the alert email. To view the included JSON data, your email program must be able to parse JSON data. For example in Gmail, open the alert email and select the Show original email option. Then, scroll to view the raw email information, including the JSON data.
For example, this JSON data was included with a rebuffering error.
{"alert":
{"condition":
{"type": ">", "value": 1.0},
"cool_down": "1 hour",
"filter": {"id": 52739, "name": "Country!=USA"},
"id": 5495,
"name": "Rebuffering-Error",
"priority": "Not set",
"quality_metric": {"name": "Rebuffering Ratio", "units": "%"},
"samples": {"metric": "Concurrent Plays", "units": "plays", "value": 500}
},
"event":
{"id": 26619877, "quality_metric_value": 6.16, "samples_value": 3215, "timestamp": "Jan 30 2018 13:08",
"url": "https://pulse.conviva.com/customer_switch/1928808/?next=3D%2Freports%2Fdiagnostic%2F%23alert%3D5495%26event%3D266198"},
"version": "2.0"}
}
| Key | Indicates |
|---|---|
|
"type" |
Alert condition type as > greater than or < less than the configured condition value. |
| "value" | Alert condition value, as a positive number, applied to the condition type. |
| cool_down | How long the system waits before pinging you again for a new event on the same alert. |
|
fitler:"id" |
Filter used to define the alert condition. |
| filter:"name" | Filter name used for this alert. |
| "priority" | Priority set for the alert. P1 is typically the most severe alert. |
|
quality_metric:"name" |
Name of the quality metric that triggered the alert. |
| quality_metric:"units" | Units of the quality metric that triggered the alert. |
|
samples:"metric" |
Name of the sample metric used to calculate the alert. |
| samples:"units" | Units of the sample metric used to calculate the alert. |
| samples:"value" | Value of the sample metric at the time the alert fired. |
|
event:"id" |
Unique ID of the specific event for which you are receiving this manual alert. |
| event:"quality_metric_value" | Value of the quality metric that triggered the alert, at the time the alert fired. |
| event:"samples_value" | Sample value, at the time the alert fired. |
| event:"timestamp" | Date and time the alert fired. |
| event:"url" | Link to the diagnostic page to analysis the root cause of the alert. |
| version |
Version number of the manual alert JSON format. Format: "Major.Minor.Revision" |
For more information about alerts, see:
- Alerts: Overview of alerts, how they work and how they can benefit your business.
- Creating Alerts: Step-by-step instructions on how to create alerts, with definitions of Advanced Setting options.
- Managing Alerts: Instructions and advice on how to edit, delete, enable and disable alerts.
- Viewing Alert Diagnostics: Explanation of the diagnostic components and options available.