The DPI Overview Dashboard provides a comprehensive view of application performance and user activities in a Flow. It enables quick identification of performance trends, user engagement levels, and potential issues in a single, consolidated interface.
The Overview dashboard offers,
-
A comprehensive view of the application.
-
Critical performance metrics in a clear and accessible format.
-
Visibility into user journeys such as sign-up, login, and checkout.
-
AI alerts to support faster troubleshooting and root-cause analysis.
-
Event analysis for impact insights.
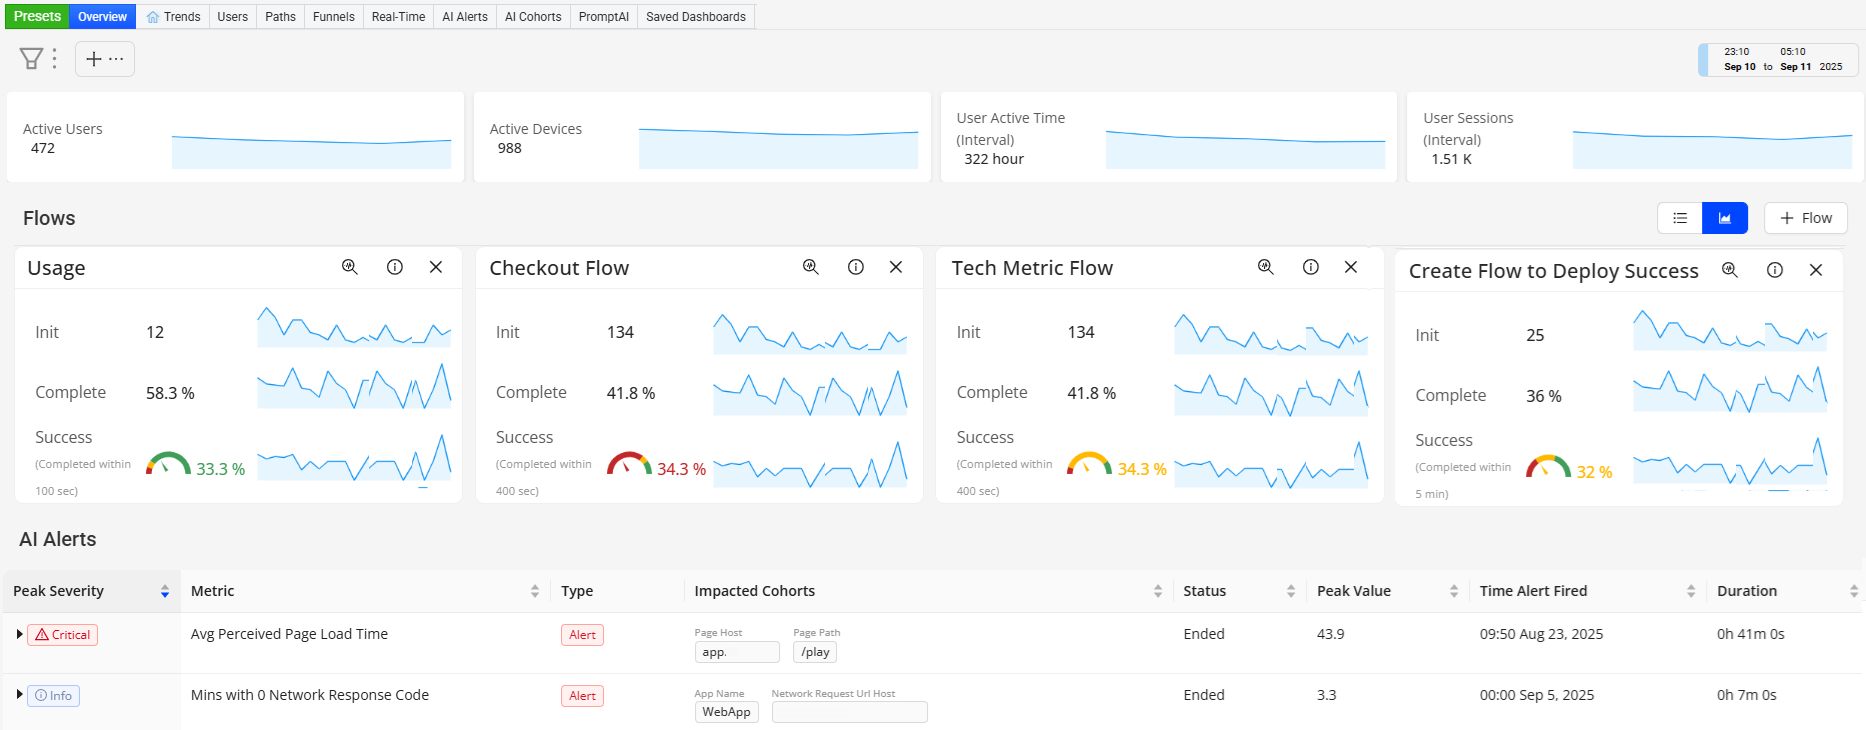
Key Performance Metrics

The dashboard provides the following metrics for a selected time range:
-
Active Users: The total number of unique users who generated at least one event during the specified time interval.
-
Active Devices: The total number of devices that generated at least one event during the specified time interval.
-
User Active Time (Interval): The total active user session time, in hours, during the current interval, not including the timeout window.
-
User Sessions (Interval): The number of user sessions that were active during the current interval, not including the timeout window.
Flows
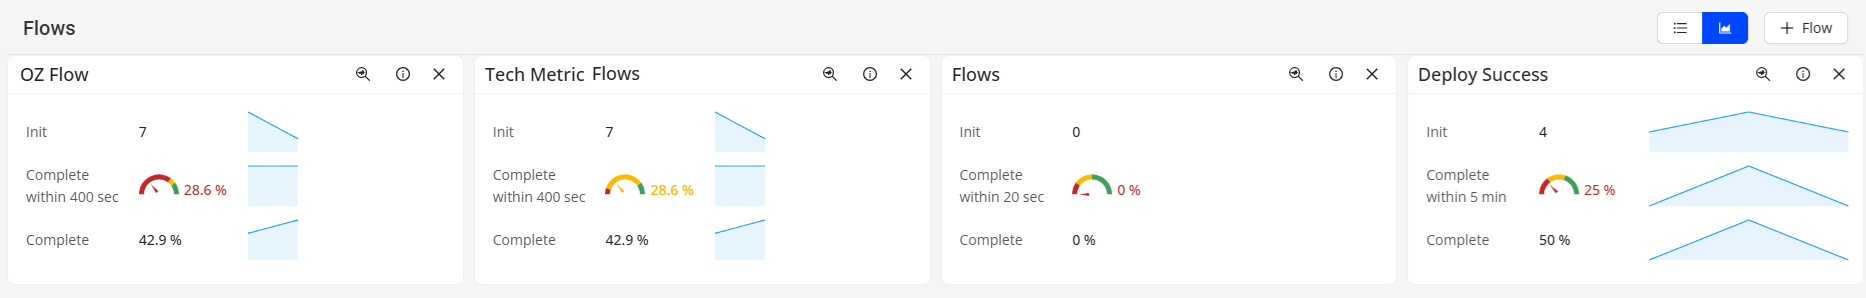
Flows represent critical steps in the user journey. By setting the start and end events of interest, Flow metrics become instantly available. These auto-generated metrics represent all the characteristics of the Flow - such as the duration, success rate, and frequency - and provide the levers to enable the Flow, and therefore the section of the user the Flow represents, to be optimized. Flows are self-defined and are not limited in their sophistication or number. Define the custom Flows based on requirement, such as conversions or error-influenced checkouts, and use the out-of-the-box dashboards to monitor KPIs like success rate, inits, duration, and errors.
For each journey, Flows provides metrics such as completion rate, success ratio, error distribution, and total duration. These insights help teams detect performance gaps and uncover opportunities for improvement. Examples of monitored flows include Sign-Up, Login, Checkout, and Checkout Success.
For more information on flow creation, see Flows.
AI Alerts
The Overview dashboard list the generated AI Alerts in a dedicated view.
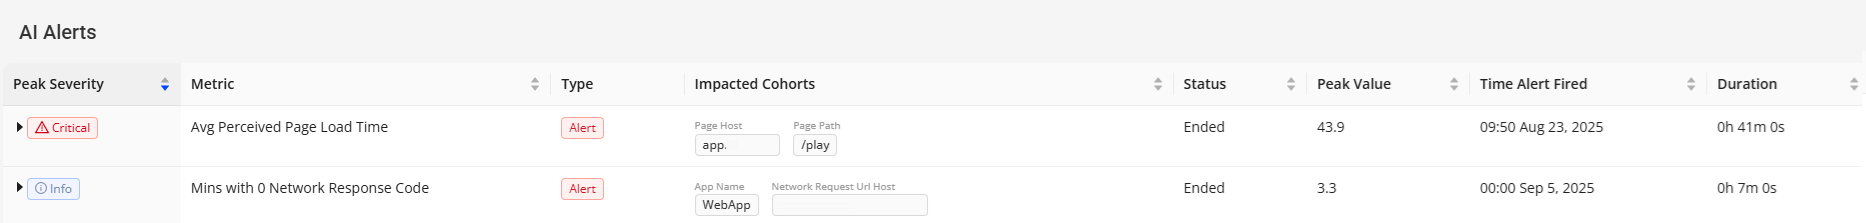
Each alert provides:
-
The sessions that contributed to the issue and list the impacted cohorts
-
The dimensions or combination of dimensions associated with the root cause.
This list enables the admins to quickly investigate anomalies, prioritize incidents, and take corrective actions to maintain optimal performance.
For more information on AI Alerts, see AI Alerts.
Events
User events are individual, timestamped actions generated by a user in real time — such as a click, page view, purchase, or login. Each event represents a discrete, immutable record that flows continuously through a streaming pipeline for immediate processing and analysis. Unlike batch processing, which analyzes data at scheduled intervals, streaming systems process events as they occur. This enables capabilities such as real-time personalization, fraud detection, session tracking, and anomaly detection. User events form the foundational building blocks of streaming analytics systems. By aggregating and analyzing events — including event counts, sessions containing specific events, and users associated with those events — organizations can derive meaningful insights and drill down into anomalous behavior with precision.
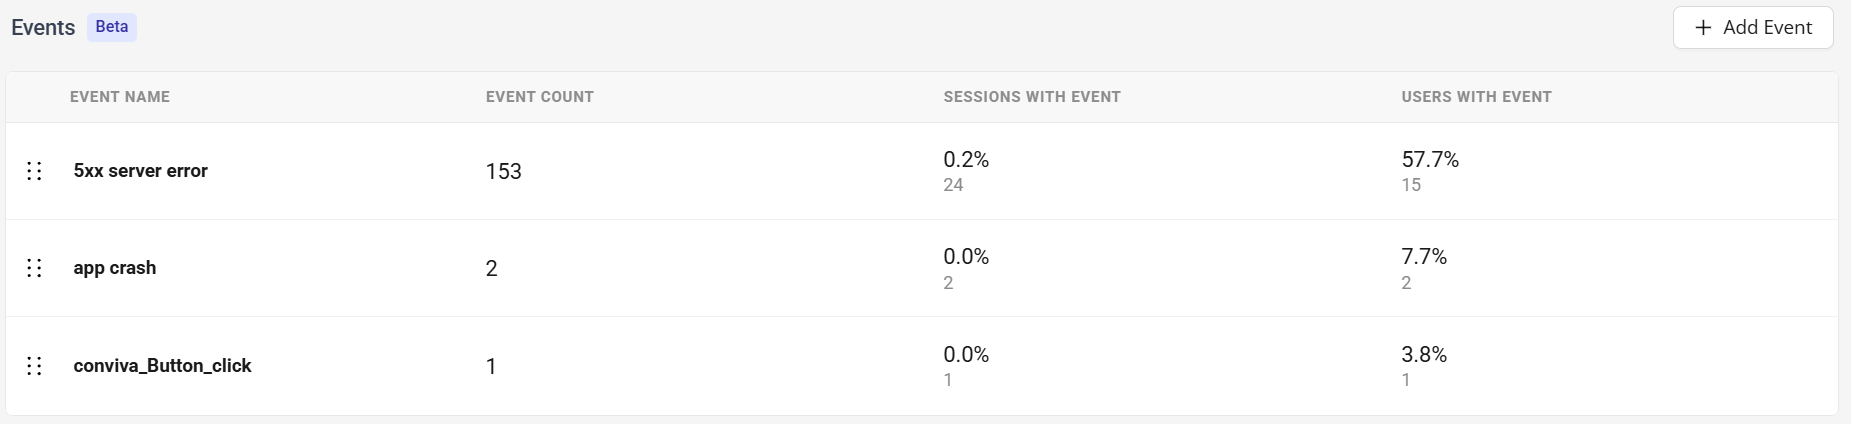
Also, click on the specific event to view the preset for the selected event, which accelerates event-based data analysis and anomaly detection. Each preset includes a predefined set of key metrics and corresponding dimension data, offering a structured starting point for investigating trends and identifying issues across critical user experience areas. These presets reduce setup time and promote consistent data analysis across teams.
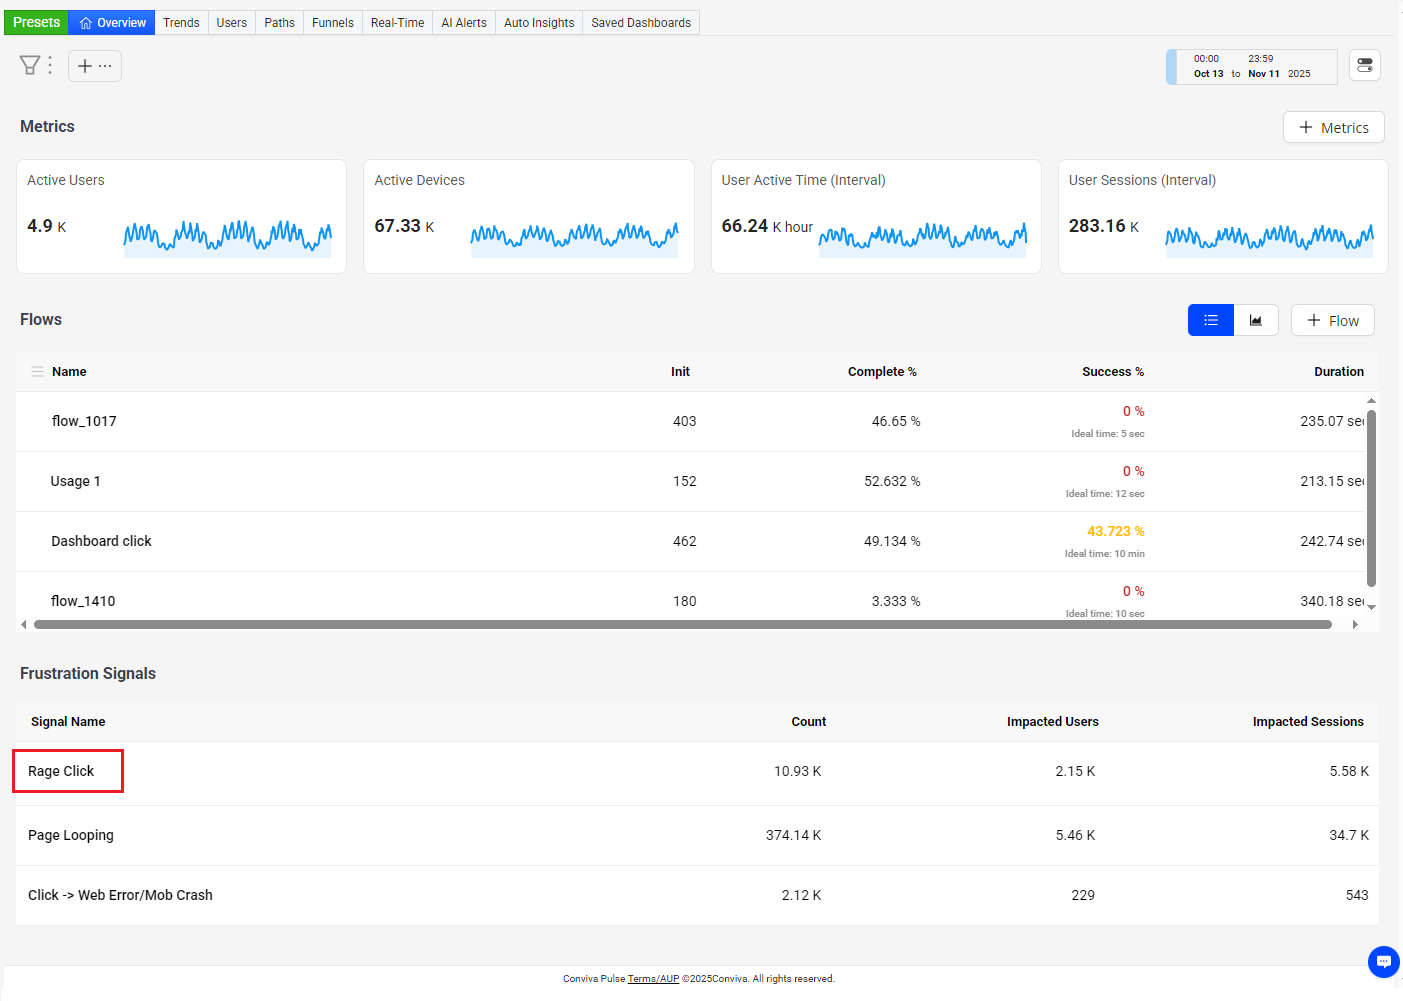
Frustration Signals
Use the Overview dashboard to display Frustration Signals related to the current Flows. Clicking a signal name opens the diagnostic page for detailed analysis of the user impact and signal behavior.
Image: Frustration Signals
In this example, the Frustration Signal page displays user time series for data slicing and the dimension tables for pages and UI elements originating rage clicks, enabling advanced drill-down snalysis across imapcted user, pages, and UI elements.
Image: Frustration Signals
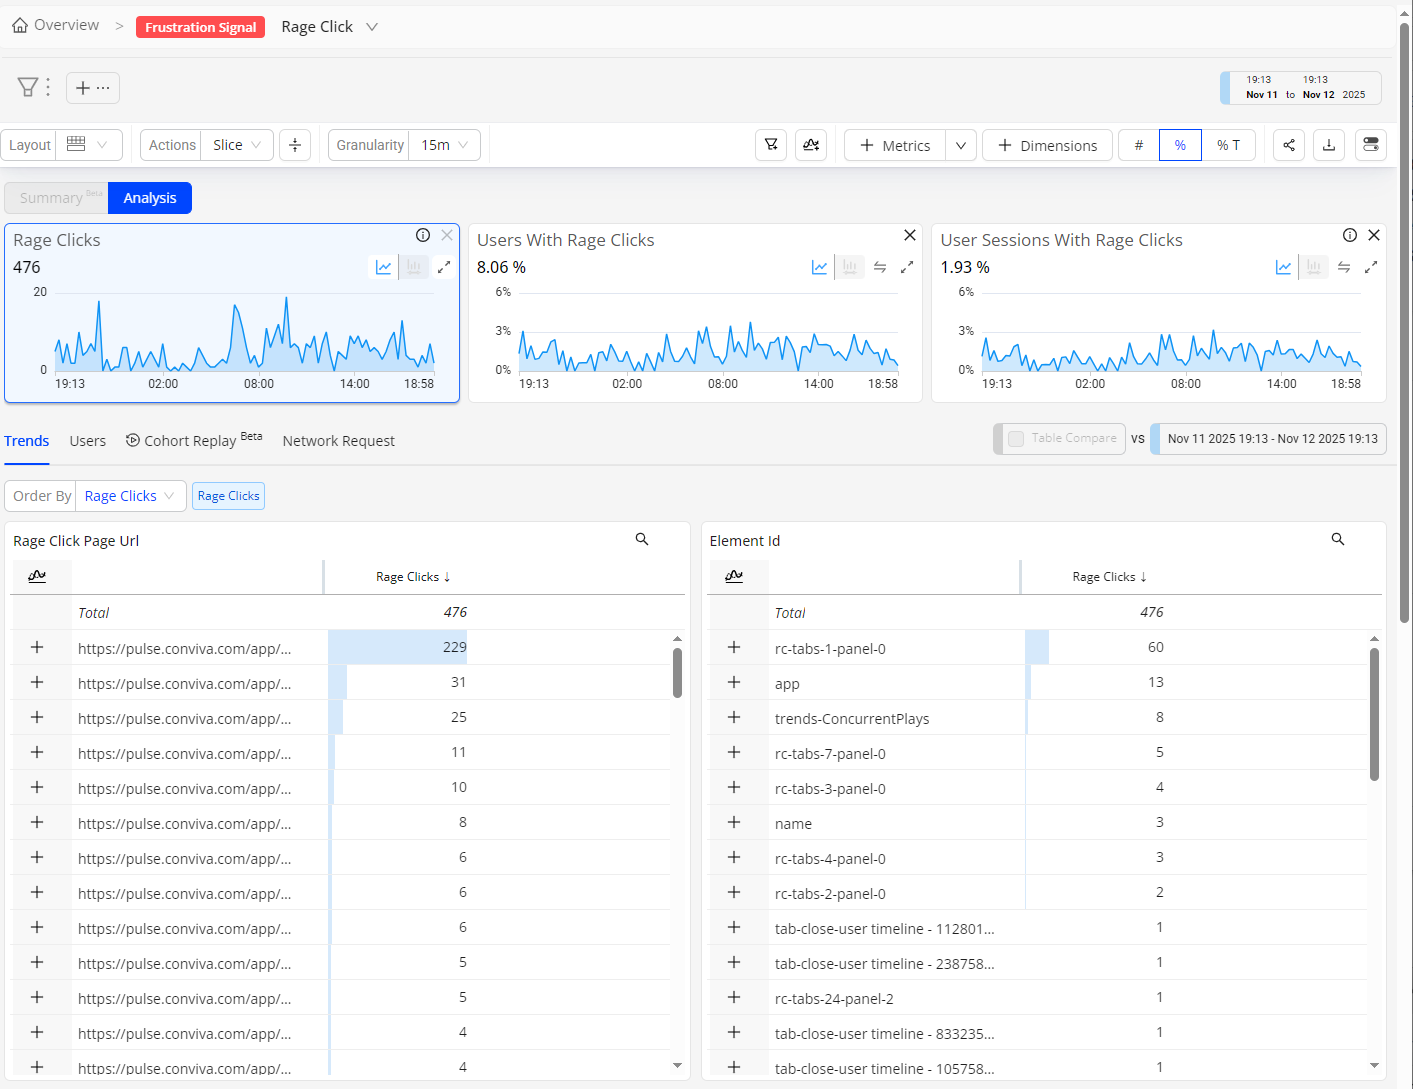
Use the Frustration Signal selector to quickly switch the analysis between other signals. For more details see, Introduction to Frustration Signals.
Overview Overview Overview Flows Frustration Signal AI alerts flows Al alerts key metrics key metrics active user active time user session interval user Frustration Signal active time interval