Introduction to Frustration Signals


Conviva captures frustration signals as measurable indicators derived from user interaction data that reflect potential user dissatisfaction, confusion, or friction during a digital experience. These signals identify behavioral or technical anomalies observed in digital experiences. Conviva’s common set of metrics quantifies these signals and their impact on user journeys. Key frustration signals highlight occurrences of user friction, such as rage clicks (repeatedly clicking on an element in frustration), excessive app restarts, and clicks preceding web errors and mobile app crashes. Each frustration signal provides insights into specific user behaviours indicating potential areas for experience and performance improvement.

Frustration signals help to:

  • Identify why users drop off or fail to convert.

  • Quantify the impact of poor experience on user behavior within Funnels, Journeys, and Sessions.

  • Analyze the root cause by correlating frustration events with technical, device, or browser dimensions.

Signals

Defintions

5xx Network Request Failure to App Background (Beta)

This metric to correlate server network request issues with app state transitions to background (user inactivity). This metric counts how often a 5xx network request failure is followed by the application transitioning to the background within 10 seconds, highlighting server-side request-handling issues that impacted user app activity. For structured server issue analysis, Conviva DPI integrates network dimensions, such as host and path, as associated dimensions.

For more details, see 5xx Network Response to App Background.

ANR -> Restart

The percentage of the conviva_anr (Application Not Responding) event followed by an app restart in less than 30 seconds.

The metric is calculated as the number of conviva_anr (Application Not Responding) events where the user restarted the app in less than 30 seconds, divided by ANR to App Startup Init.

For more details, see ANR -> Restart.

App Crashes

The proportion of sessions with application crashes in a native application.

This calculation divides the number of sessions containing native application crashes by the total native app session count.

For more details, see App Crash V2.

Crash -> Exit

The percentage of sessions that become inactive within 30 seconds after an app crash.

This metric measures the count with which users end their sessions immediately following a crash, reflecting the extent to which the crash impacts the user experience.

For more details, see Crash -> Exit.

Mins with ANR -> Restart

The percentage of one-minute intervals in app sessions with at least one of these events followed by an app restart within 30 seconds:

  • conviva_anr (Application Not Responding, Android v1)

  • conviva_anr_v2 (Application Not Responding, Android v2)

  • conviva_crash_v2 (iOS Watchdog Terminations, iOS v2) event

The metric is calculated as the count of one-minute intervals in app sessions with a conviva_anr, conviva_anr_v2, or conviva_crash_v2 (iOS Watchdog Termination) event and the user restarted the app within 30 seconds, divided by the total active minutes.

For more details, see Mins with ANR -> Restart.

Note: Enabling the # mode displays the metric in number format, representing the total count of one-minute intervals in app sessions with a conviva_anr event followed by an app restart in less than 30 seconds.
This metric is filtered to include only devices with native applications installed. In this metric, Mins indicates the one-minute intervals during which at least one metric impact occurred.

Page Loop (Beta)

This metric measures the frequency or the number of instances when the same page URL in a web app is visited three or more times within 15 seconds, highlighting navigation instability or friction within the page navigation of the user journey. Frequent page looping might be a strong signal of confusing page structures or broken navigation paths. User struggles with progress due to validation errors or inconsistent state handling.

For more details, see Page Loop.


ANR -> Exit

The percentage of sessions that become inactive within 30 seconds after the app fails to respond.

This metric measures the count with which users end their sessions immediately after the app fails to respond, reflecting the impact on user experience.

For more details, see ANR -> Exit.

ANR Count

The total count of conviva_anr events during the specified time interval.

For more details, see ANR Count.

Click ->Error (Beta)

This metric captures the number and percentage of user interactions that are directly followed by a web error or mobile crash. Web Error : For web users, a web error (any recorded client- or server-side error event (e.g., JavaScript error)) triggers in response to the click. Mobile Crash: For mobile users, a fatal error that results in the immediate termination of a mobile application on a mobile device after a click. This metric expressed as a percentage indicates the level of user interactions that led to web errors and mobile crashes.

For more details, see Click -> Error.

Crash -> Restart

The percentage of impacted minutes in app sessions with application crashes followed by an app restart in less than 30 seconds.

The metric is calculated as the count of impacted minutes in app sessions where an application crash occurred and the user restarted the app in less than 30 seconds, divided by the count of active minutes.

For more details, see Crash -> Restart.

Note: Enabling the # mode displays the metric in number format, representing the total count of impacted minutes in app sessions with application crashes followed by an app restart in less than 30 seconds.
This metric is filtered to include only devices with native applications installed.

Mins with Crash -> Restart

The percentage of one-minute intervals in app sessions with at least one app crashes followed by an app restart in less than 30 seconds. 

The metric is calculated as the count of one-minute intervals in app sessions with at least one app crashes followed by an app restart in less than 30 seconds, divided by the count of active minutes.

For more details, see Mins with Crash -> Restart.

Note: Enabling the # mode displays the metric in number format, representing the total count of one-minute intervals in app sessions with application crashes followed by an app restart in less than 30 seconds.
This metric is filtered to include only devices with native applications installed. In this metric, Mins indicates the one-minute intervals during which at least one metric impact occurred.

Rage Clicks (Beta)

This metric measures the frequency of users engaging in rapid, repetitive clicks on the same UI element, typically indicating a high level of user frustration. This metric tracks instances in which users perform three or more clicks on the same clickable UI element within a two-second time window without any meaningful interaction or response.

For more details, see Rage Clicks.

Note:  Rage Click supports xPath dimension, which helps identify unique elements (works best with js-1.4.19).

Rage Clicks

Measures user frustration often indicated by rapid, repeated clicks on the same UI element (3+ clicks within 2 seconds) that fail to produce the expected response. High rage click rates typically indicate unresponsive buttons, slow page loads, or broken functionality that prevents users from completing their intended actions.

For each session, this metric calculates the number of rage click bursts in the session.

Across all sessions, this metric shows the total RageClickBursts in all sessions divided by the number of sessions.

Note: This metric captures XPath selectors for each rage click event, allowing you to identify the exact DOM element causing frustration. Full XPath support works best with JavaScript SDK v1.4.19 or later.

Platforms: JS

How to use: Monitor high rage click rates that signal critical UX problems and identify pages or views with elevated rage click rates. Review XPath data to locate specific problematic elements and related root causes:

  • Performance issues (slow server response, heavy client-side processing)

  • Functional defects (broken event handlers, JavaScript errors)

  • UX issues (unclear visual feedback, misleading affordances)

Secondary Metric: Soft Navigations Counts

Distribution: App Start Up Complete vs Mobile App Startup Time distribution: a distribution by preset buckets, where each bucket displays the app start up complete count in a specified range for corresponding average duration for an app to start. This distribution helps you to identify performance issues and optimize the performance of apps.


Related Support:

Dashboards:

  • Mobile Experience Preset

  • Overview

  • Trends

  • Real-Time

  • Custom Dashboards

AI Alert: Not available


Metric Adjustments:

To clarify:

-what defines no response:

No DOM changes?

No network requests initiated?

No page navigation?

No visual feedback?

No page navigation occurs - No form submission is triggered - No modal/dialog opens - No visible UI state change

-percentile?


Rage-click detectors often exclude:

double-click–enabled elements

input fields (cursor placement)

clicks during page load spinners

Note: Excludes UI patterns designed for repeated interaction (e.g., increment buttons, game controls).???

Page Loop

Measures repeated navigation to the same canonical page URL within a short period. A page loop occurs when a session records 3 or more page visits to the same URL within 15 seconds (based on page_view and route_change timestamps).

This metric helps identify navigation instability or friction in a user journey. Elevated page looping can indicate:

  • confusing navigation or unclear information scent

  • validation errors or state resets that force users to retry

  • redirect or routing bugs (including unintended loops)

  • slow UI or failed transitions prompting repeated navigation

For each session, this metric sums the number of page loop instances in to a session total.

For aggregation across all sessions, this metric averages the page loops in sessions by the number of sessions.

Platforms: JS

How to use: User Sessions with Page Loop measures the number of sessions that contain at least one page loop—defined as the frequency or number of instances when the same page URL in a web app is visited three or more times within 15 seconds.

Users with Page Loop measures the number of users who visited the same page URL in a web app three or more times within 15 seconds.

Secondary Metrics: None


Related Support:

Dashboards:

  • Web Experience Preset

  • Overview

  • Trends

  • Real-Time

  • Custom Dashboards

AI Alert: Not available


Metric Adjustments:

need to review the following content:

URLs are canonicalized (query/fragment handling…)”

Page visits are based on route/page_view events and are deduplicated for rapid duplicates.

Page loop instances are counted as bursts; sustained looping counts as one instance until a 15s gap occurs.

Redirect/auth callback pages may be excluded or reported separately.

Mins with Crash -> Restart

Measures the percentage of one-minute intervals in app sessions with at least one app crashes followed by an app restart in less than 30 seconds. The metric is calculated as the count of one-minute intervals in app sessions with at least one app crashes followed by an app restart in less than 30 seconds, divided by the count of active minutes.

Note: In this metric, Mins indicates the one-minute intervals during which at least one metric impact occurred.

How to use: Use this metric to determine the engagement impact and urgency of app crashes. High impacted minutes indicates recurring app crash-restarts with users motivated to continue app use despite the app crashes. Compare this metric with the Crash → Restart to reference the total number of mobile app sessions during which users restarted with app within 30 seconds of the crash.


Related Support:

Dashboards:

  • Mobile Experience Preset

  • Overview

  • Trends

  • Real-Time

  • Custom Dashboards

AI Alert: Not available.


Metric Adjustments:

Inputs needed, and need to review the following content:

App Crash v2 represents the modernized metric for identifying and counting application failures across mobile and TV platforms. It transitions from legacy error reporting to a more granular, event-driven model that distinguishes between real-time and delayed reporting modes.

App Crash V2

Measures the number of sessions during which an app unexpectedly terminates (closes) due to an unhandled error while a user is active in the app. A crash is counted when the app process stops abnormally and is detected with the conviva_crash_v2 and application_error events.

With this App Crash update, if the app crashes after termination, the crash is always reported in the same Conviva session if the app relaunches within the Conviva session timeout limit, or in the next launched app session.

This metric does not include:

  • ANRs / hangs (app freezes but doesn’t terminate) — usually a separate metric

  • Force quits by the user (swiping the app away)

  • Graceful exits (user logs out, closes app normally)

  • Network errors that don’t crash the process

As an aggregate metric, App Crashes shows the number and percentage of sessions with app crash events during the selected interval.

For enhanced debugging, V2 of App Crashes introduces fields, including unique crash event identifiers for crash type, reporting mode, error message, stack trace, and crash timestamp.

How to use: Monitor crash rates before and after releases to quickly detect regressions and prioritize stability fixes. Correlate crash spikes with specific app versions, devices, or OS versions to understand their impact on user engagement and retention.


Related Support:

Dashboards:

  • Mobile Experience Preset

  • Overview

  • Trends

  • Real-Time

  • Custom Dashboards

AI Alert: Not available.


Metric Adjustments: None.

5xx Network Response to App Background

Shows the percentage of 5xx network response errors that caused users to leave or background the app within 30 seconds.

This metric measures the percentage of 5xx network responses that immediately lead to app backgrounding, reflecting the extent of server-side issues, such as misconfigurations or performance overloads, on user experience. As a percentage, it is calculated by dividing the number of sessions with 5xx network responses that lead to app backgrounding within 30 seconds divided by the total number of sessions with 5xx network responses.

How to use: Use this metric to monitor the impact of 5xx network response issues on user experience. High exit rates signal severe server-side performance issues.


Related Support:

Dashboards:

  • Service Experience Preset

  • Overview

  • Trends

  • Real-Time

  • Custom Dashboards

AI Alert: Not available.


Metric Adjustments: Inputs needed.

Click -> Error

Shows the percentage of UI element clicks that lead to errors within 30 seconds.

This metric measures the percentage of UI element clicks immediately after which users experienced errors, reflecting the extent of misconfigured element click behavior. As a percentage, it is calculated by dividing the number of UI element clicks that caused errors within 30 seconds after the click divided by the total number of UI element clicks in the selected period.

How to use: Use this metric to monitor the impact of UI element click errors on user experience. High exit rates signal severe UI element issues.


Related Support:

Dashboards:

  • Web / Mobile Experience Preset

  • Overview

  • Trends

  • Real-Time

  • Custom Dashboards

AI Alert: Not available.


Metric Adjustments: Inputs needed.

Crash -> Exit

Shows the percentage of mobile application sessions that become inactive within 30 seconds after an app crash.

This metric measures the percentage of mobile app session during which users end their sessions immediately following a crash, reflecting the extent to which the crash impacted the user experience. As a percentage, it is calculated by dividing the number of mobile application crashes in sessions that become inactive within 30 seconds after the app crash divided by the total number of mobile app sessions in the selected period.

This metric measures the percentage of mobile app sessions during which users end their session immediately following a crash.

How to use: Use this metric to monitor the count of mobile app crashes that lead to exits along with the percentage of how often users abandon the mobile app after a crash issues. High exit rates signal severe user experience issues.


Related Support:

Dashboards:

  • Mobile Experience Preset

  • Overview

  • Trends

  • Real-Time

  • Custom Dashboards

AI Alert: Not available.


Metric Adjustments: Inputs needed.

Crash -> Restart

Shows the percentage of mobile app crashes followed by an app restart in less than 30 seconds.

As a percentage, this metric is calculated as the number of app crashes where the user restarted the app in less than 30 seconds, divided by the number of Crash to App Startup Init events in the selected period.

How to use: Gauge engagement impact and crash tolerance. High restart rates suggest users remain engaged despite crashes, indicating lower-level severity issues and engaged users. Compare this metric with the Mins with Crash → Restart to reference the minutes impacted with at least one mobile app sessions during which users restarted with app within 30 seconds of the crash.


Related Support:

Dashboards:

  • Mobile Experience Preset

  • Overview

  • Trends

  • Real-Time

  • Custom Dashboards

AI Alert: Not available.


Metric Adjustments: Inputs needed.

ANR -> Exit

This metric is a frustration metric used to evaluate how disruptive ANR events are in Android app sessions. This metric shows the percentage of sessions that become inactive within 30 seconds after an Android app fails to respond, and is calculated as the number of sessions with conviva_anr (Application Not Responding) events where the user failed to restart the app in less than 30 seconds, divided by the total number of sessions with ANR events.

Platforms: Android

How to use: Compare this metric with the ANR → Restart to reference how often users continued to use the app after ANR events.

Note: Enabling the number (#) mode displays the total count of impacted app sessions with a conviva_anr event that failed to restart in less than 30 seconds.

Secondary Metrics: None


Related Support:

Dashboards:

  • Mobile Experience Preset

  • Overview

  • Trends

  • Real-Time

  • Custom Dashboards

AI Alert: Not available.


Metric Adjustments:

need to review:

This metric is filtered to include only devices with native applications installed.

ANR Count

The total count of conviva_anr events in app sessions during the specified time interval.

How to use: Gauge engagement and tolerance for pauses in app responsiveness. High ANR rates suggest users experienced delays in app performance. Compare this metric with the ANR → Exit and ANR → Restart metrics to determine user tolerance and continued engagement despite ANR issues.

Secondary Metrics: None

Supported Sensors: Conviva Android


Related Support:

Dashboards:

  • Mobile Experience Preset

  • Overview

  • Trends

  • Real-Time

  • Custom Dashboards

AI Alert: Not available.


Metric Adjustments:

None.

ANR -> Restart

This metric is a frustration metric used to evaluate how disruptive playback failures are in Android and iOS app sessions.

This metric shows the percentage of ANR and Watchdog Termination events followed by an app restart in less than 30 seconds.

  • For Android sensors ≤ v1.2.4 (v1), this is based on the anr_start event; for Android sensors ≥ v1.2.5 (v2), this is based on the conviva_anr_v2 event.

  • For iOS sensors ≤ v1.5.0 (v1), this is based on the application_error event; for iOS sensors ≥ v1.6.0 (v2), this is based on the conviva_crash_v2 event (Watchdog Terminations).

The metric is calculated as the number of these events where the user restarted the app in less than 30 seconds, divided by the total number of ANR/Watchdog Termination to App Startup Init events.

Platforms: Android

How to use: A low ANR-to-Restart rate indicates that ANRs are severe and disruptive (users can’t recover smoothly).

A high rate indicates that while ANRs occur, recovery is often handled gracefully without restarting the session.

Note: Enabling the number (#) mode displays the total count of app sessions followed by an app restart in less than 30 seconds. Compare this metric with the ANR → Exit to reference how often users left the app after ANR events.

Secondary Metrics: None


Related Support:

Dashboards:

  • Mobile Experience Preset

  • Overview

  • Trends

  • Real-Time

  • Custom Dashboards

AI Alert: Not available.


Metric Adjustments:

None

Mins with ANR -> Restart

This metric is a frustration metric used to evaluate the duration of non-disruptive playback failures in Android and iOS app sessions.

This metric shows the percentage of one-minute intervals in app sessions with at least one of these events followed by an app restart within 30 seconds:

  • conviva_anr (Application Not Responding, Android v1)

  • conviva_anr_v2 (Application Not Responding, Android v2)

  • conviva_crash_v2 (iOS Watchdog Terminations, iOS v2) event

The metric is calculated as the count of one-minute intervals in app sessions with a conviva_anr, conviva_anr_v2, or conviva_crash_v2 (iOS Watchdog Termination) event and the user restarted the app within 30 seconds, divided by the total active minutes.

Note: In this metric, Mins indicates the one-minute intervals during which at least one metric impact occurred. Enabling the number (#) mode displays the total count of one-minute intervals in app sessions with a conviva_anr event followed by an app restart in less than 30 seconds.

Platforms: Android

Secondary Metrics: None


Related Support:

Dashboards:

  • Mobile Experience Preset

  • Overview

  • Trends

  • Real-Time

  • Custom Dashboards

AI Alert: Not available.


Metric Adjustments:

need to review:

This metric is filtered to include only devices with native applications installed.

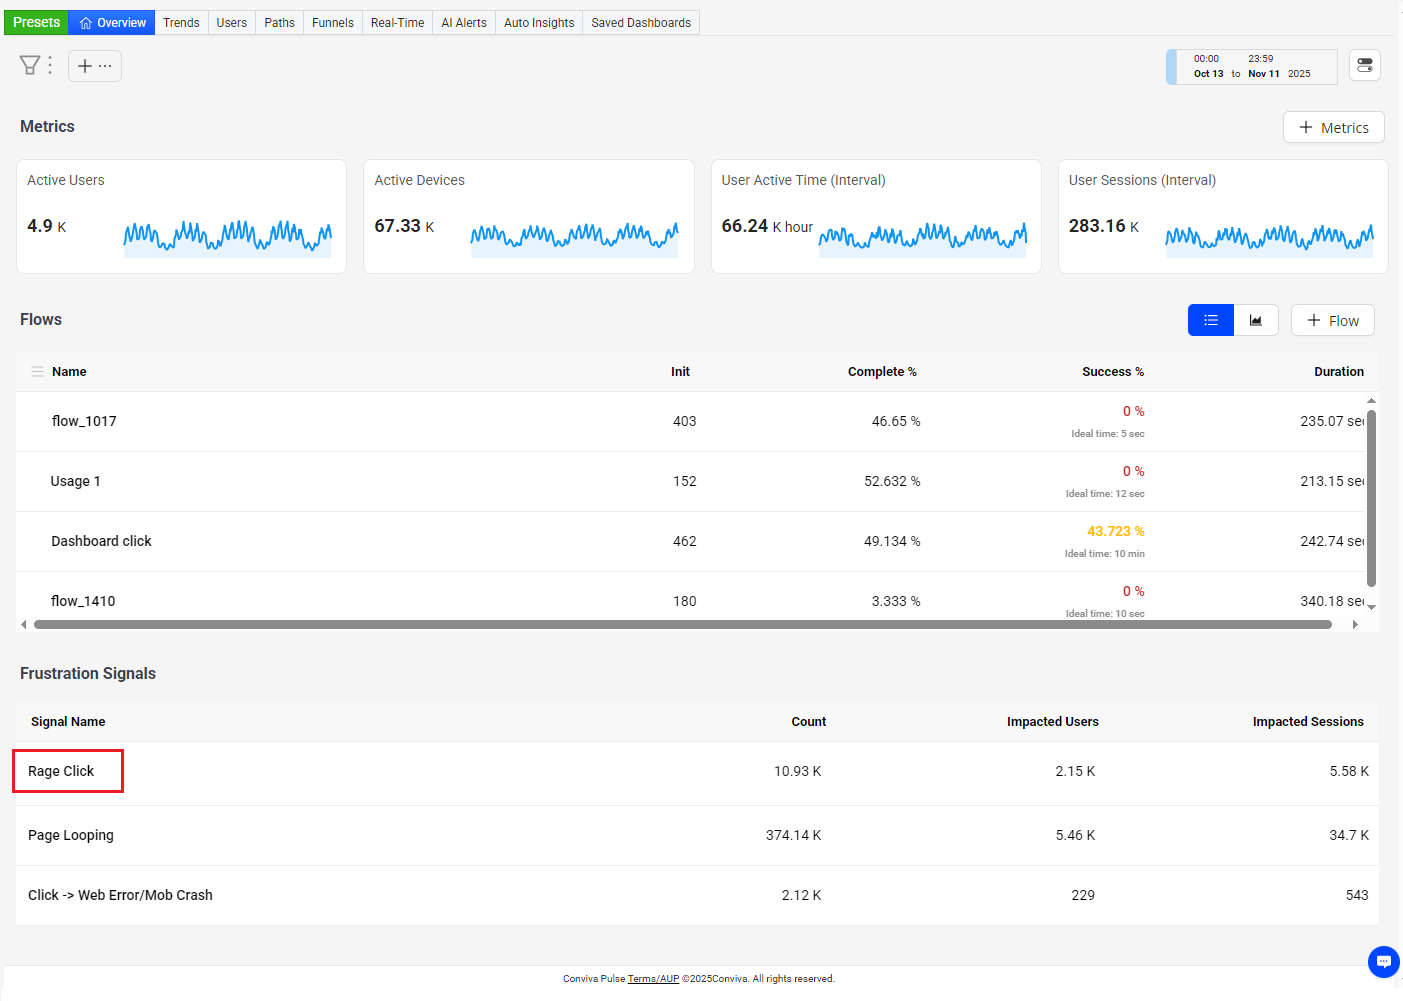
Frustration Signal Analysis

Use the Overview dashboard to display Frustration Signals related to the current Flows. Clicking a signal name opens the preset page for detailed analysis of the user impact and signal behavior.

In this example, the Frustration Signal page displays user time series for data slicing and the dimension tables for pages and UI elements originating rage clicks, enabling advanced drill-down snalysis across imapcted user, pages, and UI elements.

In this example, the Frustration Signal page displays user time series for data slicing and the dimension tables for pages and UI elements originating rage clicks, enabling advanced drill-down analysis across impacted users, pages, and UI elements. Notably, https://pulse.conviva.com/app/... stands out as the top page with 229 rage clicks, and the rc-tabs-1-panel-0 tab panel element leads among UI elements with 60 rage clicks, highlighting the key sources of user experience issues.

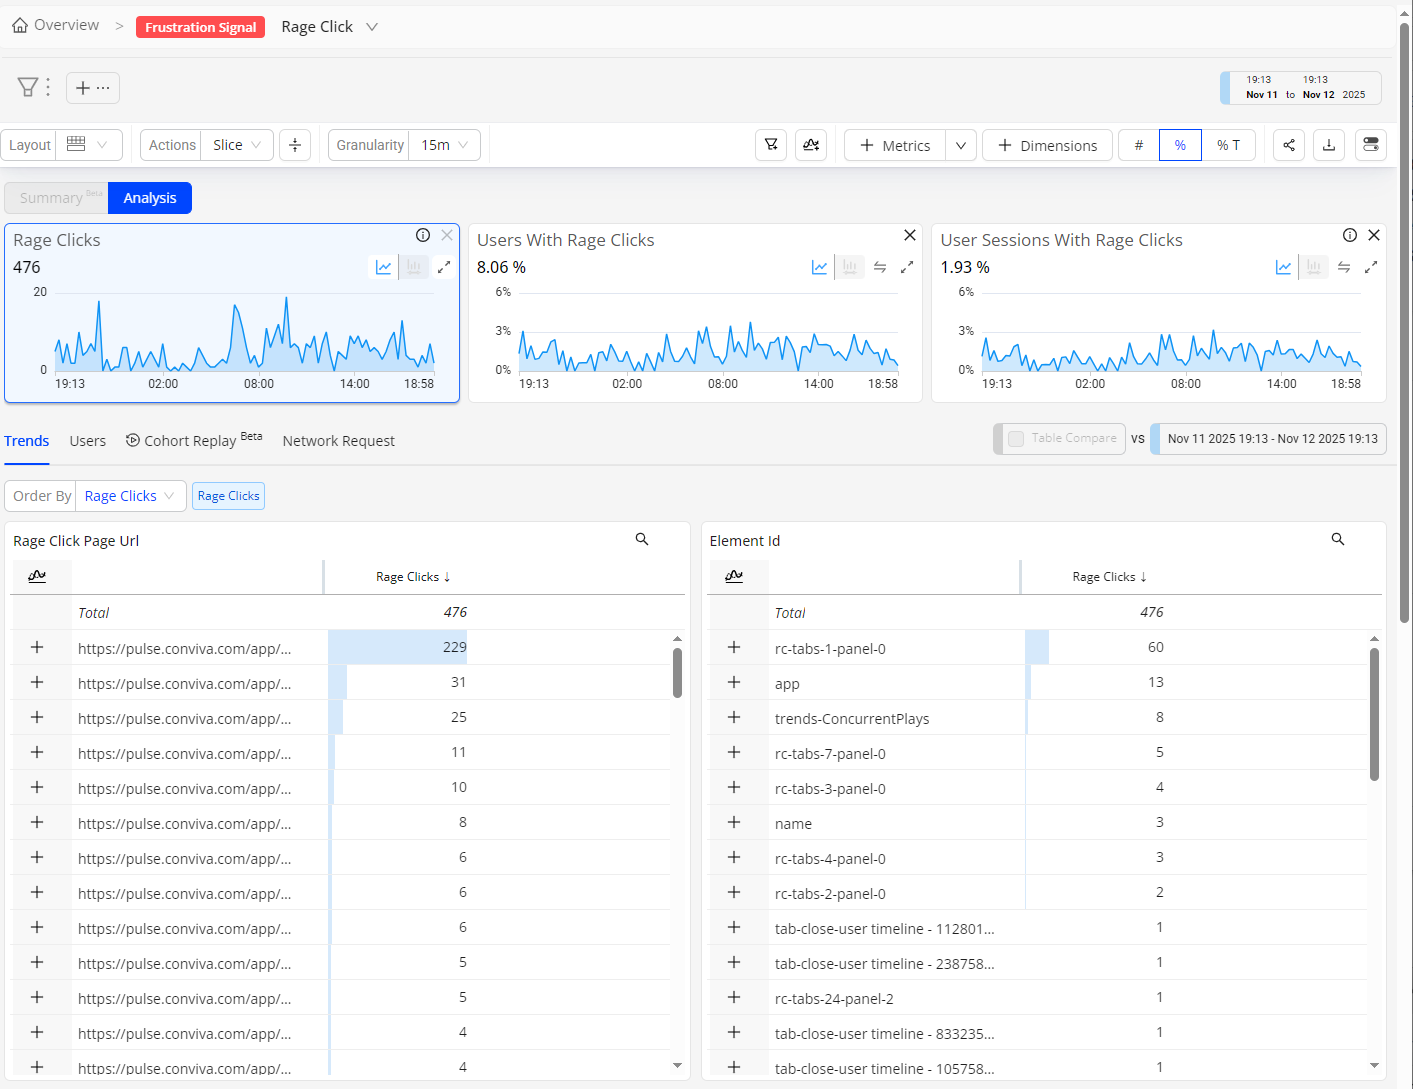
Use the Frustration Signal selector to quickly switch the analysis between other signals.

For metric time series, dimensional drill-downs, and other methods for anomaly analysis, see DPI Trends.


Frustration Signals Frustration Signals Rage Clicks User Sessions with Rage Clicks Users with Rage Clicks Page Loop User Sessions with Page Loop Users with Page Loop Click ->Errror User Session with Click ->Errror Users with Click ->Errror Excessive App Restarts User Sessions With Excessive App Restarts Users with Excessive App Restarts 5xx Network Request Failure to Element Xpath App Background Frustration Signals