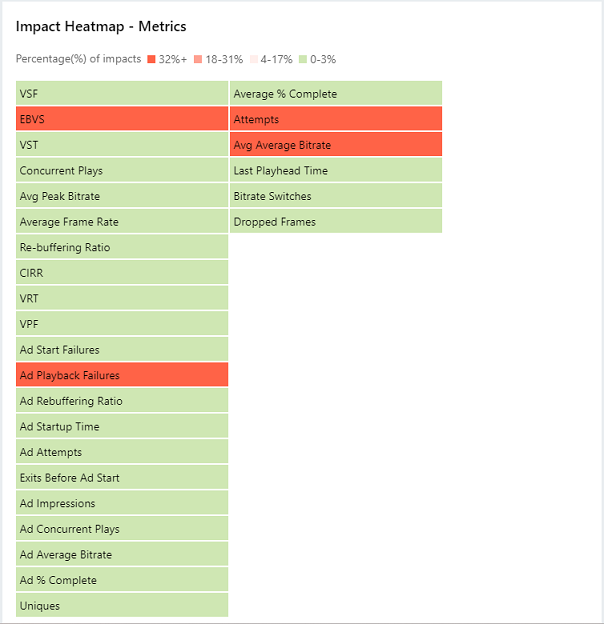
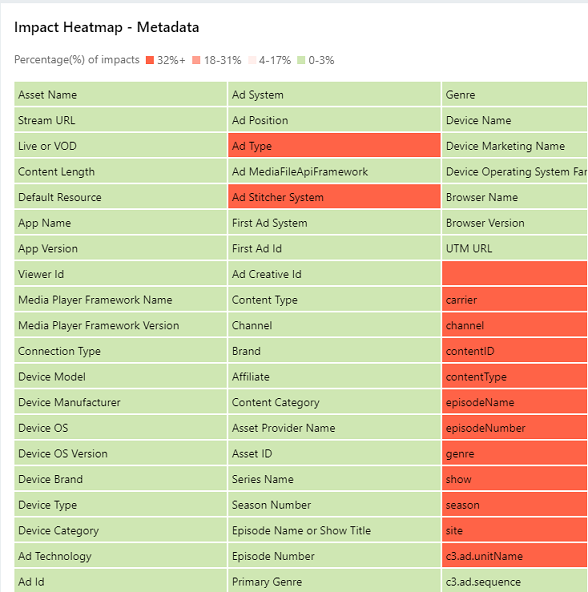
The Reports dashboard displays validation test results of metrics and metadata for all of your device applications.
You can choose to verify the validation results for either metrics or metadata for all or selected apps.
Using the Reports dashboard, view reports for:
-
App Statistics
-
Integration Overview
 App Statistics Report
Use App Statistics report to learn about:
-
The performance of metrics and metadata for all or specific apps
-
Apps that need the most attention (appearing first on the list)
-
Last validation date of the apps
-
Newest build or SDK version if available
App Statistics Report
-
Navigate to the Reports tab.
-
Select App Statistics as report type from the Show dropdown menu.
-
Select either All Apps or a specific app from the dropdown menu.
You can choose to hide certain apps from the report using the Hide Apps option.
-
Verify the validation results for metrics, metadata, and SDK versions.
The Metrics, Metadata, and SDK & Validation tabs list the apps such that the apps requiring the most attention are displayed first.
To improve the Streaming Performance Index (SPI) and data accuracy in Pulse, fix the under-performing metrics and metadata highlighted in the Need Attention field. To learn additional details about the failed metrics or metadata and propsed fixes, refer to the Notes column in the validation report. For more information about self-validating the builds after fixing the issues, downloading the test cases, and watching sample validation videos, refer to the Self-Validation page on the Learning Center.
Metrics Report
The metric names in the Apps and Report tabs depending on the customer type.
For example,
-
Video-only customers see the metrics labeled as "VSF" (Video Start Failure), "VST" (Video Start Time), "VPF" (Video Playback Failure), and so on.
-
Stream-only customers see the same metrics labeled as "SSF" (Stream Start Failure), "SST" (Stream Start Time), and "SPF" (Stream Playback Failure).
Display order:
Content Metrics - Must Have --> Content Metrics - Should Have --> Ad Metrics - Must Have and --> Ad Metrics - Should Have
This report focuses on computing the Must-have content metrics to highlight the under performing ones in the Need Attention field. Fix these impacted metrics before moving on to the Metadata tab.Metadata Report

The metadata report displays the Required and Custom metadata with the status Pass, Fail, or N/A. Identify the custom metadata type by the tag, Content or Ad, adjacent to the metadata key.SDK & Validation Details

This page lists the apps with their last Validated On date, and the newest SDK version if available. The hyperlink on the version number redirects you to the corresponding platform integration page on the Learning Center. To download and integrate the latest SDK version, refer to the instructions on the Learning Center page. -
-
To download the reports (in Excel format) , select the Status Report Download option and choose the apps.
 Integration Overview Reports
Integration overview reports help to analyze the integration details and the validation improvement progress for each app for a selected time period of 3 months, 6 months, 9 months, or 12 months. These reports use graphical representations to show the impact or improvement of metrics and metadata.
Integration Overview Report
-
Navigate to the Reports tab.
-
Select Integration Overview from the Show dropdown menu.
-
Select the desired app from the App Name dashboard menu.
Note: You can generate the Integration Overview report for one app at a time; not for all available apps.
-
Choose the time period.
-
This report provides the details such as:
 Build Mapping
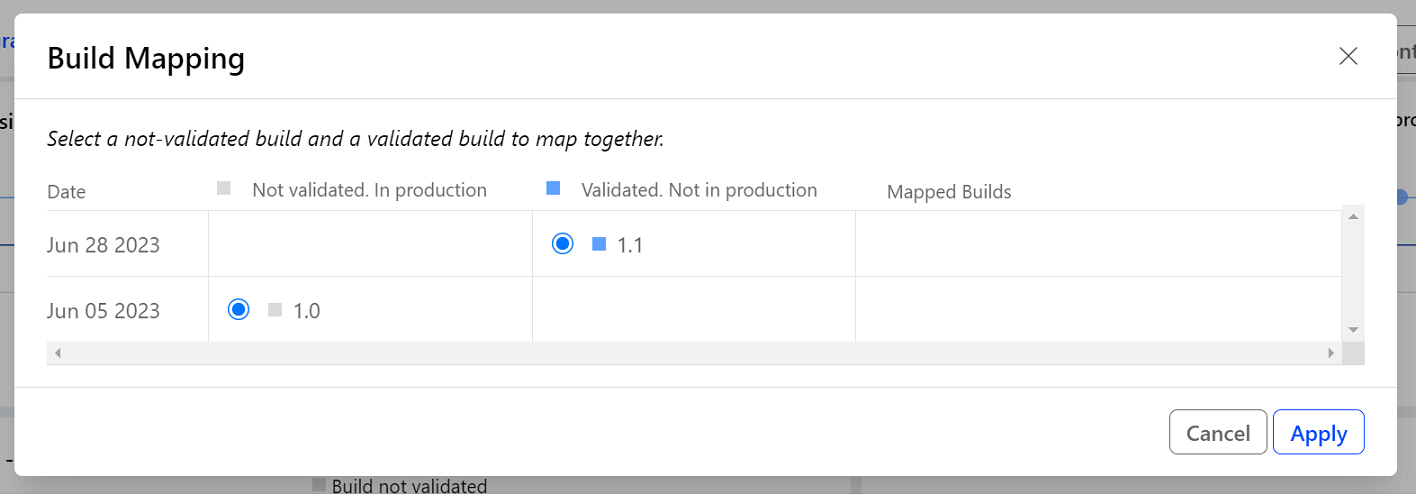
This feature enables mapping the Validated - Not In Production builds against the Not validated - In production builds.
VSI Integration tracks the performance of metrics and metadata as part of the build validation process. If builds are directly deployed in production without being validated, it's difficult to know the exact impacted metrics and failed metadata. There can be instances where the validated build and the direct production-deployed build are technically similar with different build versions. In such cases, mapping these builds enables the data availability in VSI Integration.
Build Mapping
-
Navigate to the Reports tab, select the Integration Overview report, and choose an application to generate the report.
For example, the selected app Roku | Exec Report has a Validated - Not in production build and a Not validated - In production build as shown in the App Submission Distribution chart.

The Test Results - Metrics graph shows the details for these two builds separately, where in the not-validated build doesn't have any details in VSI Integration.
-
Select the Build Mapping option.
-
Select the corresponding validated and not-validated builds.
-
Click Apply to map the builds. The graphs now show only the mapped In Production build. You can choose to detach the mapped builds.
App Submission Distribution
Test Results - Metrics


