The following video is a demonstration on how to use the Conviva Pulse Salesforce Application.
|
Conviva Pulse Salesforce Application Demo |
Performance Graph over Time
The Performance Graph over Time graph helps you to visualize the viewer streaming performance so that you can quickly determine if your viewers experience issues regularly.
The stacked vertical bar chart displays the good and bad sessions over a period. The line chart displays the Viewer SPI score (the SPI score for a particular viewer), Publisher SPI score (the SPI score for a publisher), and the number of successful and impacted sessions. For more information about SPI, see Overview Dashboard Help.
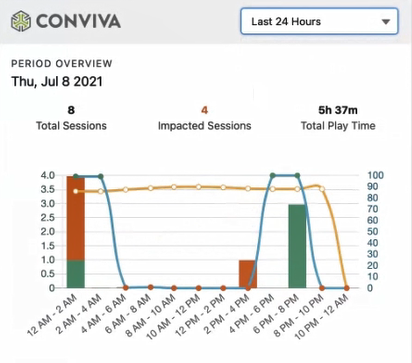
A time filter selector is available to toggle the time period between 24 hours, 7 days, and all data.
| Time Filter | Description |
|---|---|
| Last 24 Hours | Displays a breakdown of the viewer streaming data for 24 hours. |
| Last 7 Days | Displays a breakdown of the viewer streaming data for 7 days. |
| All Data | Displays a breakdown of the viewer streaming data for the entire streaming period. |
Table of Viewers Session History
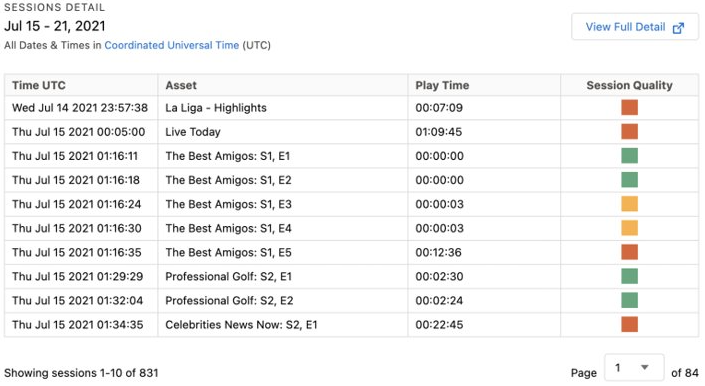
The Table of Viewers Session History table helps you view individual viewer sessions, so that you can drill into additional information for every issue that your viewers encounter. It is filterable by the time filter and sortable by session date.
Click on a stacked bar in the bar chart of the Performance Graph over Time graph to filter the list.
| Column | Description |
|---|---|
| Time UTC | The time when Conviva received the first heartbeat for the session. The time zone is Coordinated Universal Time (UTC). |
| Asset | The name of the asset that was viewed. |
| Play Time | The amount of time when a player is actively displaying video content during a session. |
| Session Quality | The session quality is displayed for each asset and it depends on the overall quality of the stream. Various factors, such as low or high rebuffering rate, errors, picture quality, etc. determine the session quality. For more information about sessions, see Viewer Sessions. |
Click View Full Detail button to view the most granular information about each session.
| Column | Description |
|---|---|
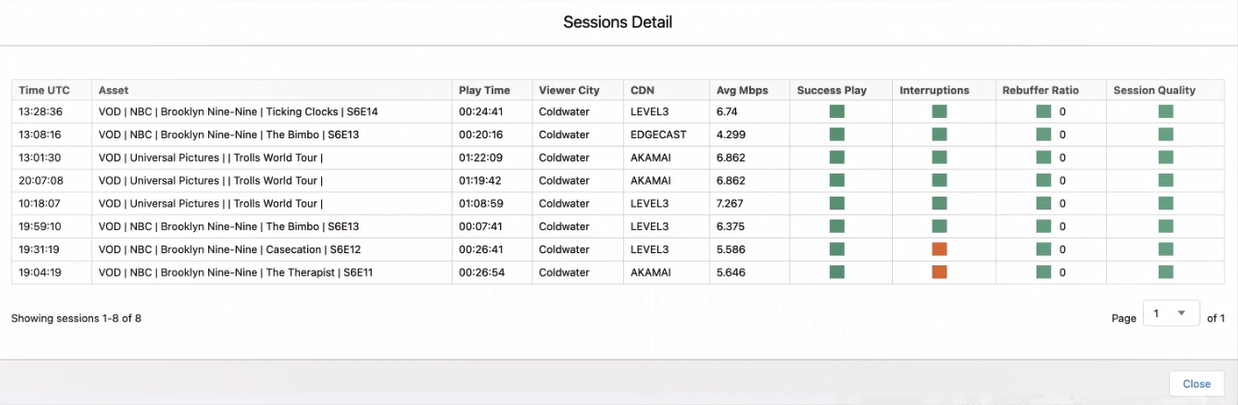
| Time UTC | The time when Conviva received the first heartbeat for the session. The time zone is Coordinated Universal Time (UTC). |
| Asset | The name of the asset that was viewed. |
| Play Time | The amount of time when a player is actively displaying video content during a session. |
| Viewer City | The name of the city where the asset was viewed. |
| CDN | The CDN used in the viewing session. |
| Avg Mbps | The average speed in which the content was played. For more information, see Average Peak Bitrate. |
| Success Play | Indicates whether the play was successful or not. |
| Interruptions | Indicates whether the session was interrupted for rebuffering. |
| Rebuffering Ratio | The percentage of total video viewing time (playing time + rebuffering time) during which viewers experienced rebuffering. For more information, see Rebuffering Ratio. |
| Session Quality | The session quality is displayed for each asset and it depends on the overall quality of the stream. Various factors, such as low or high rebuffering rate, errors, picture quality, etc. determine the session quality. For more information about sessions, see Viewer Sessions. |
Click on a session to view more information about the session. To learn more about the viewer session metrics, see Viewer Sessions.
| Field | Description |
|---|---|
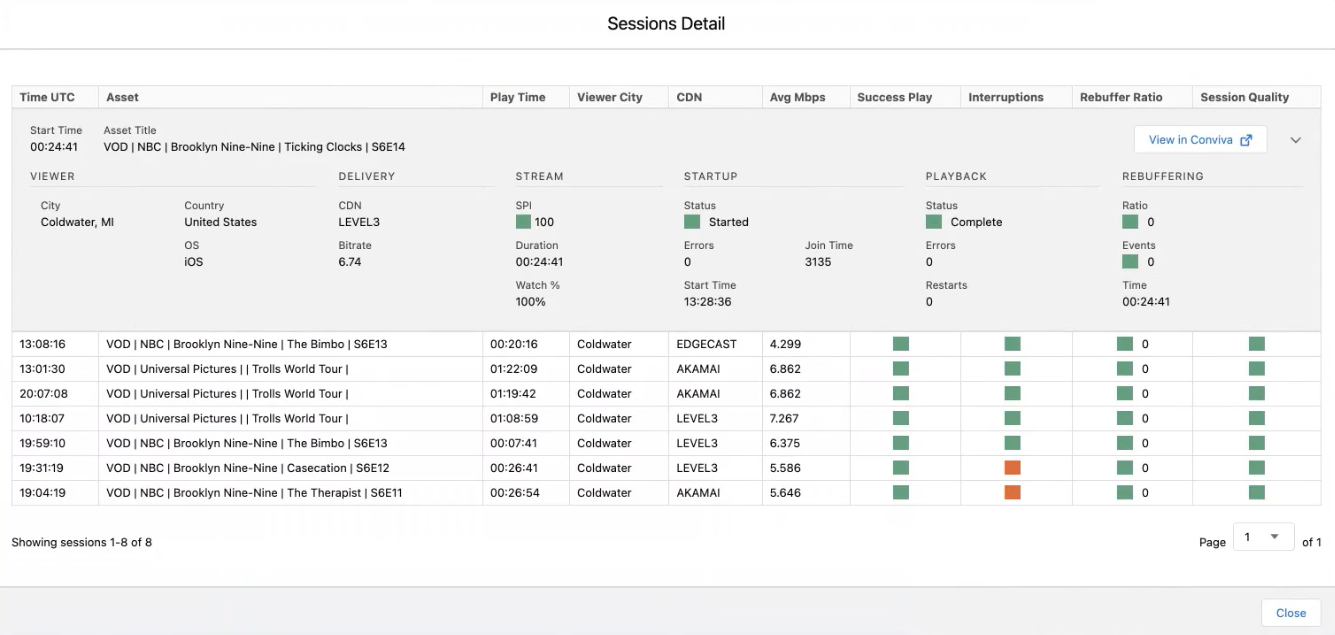
| Asset Title | The name of the asset that was viewed. |
| City | The name of the city where the asset was viewed. |
| Country | The name of the country where the asset was viewed. |
| OS | The Operating System of the device in which the asset was played. |
| CDN | The name of the CDN used in the viewing session. |
| Bitrate | The average speed in which the content was played. For more information, see Average Peak Bitrate. |
| SPI | The visual indicator of your KPIs and metric performance over the selected period. For more information, see Overview Dashboard Help. |
| Duration | The amount of time when a player is actively displaying video content during a session. |
| Watch % | The percentage of video content the viewer watched during the session. Watch % is calculated by dividing the total playing time for the session by the total content length and is rounded to the nearest integer value. |
| Status (Startup) | The startup status. |
| Errors (Startup) | The total number of startup errors. |
| Join Time | The number of milliseconds between the start of the Conviva monitoring and the first played video frame. |
| Start Time | The time when Conviva received the first heartbeat for the session. The time zone is Coordinated Universal Time (UTC). |
| Status (Playback) | The playback status. |
| Errors (Playback) | The total number of playback errors. |
| Restarts | The total number of restarts. |
| Interruptions | The number of times the session was interrupted for rebuffering. |
| Ratio | The percentage of total video viewing time (playing time + rebuffering time) during which viewers experienced rebuffering. For more information, see Rebuffering Ratio. |
| Events | The total number of rebuffering events. |
| Time | The amount of time when a player is actively displaying video content during a session. |
Click View in Conviva button to view the session information in Pulse provided that you have access to Pulse.
Note: If you do not have access to Pulse, contact Conviva customer support (support@conviva.com).